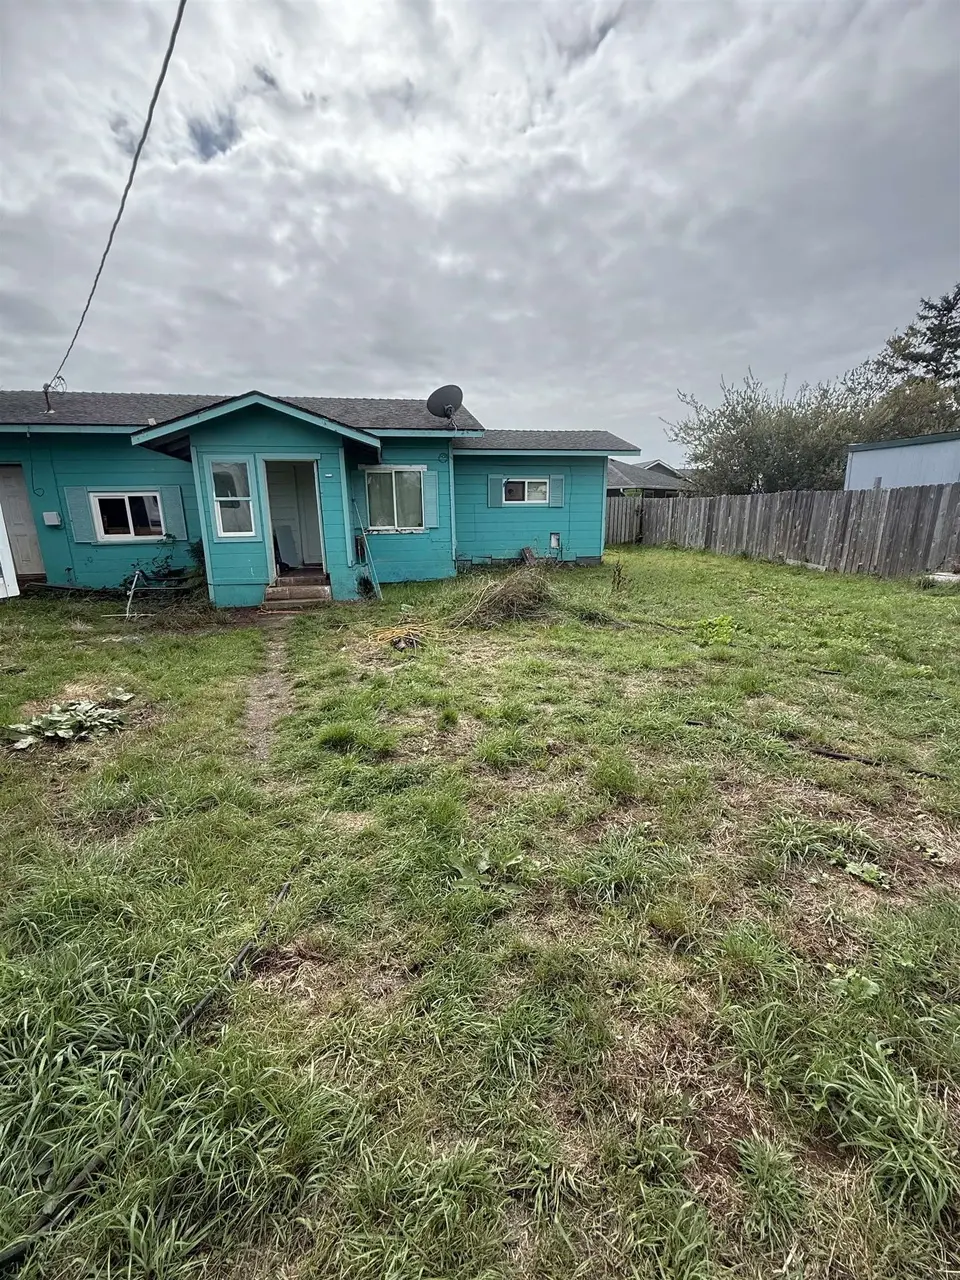
227 Ruchong Ln · Crescent City, CA
Flood risk 1/10 · Minimal
- FEMA flood zone
- X (unshaded)
- Chance of flooding over 30 yrs
- 0.0%
- Est. flood insurance / yr
- $507 – $1,088
Fire risk 2/10 · Minimal
- Est. fire insurance / yr
- $659 – $1,223
Heat risk 2/10 · Minimal
- Hot days now (above 71°F)
- 8 days/yr
- Hot days in 30 yrs
- 27 days/yr
Wind risk 1/10 · Minimal
- Chance of severe wind over 30 yrs
- —
Air-quality risk 6/10 · Moderate
- Unhealthy air days now
- 8 days/yr
- Unhealthy air days in 30 yrs
- 9 days/yr
Risk factors via First Street. Map © Google.
Why this score? — see what drove the B- grade
The composite is a weighted blend of 9 inputs, each scored 0–100. Each bar is that input's sub-score; the figure is the points it added to the 100-point composite (weight × sub-score).
- Cash flow +27.2/30.0
- ARV discount +15.0/15.0
- DSCR +9.4/10.0
- 1% rule +6.5/10.0
- Livability +2.9/5.0
- Schools +2.8/10.0
- Rent growth +2.5/5.0
- Condition / age +2.5/5.0
- Appreciation +0.0/10.0
$125,500
🖨 Deal sheet (PDF) 📄 Offer letter ✓ Due diligence
Listing remarks MLS
Affordable opportunity with tons of potential! This 2-bedroom, 1-bath home sits on a peaceful . 15-acre lot and offers solid basics to build from. Featuring vinyl windows, a well-maintained roof, and a livable layout, it’s the perfect chance to update at your own pace or create instant equity with a full renovation. Whether you’re a first-time buyer, investor, or weekend DIYer, this property offers a great foundation in a quiet setting — ready for your vision and finishing touches
Key facts
- Vinyl windows
- Well maintained roof
- Livable layout
Tags
Neighborhood map
What this means for you Summary
Snapshot
- This is a 2-bed/1.0-bath single-family listed at $126k.
Deal economics
- At list price, monthly cash flow is $359 ($4k/yr) — positive.
- The deal already cash-flows at list — no discount required.
- Meets the 1% rule at list price ($1k rent vs $126k).
- Recommended offer: $110k (12.0% below list) — sets the bar for market timing.
- Cap rate 9.7% vs local median 3.1% in Crescent City — top-decile yield for the area; either an underpriced asset or a hidden risk that comps aren't pricing in. Stress-test before assuming the spread holds.
Location & tenants
- Location reads 57/100 on livability (#730 in CA) — a working-class tenant base; expect higher turnover. Strengths: health & safety A+, housing A; Watch: cost of living D, crime F, amenities F.
- Del Norte County Unified (town): math 25% / reading 36% proficiency, ranked #1,047 of 1,400 in CA (top 75%) — families likely to look elsewhere, expect single-tenant / working-renter base with shorter leases.
- Zoned schools: Crescent Elk Middle (491 students, 72% FRL).
- Market conditions: 230 active listings in the ZIP; 55 units permitted in Del Norte County in 2024 (22 in 5+ unit buildings).
Forward outlook
- Local home prices are declining (-3.0%/yr); year-one equity from $868 of loan paydown is wiped out by about $4k of value loss. Plan a longer hold.
- Del Norte County population projected at -14% by 2050 — secular population decline; favor cash flow + early exit over multi-decade hold.
- At projected returns (-3.0% appreciation + 3.0% rent growth), your $35k cash investment doubles in ~10 years — after that, you're playing with house money.
Negotiation context
- It's been on market 230 days — a 12% lower offer ($110k) is reasonable based on typical stale-listing flexibility.
- Current owner paid $55k; list at $126k implies a 128% gain — meaningful room to come down on a strong offer.
Risks & watch-outs
- Watch-outs: built in 1956 — expect roof / HVAC / electrical / plumbing capex.
Questions for the listing agent
- It's been on market 230 days. Have you received any prior offers? Is the seller open to a 12% concession, seller financing, or rate buy-down credit?
- Built in 1956 — when were the roof, HVAC, electrical panel, plumbing, and water heater last replaced?
- Why hasn't it sold? Are there any deal-killer items the seller is aware of (foundation, flood, title, zoning, code violations)?
- Is there a deadline driving the sale (1031 exchange, divorce, estate, relocation)? That informs how much negotiation room exists.
- Schools are D-rated, which usually means shorter tenancies and higher turnover. Who's the typical renter profile here, and what's been the actual vacancy rate?
- Crime grade is F in this area — have there been break-ins, vandalism, or insurance claims at this property in the last 3 years? What carrier currently insures it and at what premium?
- What's the average days-on-market for RENTAL listings here right now (not sales)? A rising rental-DOM trend means longer vacancies and softer asking-rent achievability than the comps imply.
- What's the recent tenant-quality profile in this submarket — average credit score on applications, eviction rate, late-payment / NSF rate, and stable-employment percentage? A property-management company in the area should have these aggregated.
- How much new for-sale + rental construction is in the pipeline within 1–3 miles? Heavy new supply typically softens prices + rents 12–24 months out; constrained supply supports both.
Investment metrics
- 1% rule
- 1.15% ✓
- Cap rate
- 9.72%
- Cash-on-cash
- 12.25%
- DSCR
- 1.54
- GRM
- 7.3
CMA / ARV
- ARV (median comp)
- $199,400
- List price
- $125,500
- Delta
- -37.06%
- Verdict
- UNDERPRICED
- Comps
- 20 within 1.0 mi
Show comp detail 2 sales within ~0.75 mi
| Address | Dist | Beds/Ba | Sqft | Sold | Price | $/sf | Match |
|---|---|---|---|---|---|---|---|
| 752 Pacific Ave | 0.48mi | 2/1.0 | 620 (+2%) | 22mo | $48,000 | $77 | 55 |
| 760 D St | 0.75mi | 2/1.0 | 696 (+15%) | 9mo | $280,000 | $402 | 33 |
Match score weights: distance 35% · size 25% · config 20% · recency 20%. Top-matched comps best support the ARV.
Projected returns pro-forma
-3.0% appreciation · 3.0% rent growth · sell at horizon
- IRR
- 1.8%
- Equity multiple
- 1.07×
- Total profit
- $2,469
- Equity at exit
- $18,712
- IRR
- 11.4%
- Equity multiple
- 1.89×
- Total profit
- $31,425
- Equity at exit
- $10,851
Cash invested: $35,140 (down + closing). Projections, not guarantees.
Landlord ↔ Tenant lean methodology
- Overall (STATE)
- 18 Strongly Tenant-Friendly
- State California
- 18 Strongly Tenant-Friendly · D+13
- County
- — inherits STATE
- City
- — inherits STATE
ZIP-level market 95531
- Active inventory
- 230
- Price-to-rent
- 7.3×
Monthly cashflow live
- Estimated rent
- $1,440 medium interval (Pro) →
- Mortgage (P&I)
- −$658
- Tax from tax record
- −$68 /mo · $821/yr
- Insurance
- −$52
- HOA
- −$0
- Vacancy / Maint / Mgmt
- −$302
- Net cashflow
- $359
Break-even live
Sensitivity live
| Price | -10% $430 | -5% $394 | +0% $359 | +5% $323 | +10% $288 |
|---|---|---|---|---|---|
| Rent | -10% $245 | -5% $302 | +0% $359 | +5% $415 | +10% $472 |
| Rate | -1.0pp $422 | -0.5pp $391 | base $359 | +0.5pp $326 | +1.0pp $293 |
UW: 25.0% down · 7.5% · 30yr · 1.5% tax · 5.0% vac · 8.0% maint · 8.0% mgmt
Financing live
Cash to close
- Down payment
- $31,375
- Closing costs
- $3,765
- Reserves months
- —
- Total cash needed
- —
Loan-product check · same deal, 3 products live
Conventional
25% down · 7.5% · 30yr
- Down + closing
- —
- Monthly P&I
- —
- Monthly cashflow
- —
- DSCR
- —
- Eligible?
- —
Personal DTI + credit; lowest rate.
DSCR
20% down · 8.5% · 30yr
- Down + closing
- —
- Monthly P&I
- —
- Monthly cashflow
- —
- DSCR
- —
- Eligible?
- —
No personal income docs; deal must DSCR.
Hard money
10% down · 12.0% · 12mo
- Down + closing
- —
- Monthly P&I
- —
- Monthly cashflow
- —
- DSCR
- —
- Eligible?
- —
Short-term bridge; refi at stabilization.
Listing history 6 events
-
2026-05-31days on market $125,500 Active 230 DOM
-
2026-04-20price $125,500 503-char remark
Show marketing remark (503 chars)
Affordable opportunity with tons of potential! This 2-bedroom, 1-bath home sits on a peaceful . 15-acre lot and offers solid basics to build from. Featuring vinyl windows, a well-maintained roof, and a livable layout, it’s the perfect chance to update at your own pace or create instant equity with a full renovation. Whether you’re a first-time buyer, investor, or weekend DIYer, this property offers a great foundation in a quiet setting — ready for your vision and finishing touches
-
2026-02-15price $129,000 503-char remark
Show marketing remark (503 chars)
Affordable opportunity with tons of potential! This 2-bedroom, 1-bath home sits on a peaceful . 15-acre lot and offers solid basics to build from. Featuring vinyl windows, a well-maintained roof, and a livable layout, it’s the perfect chance to update at your own pace or create instant equity with a full renovation. Whether you’re a first-time buyer, investor, or weekend DIYer, this property offers a great foundation in a quiet setting — ready for your vision and finishing touches
-
2025-10-12$139,000 Active 503-char remark
Show marketing remark (503 chars)
Affordable opportunity with tons of potential! This 2-bedroom, 1-bath home sits on a peaceful . 15-acre lot and offers solid basics to build from. Featuring vinyl windows, a well-maintained roof, and a livable layout, it’s the perfect chance to update at your own pace or create instant equity with a full renovation. Whether you’re a first-time buyer, investor, or weekend DIYer, this property offers a great foundation in a quiet setting — ready for your vision and finishing touches
-
2020-04-14soldstatus $55,000 52-char remark
Show marketing remark (52 chars)
Home is in rough condition. Will need a lot of work.
-
2020-04-14soldstatus $55,000
Show marketing remark (52 chars)
Home is in rough condition. Will need a lot of work.
ⓘ Source: listings_history table (triggers on properties + properties_extension) + one-shot
backfill from property_details.listing_events for pre-trigger history.
Tax reassessment forecast CA · Resets to sale price
- Current annual tax
- $821 · $68/mo
- Projected year-2 tax
- $954 · $79/mo
- Expected delta
- +$133/yr (+$11/mo · 16.2%)
ⓘ Screening estimate from a state-policy table — verify with the county assessor before closing.
Climate risk First Street
- Flood 1/10 Low FEMA zone X (unshaded) · 0% chance over 30 yrs
- Wildfire 2/10 Low
- Heat 2/10 Low 8 d/yr ≥71°F today · 27 d/yr by 30 yrs out
- Wind 1/10 Low
- Air quality 6/10 Major 8 unhealthy d/yr today · 9 by 30 yrs out
Nearby sold comps map
Loading sold comps map…
Walkable amenities ~0.75 mi
Loading nearby amenities…
Taxation est. · year 1
- Rental income
- $17,277
- − Mortgage interest
- −$7,030
- − Property taxes
- −$821
- − Insurance
- −$628
- − Repairs & maintenance
- −$1,382
- − Management
- −$1,382
- − Depreciation
- −$3,651
- Taxable income
- $2,384
- Est. tax owed @ 24.0%
- −$572
- After-tax cash flow
- $3,731/yr
For passive investors: Depreciation is non-cash, so a rental often shows a tax loss while cash-flowing — sheltering income. Rental losses are passive: they offset passive income freely, and up to $25,000/yr can offset ordinary (W-2) income if you actively participate and your MAGI is under $100k (phasing out to $0 by $150k); unused losses carry forward. On sale, claimed depreciation is recaptured at up to 25%, and gains may owe capital-gains tax (a 1031 exchange can defer both). Figures are a year-1 estimate at your 24.0% rate — not tax advice; consult a CPA.
Schools (NCES district)
- District
- Del Norte County Unified
- NCES district ID
- 0610770
- Math proficiency
- 25% ▲ 1.00%
- Reading proficiency
- 36% ▲ 1.00%
- Median HH income
- $39,747
- Composite
- 28.43/100
- National rank
- #12110
- State rank
- #1047 of 1400 in CA
Livability — Crescent City
- Score
- 57/100
- State rank
- #730
- US rank
- #21544
Category grades
Schools grade is shown separately in the Schools card above.
Census & demographics
- Population (ZIP)
- 22,491
Population outlook (Del Norte County) Hauer SSP2
- Today (2025)
- 25,011 people
- By 2030
- 24,204 · -3.2%
- By 2040
- 22,826 · -8.7%
- By 2050
- 21,495 · -14.1%
- By 2075
- 18,487 · -26.1%
- By 2100
- 16,113 · -35.6%
Race, ethnicity, and origin ACS 2023
- Neighborhood character
- Diverse neighborhood (Simpson 0.58)
- Race & ethnicity
- White 61% Hispanic / Latino 20% Two or more races 12% Native American 5% Asian 4% Black 3%
- Hispanic origin (detail)
- Mexican 15%
- Common ancestry
- Slovak 4% Russian 2% Lithuanian 2%
- Foreign-born
- 8% · Canada, Vietnam, South Korea
- Languages at home
- 88% English-only · Spanish 8% Other Asian/Pacific 2% Vietnamese 1%
Political lean MEDSL · Del Norte
- 2024 margin
- R (+16.4) · D 40.4% · R 56.8% · Other 2.8%
- 2008→2024 swing
- -9.7pp toward R · 2008: -6.8pp · 2024: -16.4pp
- All cycles
- 2024: R+16.4 2020: R+15.6 2016: R+17.6 2012: R+10.8 2008: R+6.8
Not yet ingested
- Civics
- —
Market trends
- HPI YoY
- ▼ -300.53%
- Current HPI
- 148.4819
- Rent YoY
- —
- Metro
- —
- State GDP YoY
- ▲ 3.21%
- F500 in state
- 116
Industry mix (Fortune 500 HQ in CA)
| Industry | F500 HQs | Revenue |
|---|---|---|
| Technology | 27 | $1,492B |
|
||
| Financial Services | 3 | $174B |
|
||
| Retail | 3 | $44B |
|
||
| Insurance | 3 | $26B |
|
||
| Media / Entertainment | 2 | $115B |
|
||
| Pharmaceuticals / Biotech | 2 | $62B |
|
||
Price history
+128.2% since first listed5 events — show timeline
- 2026-04-20 Price Changed $125,500 DNAORMLS
- 2026-02-15 Price Changed $129,000 DNAORMLS
- 2025-10-12 Listed $139,000 DNAORMLS
- 2020-04-14 Sold (Public Records) $55,000 Public Records
- 2020-04-14 Sold (MLS) $55,000 DNAORMLS
Property tax history
+6.4%/yrLatest (2025): $821 · -3.4% YoY. Source: county tax records.
Cash-flow waterfall
monthlySold comps — $/sqft
last 12 mo · ≤1 miLoading sold comps…