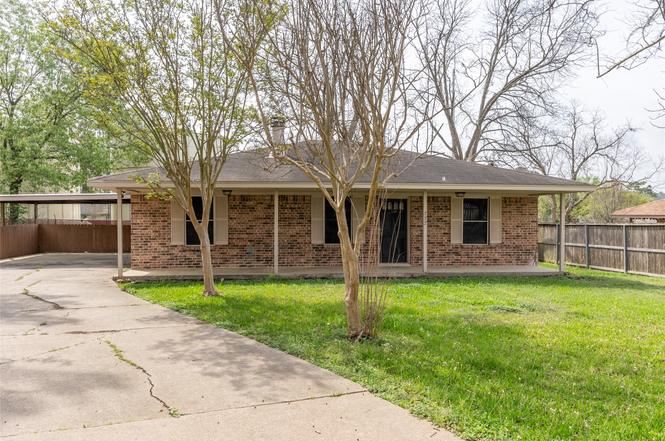
222 Cool Cv · Conroe, TX
Flood risk 1/10 · Minimal
- FEMA flood zone
- X (unshaded)
- Chance of flooding over 30 yrs
- 0.0%
- Est. flood insurance / yr
- $507 – $1,088
Fire risk 4/10 · Minor
- Est. fire insurance / yr
- $1,222 – $2,270
Heat risk 8/10 · Major
- Hot days now (above 110°F)
- 7 days/yr
- Hot days in 30 yrs
- 24 days/yr
Wind risk 8/10 · Major
- Chance of severe wind over 30 yrs
- 99.0%
Air-quality risk 2/10 · Minimal
- Unhealthy air days now
- 1 days/yr
- Unhealthy air days in 30 yrs
- 1 days/yr
Risk factors via First Street. Map © Google.
Why this score? — see what drove the B grade
The composite is a weighted blend of 9 inputs, each scored 0–100. Each bar is that input's sub-score; the figure is the points it added to the 100-point composite (weight × sub-score).
- Cash flow +26.9/30.0
- ARV discount +15.0/15.0
- DSCR +9.3/10.0
- 1% rule +7.9/10.0
- Schools +5.4/10.0
- Livability +3.7/5.0
- Condition / age +2.5/5.0
- Rent growth +1.7/5.0
- Appreciation +0.0/10.0
$150,000
🖨 Deal sheet 📄 Offer letter ✓ Due diligence
Listing remarks
Looking for an investor home in Montgomery, Texas or a fixer-upper near Lake Conroe? This Cape Conroe property could be a strong option for a investor, or handy buyer looking for a home with upside. It offers 3 bedrooms, 2 baths, an open layout, fireplace, and one of the largest lots in the neighborhood. The home needs updating and repairs, but it is priced below market value and offers access to community amenities including a pool, basketball court, private lake access, and boat ramp. Located near marinas, dining, shopping, golf, and Hwy 105 in Montgomery ISD.
Key facts
- Montgomery isd
- Community amenities
- Largest lots
Tags
Neighborhood map
What this means for you Summary
Snapshot
- This is a 3-bed/1.5-bath single-family listed at $150k.
Deal economics
- At list price, monthly cash flow is $416 ($5k/yr) — positive.
- The deal already cash-flows at list — no discount required.
- Meets the 1% rule at list price ($2k rent vs $150k).
- Recommended offer: $146k (3.0% below list) — sets the bar for market timing.
- Cap rate 9.6% vs local median 3.1% in Conroe — top-decile yield for the area; either an underpriced asset or a hidden risk that comps aren't pricing in. Stress-test before assuming the spread holds.
Location & tenants
- Location reads 74/100 on livability (#169 in TX, #4,447 nationally) — a middle-class / working-renter tenant base. Strengths: cost of living A+, housing A+, amenities B; Watch: commute F, health & safety F.
- Montgomery ISD (rural): math 63% / reading 57% proficiency, ranked #49 of 826 in TX (top 6%) — acceptable for families but not a draw, mixed tenant base, ~2y average lease.
- Zoned schools: Stewart Creek El (math 49% / reading 58%, grade C, #686 of 4,322 statewide, top 16%, 738 students, 46% FRL); Montgomery J H (math 68% / reading 54%, grade B+, #145 of 1,662 statewide, top 9%, 1,045 students, 30% FRL); Montgomery H S (math 53% / reading 62%, grade C, #327 of 1,632 statewide, top 20%, 1,556 students, 25% FRL).
- Market conditions: Rents falling (-3.3%/yr); 1056 active listings in the ZIP; 6 comparable units currently listed for rent nearby; rentals lingering (median 44d on market — plan ~5-8 weeks vacancy on turnover, expect pricing pressure); 67% of comp listings sitting > 30 days — soft ceiling on asking rent; solid renter incomes; 13,259 units permitted in Montgomery County in 2024 (1,402 in 5+ unit buildings).
Forward outlook
- Local home prices are declining (-3.0%/yr); year-one equity from $1k of loan paydown is wiped out by about $4k of value loss. Plan a longer hold.
- Montgomery County population projected at +65% by 2050 — long-run rental-demand tailwind backs the buy-and-hold thesis.
Negotiation context
- It's been on market 39 days — a 3% lower offer ($146k) is reasonable based on typical stale-listing flexibility.
- 9 sale attempts since 4y ago with the ask held roughly flat each time — persistent listings suggest the price (not the market) is what's stuck; bring a comps-based counter.
- Current owner paid $58k; list at $150k implies a 160% gain — meaningful room to come down on a strong offer.
Risks & watch-outs
- Climate carrying-cost: severe wind risk, 99% chance of damaging wind over 30y; extreme-heat days projected 7→24/yr by 2055 (HVAC capex compounding) — expect insurance premiums to compound above CPI over the hold.
Questions for the listing agent
- It's been on market 39 days. Have you received any prior offers? Is the seller open to a 3% concession, seller financing, or rate buy-down credit?
- What does the HOA fee cover, when was the last increase, and are there any pending special assessments or reserve-fund shortfalls?
- Is there a deadline driving the sale (1031 exchange, divorce, estate, relocation)? That informs how much negotiation room exists.
- Schools are D-rated, which usually means shorter tenancies and higher turnover. Who's the typical renter profile here, and what's been the actual vacancy rate?
- What's the average days-on-market for RENTAL listings here right now (not sales)? A rising rental-DOM trend means longer vacancies and softer asking-rent achievability than the comps imply.
- What's the recent tenant-quality profile in this submarket — average credit score on applications, eviction rate, late-payment / NSF rate, and stable-employment percentage? A property-management company in the area should have these aggregated.
- How much new for-sale + rental construction is in the pipeline within 1–3 miles? Heavy new supply typically softens prices + rents 12–24 months out; constrained supply supports both.
Investment metrics
- 1% rule
- 1.29% ✓
- Cap rate
- 9.62%
- Cash-on-cash
- 11.87%
- DSCR
- 1.53
- GRM
- 6.5
CMA / ARV
- ARV (on-the-fly)
- $223,168
- Comps found
- 12
Show comp detail 12 sales within ~0.75 mi
| Address | Dist | Beds/Ba | Sqft | Sold | Price | $/sf | Match |
|---|---|---|---|---|---|---|---|
| 10515 Scenic Dr | 0.07mi | 3/2.0 | 1,211 (-4%) | 11mo | $213,000 | $176 | 78 |
| 331 Lake View Dr | 0.11mi | 3/2.0 | 1,381 (+9%) | 9mo | $219,900 | $159 | 70 |
| 207 Leisure Ln | 0.40mi | 3/2.0 | 1,252 (-1%) | 11mo | $180,000 | $144 | 68 |
| 10914 Seibel Ln | 0.48mi | 3/2.0 | 1,306 (+3%) | 4mo | $239,000 | $183 | 67 |
| 10818 Highpoint Ln | 0.34mi | 3/2.0 | 1,376 (+8%) | 2mo | $169,900 | $123 | 66 |
| 419 Paradise Ln | 0.13mi | 3/2.0 | 1,452 (+14%) | 3mo | $175,000 | $121 | 65 |
| 431 Paradise Ln | 0.17mi | 2/2.0 (-1) | 1,122 (-12%) | 6mo | $155,000 | $138 | 61 |
| 18632 Century Pine Ln | 0.65mi | 3/2.0 | 1,287 (+2%) | 12mo | $289,790 | $225 | 55 |
| 18623 Century Pine Ln | 0.67mi | 3/2.0 | 1,287 (+2%) | 12mo | $264,390 | $205 | 54 |
| 18607 Century Pine Ln | 0.66mi | 3/2.0 | 1,287 (+2%) | 13mo | $261,440 | $203 | 54 |
| 18529 Meadow Point Ln | 0.52mi | 3/2.0 | 1,453 (+15%) | 9mo | $255,000 | $175 | 42 |
| 18651 Century Pine Ln | 0.69mi | 3/2.0 | 1,405 (+11%) | 13mo | $264,140 | $188 | 37 |
Match score weights: distance 35% · size 25% · config 20% · recency 20%. Top-matched comps best support the ARV.
Projected returns pro-forma
-3.0% appreciation · 0.0% rent growth · sell at horizon
- IRR
- -2.2%
- Equity multiple
- 0.92×
- Total profit
- $-3,438
- Equity at exit
- $22,365
- IRR
- 3.6%
- Equity multiple
- 1.23×
- Total profit
- $9,463
- Equity at exit
- $12,969
Cash invested: $42,000 (down + closing). Projections, not guarantees.
Landlord ↔ Tenant lean methodology
- Overall (STATE)
- 87 Strongly Landlord-Friendly
- State Texas
- 87 Strongly Landlord-Friendly · R+5
- County
- — inherits STATE
- City
- — inherits STATE
ZIP-level market 77356
- Home prices YoY
- -30.3%
- Rents YoY
- -3.3%
- Active inventory
- 1056
- Price-to-rent
- 6.5×
Monthly cashflow live
- Estimated rent
- $1,937 high interval (Pro) →
- Mortgage (P&I)
- −$787
- Tax from tax record
- −$235 /mo · $2,815/yr
- Insurance
- −$62
- HOA
- −$31
- Vacancy / Maint / Mgmt
- −$407
- Net cashflow
- $416
Break-even live
UW: 25.0% down · 7.5% · 30yr · 1.5% tax · 5.0% vac · 8.0% maint · 8.0% mgmt
Financing live
Cash to close
- Down payment
- $37,500
- Closing costs
- $4,500
- Reserves months
- —
- Total cash needed
- —
Loan-product check · same deal, 3 products live
Conventional
25% down · 7.5% · 30yr
- Down + closing
- —
- Monthly P&I
- —
- Monthly cashflow
- —
- DSCR
- —
- Eligible?
- —
Personal DTI + credit; lowest rate.
DSCR
20% down · 8.5% · 30yr
- Down + closing
- —
- Monthly P&I
- —
- Monthly cashflow
- —
- DSCR
- —
- Eligible?
- —
No personal income docs; deal must DSCR.
Hard money
10% down · 12.0% · 12mo
- Down + closing
- —
- Monthly P&I
- —
- Monthly cashflow
- —
- DSCR
- —
- Eligible?
- —
Short-term bridge; refi at stabilization.
Rent comps 6 comps
| Address | Beds | Baths | Sqft | Rent | $/sqft | DOM | Units | Dist |
|---|---|---|---|---|---|---|---|---|
| 607 Lake View Dr Montgomery, TX | 3.0 | 2.0 | 1197 | $1,499 | $1.25 | 43d | 1 | 0.27mi |
| 18544 Meadow Point Ln Montgomery, TX | 3.0 | 2.0 | 1467 | $1,950 | $1.33 | 43d | 1 | 0.50mi |
| 275 Pine Terrace Dr Unit 5106C Montgomery, TX | 3.0 | 2.5 | 1773 | $2,820 | $1.59 | 43d | 1 | 0.83mi |
| 1050 S Pine Lake Rd Montgomery, TX | 2.0 | 2.0 | 1052 | $1,845 | $1.75 | 24d | 1 | 1.19mi |
| 9913 Crescent Cove Dr Montgomery, TX | 3.0–4.0 | 2.5–3.5 | 1805 | $1,499 | $0.83 | 1d | 42 | 1.22mi |
| 298 Capetown Way Unit A Montgomery, TX | 2.0 | 1.5 | 1100 | $1,400 | $1.27 | 43d | 1 | 1.49mi |
HOA detail
- Monthly dues
- $31 · $372/yr
- Likely covers
- pool
Listing history 32 events
-
2026-04-25status Pending
-
2026-04-25historical
-
2026-04-23status Pending
-
2026-04-14status Pending
-
2026-03-30status Active
-
2026-03-29status Pending
-
2026-03-25status Pending
-
2026-03-24status Active
-
2026-03-19status Pending
-
2026-03-13$150,000 Active
-
2026-01-22historical $1,700
-
2026-01-22historical
-
2026-01-14$1,700
-
2025-12-30price $175,000
-
2025-12-07price $180,000
-
2025-12-03$200,000 Active
-
2025-10-21historical $2,200
-
2025-09-30$2,200
-
2025-09-19historical
-
2025-08-31price $230,000
-
2025-08-24$220,000 Active
-
2024-07-25historical
-
2024-06-13$230,000 Active
-
2022-04-13status Pending
-
2022-04-08status Option Pending
-
2022-04-07historical
-
2022-04-06price $230,000
-
2022-04-01$245,000 Active
-
2006-03-17soldstatus
-
1998-03-10soldstatus $57,625
-
1991-05-22soldstatus $56,607
-
1988-07-01soldstatus
ⓘ Source: listings_history table (triggers on properties + properties_extension) + one-shot
backfill from property_details.listing_events for pre-trigger history.
Tax reassessment forecast TX · Resets to sale price
- Current annual tax
- $2,815 · $235/mo
- Projected year-2 tax
- $2,815 · $235/mo
- Expected delta
- $0/yr ($0/mo · 0.0%)
ⓘ Screening estimate from a state-policy table — verify with the county assessor before closing.
Climate risk First Street
- Flood 1/10 Low FEMA zone X (unshaded) · 0% chance over 30 yrs
- Wildfire 4/10 Moderate
- Heat 8/10 Severe 7 d/yr ≥110°F today · 24 d/yr by 30 yrs out
- Wind 8/10 Severe 99% chance of damaging wind over 30 yrs
- Air quality 2/10 Low 1 unhealthy d/yr today · 1 by 30 yrs out
Nearby sold comps map
Loading sold comps map…
Walkable amenities ~0.75 mi
Loading nearby amenities…
Taxation est. · year 1
- Rental income
- $23,244
- − Mortgage interest
- −$8,402
- − Property taxes
- −$2,815
- − Insurance
- −$750
- − Repairs & maintenance
- −$1,860
- − Management
- −$1,860
- − HOA
- −$372
- − Depreciation
- −$4,364
- Taxable income
- $2,822
- Est. tax owed @ 24.0%
- −$677
- After-tax cash flow
- $4,309/yr
For passive investors: Depreciation is non-cash, so a rental often shows a tax loss while cash-flowing — sheltering income. Rental losses are passive: they offset passive income freely, and up to $25,000/yr can offset ordinary (W-2) income if you actively participate and your MAGI is under $100k (phasing out to $0 by $150k); unused losses carry forward. On sale, claimed depreciation is recaptured at up to 25%, and gains may owe capital-gains tax (a 1031 exchange can defer both). Figures are a year-1 estimate at your 24.0% rate — not tax advice; consult a CPA.
Schools (NCES district)
- District
- Montgomery ISD
- NCES district ID
- 4831260
- Math proficiency
- 63% ▼ -3.00%
- Reading proficiency
- 57% ▼ -3.00%
- Median HH income
- $75,596
- Composite
- 53.55/100
- National rank
- #1445
- State rank
- #49 of 826 in TX
Livability — Conroe
- Score
- 74/100
- State rank
- #169
- US rank
- #4447
Category grades
Schools grade is shown separately in the Schools card above.
Census & demographics
- County
- Montgomery County · 663,713 people
- City population
- 205,417
- Metro
- Houston-The Woodlands-Sugar Land, TX
- Population (ZIP)
- 32,583
- Household income
- $106,804
- Rent vs Own
- Severe rent burden
- 414.0
Population outlook (Montgomery County) Hauer SSP2
- Today (2025)
- 713,896 people
- By 2030
- 805,263 · +12.8%
- By 2040
- 992,708 · +39.1%
- By 2050
- 1,179,590 · +65.2%
- By 2075
- 1,628,084 · +128.1%
- By 2100
- 1,937,880 · +171.5%
Race, ethnicity, and origin ACS 2023
- Neighborhood character
- Predominantly White (87%)
- Race & ethnicity
- White 87% Two or more races 5% Hispanic / Latino 5% Black 4%
- Common ancestry
- Lithuanian 8% Slovak 2% Romanian 2%
- Foreign-born
- 3% · Canada, China
- Languages at home
- 96% English-only · Spanish 3%
Political lean MEDSL · Montgomery
- 2024 margin
- Solid R (+45.5) · D 26.8% · R 72.3%
- 2008→2024 swing
- +7.2pp toward D · 2008: -52.7pp · 2024: -45.5pp
- All cycles
- 2024: R+45.5 2020: R+43.8 2016: R+51.4 2012: R+60.7 2008: R+52.7
Not yet ingested
- Civics
- —
Market trends
- HPI YoY
- ▼ -101.28%
- Current HPI
- 233.0032
- Rent YoY
- ▼ -3.30%
- Metro
- Houston-The Woodlands-Sugar Land, TX
- State GDP YoY
- ▲ 3.95%
- F500 in state
- 110
Industry mix (Fortune 500 HQ in TX)
| Industry | F500 HQs | Revenue |
|---|---|---|
| Energy | 16 | $1,198B |
|
||
| Technology | 5 | $198B |
|
||
| Engineering / Construction | 4 | $72B |
|
||
| Energy Services | 3 | $60B |
|
||
| Utilities | 3 | $41B |
|
||
| Healthcare | 2 | $330B |
|
||
Price history
+165.0% since first listed32 events — show timeline
- 2026-04-25 Pending — HARMLS
- 2026-04-25 Listing Removed — HARMLS
- 2026-04-23 Pending — HARMLS
- 2026-04-14 Pending — HARMLS
- 2026-03-30 Relisted — HARMLS
- 2026-03-29 Pending — HARMLS
- 2026-03-25 Pending — HARMLS
- 2026-03-24 Relisted — HARMLS
- 2026-03-19 Pending — HARMLS
- 2026-03-13 Listed $150,000 HARMLS
- 2026-01-22 Rental Removed $1,700 HARMLS
- 2026-01-22 Listing Removed — HARMLS
- 2026-01-14 Listed for Rent $1,700 HARMLS
- 2025-12-30 Price Changed $175,000 HARMLS
- 2025-12-07 Price Changed $180,000 HARMLS
- 2025-12-03 Listed $200,000 HARMLS
- 2025-10-21 Rental Removed $2,200 HARMLS
- 2025-09-30 Listed for Rent $2,200 HARMLS
- 2025-09-19 Listing Removed — HARMLS
- 2025-08-31 Price Changed $230,000 HARMLS
- 2025-08-24 Listed $220,000 HARMLS
- 2024-07-25 Listing Removed — HARMLS
- 2024-06-13 Listed $230,000 HARMLS
- 2022-04-13 Pending — HARMLS
- 2022-04-08 Pending — HARMLS
- 2022-04-07 Listing Removed — HARMLS
- 2022-04-06 Price Changed $230,000 HARMLS
- 2022-04-01 Listed $245,000 HARMLS
- 2006-03-17 Sold (Public Records) — Public Records
- 1998-03-10 Sold (Public Records) $57,625 Public Records
- 1991-05-22 Sold (Public Records) $56,607 Public Records
- 1988-07-01 Sold (Public Records) — Public Records
Property tax history
+3.6%/yrLatest (2025): $2,815 · -18.5% YoY. Source: county tax records.
Cash-flow waterfall
monthlySold comps — $/sqft
last 12 mo · ≤1 miLoading sold comps…