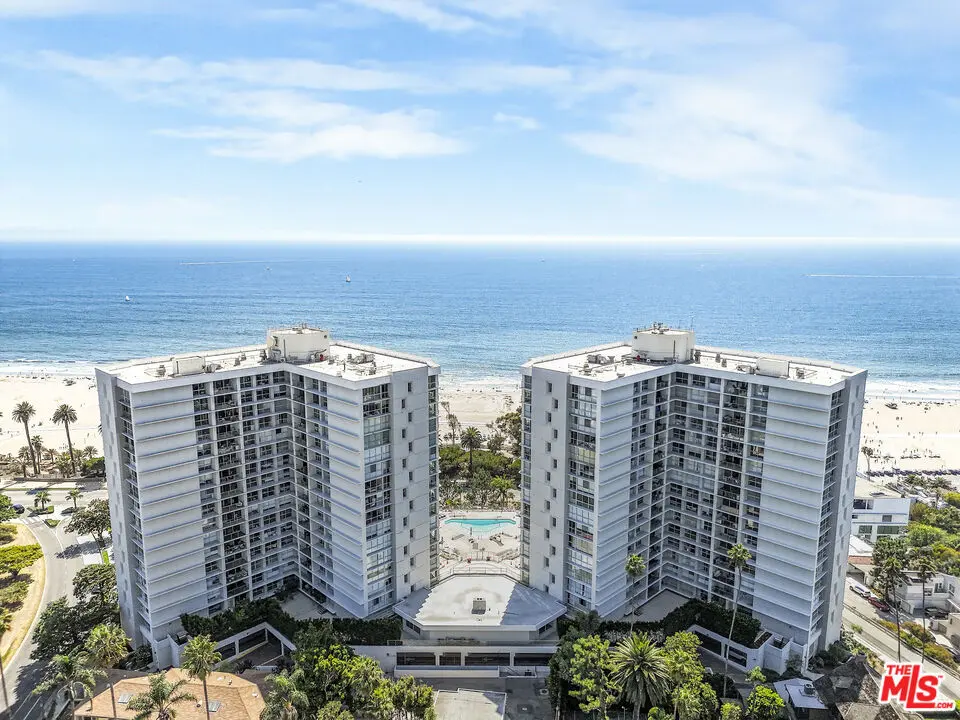
201 Ocean Ave Unit 1105B · Santa Monica, CA
Flood risk 1/10 · Minimal
- FEMA flood zone
- X (unshaded)
- Chance of flooding over 30 yrs
- 0.0%
- Est. flood insurance / yr
- $507 – $1,088
Fire risk 1/10 · Minimal
- Est. fire insurance / yr
- $659 – $1,223
Heat risk 6/10 · Moderate
- Hot days now (above 83°F)
- 7 days/yr
- Hot days in 30 yrs
- 20 days/yr
Wind risk 1/10 · Minimal
- Chance of severe wind over 30 yrs
- —
Air-quality risk 4/10 · Minor
- Unhealthy air days now
- 5 days/yr
- Unhealthy air days in 30 yrs
- 6 days/yr
Risk factors via First Street. Map © Google.
Why this score? — see what drove the F grade
The composite is a weighted blend of 9 inputs, each scored 0–100. Each bar is that input's sub-score; the figure is the points it added to the 100-point composite (weight × sub-score).
- Appreciation +10.0/10.0
- ARV discount +7.5/15.0
- Schools +6.2/10.0
- Livability +3.6/5.0
- Rent growth +3.0/5.0
- Condition / age +2.5/5.0
- 1% rule +0.4/10.0
- Cash flow +0.0/30.0
- DSCR +0.0/10.0
$799,999
🖨 Deal sheet 📄 Offer letter ✓ Due diligence
Listing remarks MLS
Welcome to Santa Monica's premier oceanfront residence, perfectly positioned adjacent to the iconic Santa Monica Beach and Palisades Park. This beautifully updated, quiet, back-facing unit showcases breathtaking views of the Santa Monica Mountains. Blending resort-style amenities with sophisticated urban living, this home offers a truly elevated lifestyle experience. Enjoy serene mountain vistas from your private 11th-floor retreat. Exclusive building amenities include a state-of-the-art fitness center with sauna, pool and spa, 24-hour concierge and security, valet parking, and optional maid service all designed for comfort and convenience. Ideally located near Santa Monica's finest dining, shopping, and entertainment along Montana Avenue, Third Street Promenade, and Ocean Avenue, you'll find everything you need just moments away. Inside, discover a spacious open-concept floor plan perfect for entertaining, featuring wood flooring, a private balcony, and a modern kitchen with stainless steel appliances and custom cabinetry. Experience the quintessential Santa Monica lifestyle at Ocean Towers a residence that defines luxury coastal living.
Key facts
- Custom cabinetry
- Private balcony
- Modern kitchen
Tags
Neighborhood map
What this means for you Summary
Snapshot
- This is a 1-bed/1.0-bath condo listed at $800k.
Deal economics
- At list price, monthly cash flow is $-4k ($-51k/yr) — negative.
- To cash-flow at today's rent, offer at most $167k (79.1% below list).
- To meet the 1% rule (rent ≥ 1% of price), the offer needs to be $430k (46.3% below list).
- Recommended offer: $167k (79.1% below list) — sets the bar for cash-flow.
- Cap rate -0.0% vs local median 1.2% in Santa Monica — below-typical yield; the buyer is paying a premium for something (appreciation thesis, condition, location) that the cap rate doesn't capture.
Location & tenants
- Location reads 72/100 on livability (#178 in CA) — a middle-class / working-renter tenant base. Strengths: schools A+, amenities A+, commute A+; Watch: health & safety C-, crime F, cost of living F.
- Santa Monica-Malibu Unified (urban): math 61% / reading 74% proficiency, ranked #123 of 1,400 in CA (top 9%) — acceptable for families but not a draw, mixed tenant base, ~2y average lease.
- Market conditions: Rents rising (+2.0%/yr); 86 active listings in the ZIP; 40 comparable units currently listed for rent nearby; rentals at typical pace (median 21d on market — plan ~3-4 weeks tenant-placement turnaround); high-income renter base; 19,697 units permitted in Los Angeles County in 2024 (9,426 in 5+ unit buildings).
- This rent runs 32% of the median local income ($159k/yr) — at the standard rent-burdened threshold; future hikes will face affordability resistance.
Forward outlook
- In year one you build about $86k of equity ($6k loan paydown + $80k appreciation (10.0% local appreciation)).
- Los Angeles County population projected at +9% by 2050 — modest demand growth; plan on rents tracking national, not racing it.
- By year 2, paydown + projected appreciation supports a ~$137k cash-out refi (75% LTV) — recoverable capital for the next deal without selling this one.
Negotiation context
- It's been on market 145 days — a 12% lower offer ($704k) is reasonable based on typical stale-listing flexibility.
- 11 sale attempts since 24y ago with the ask held roughly flat each time — persistent listings suggest the price (not the market) is what's stuck; bring a comps-based counter.
- Current owner paid $380k; list at $800k implies a 111% gain — meaningful room to come down on a strong offer.
Risks & watch-outs
- Watch-outs: HOA is 52% of rent.
- Climate carrying-cost: extreme-heat days projected 7→20/yr by 2055 (HVAC capex compounding) — expect insurance premiums to compound above CPI over the hold.
Questions for the listing agent
- What do current leases actually rent for vs. the listed asking? Can we see a recent rent roll and the last 12 months of T-12 income?
- It's been on market 145 days. Have you received any prior offers? Is the seller open to a 79% concession, seller financing, or rate buy-down credit?
- Built in 1971 — when were the roof, HVAC, electrical panel, plumbing, and water heater last replaced?
- What does the HOA fee cover, when was the last increase, and are there any pending special assessments or reserve-fund shortfalls?
- Any open or pending special assessments — roof, HVAC, plumbing, elevator, façade? What's the per-unit balance and payoff schedule, and is the seller paying it off at close or rolling it to the buyer?
- Why hasn't it sold? Are there any deal-killer items the seller is aware of (foundation, flood, title, zoning, code violations)?
- Is there a deadline driving the sale (1031 exchange, divorce, estate, relocation)? That informs how much negotiation room exists.
- Schools are A-rated — typically a magnet for longer-tenancy family renters. What's the average tenant stay here, and is there a school-zone premium baked into asking?
- Crime grade is F in this area — have there been break-ins, vandalism, or insurance claims at this property in the last 3 years? What carrier currently insures it and at what premium?
- The area grade is low — what's the realistic commute time and amenity access for the typical tenant pool here? Any planned neighborhood developments (good or bad) we should know about?
- What's the average days-on-market for RENTAL listings here right now (not sales)? A rising rental-DOM trend means longer vacancies and softer asking-rent achievability than the comps imply.
- What's the recent tenant-quality profile in this submarket — average credit score on applications, eviction rate, late-payment / NSF rate, and stable-employment percentage? A property-management company in the area should have these aggregated.
- How much new apartment / multifamily construction is in the pipeline within 1–3 miles? Heavy new supply (>2% of stock underway) typically softens rents 12–24 months out; light construction supports rent growth.
Investment metrics
- 1% rule
- 0.54% ✗
- Cap rate
- -0.05%
- Cash-on-cash
- -22.64%
- DSCR
- -0.01
- GRM
- 15.5
CMA / ARV
No comps found within radius.
Projected returns pro-forma
10.0% appreciation · 2.03% rent growth · sell at horizon
- IRR
- 8.7%
- Equity multiple
- 1.73×
- Total profit
- $163,750
- Equity at exit
- $720,702
- IRR
- 10.3%
- Equity multiple
- 4.07×
- Total profit
- $688,460
- Equity at exit
- $1,554,222
Cash invested: $224,000 (down + closing). Projections, not guarantees.
Landlord ↔ Tenant lean methodology
- Overall (STATE)
- 18 Strongly Tenant-Friendly
- State California
- 18 Strongly Tenant-Friendly · D+13
- County
- — inherits STATE
- City
- — inherits STATE
ZIP-level market 90402
- Home prices YoY
- 3.0%
- Rents YoY
- 2.0%
- Active inventory
- 86
- Price-to-rent
- 15.5×
Monthly cashflow live
- Estimated rent
- $4,296 high interval (Pro) →
- Mortgage (P&I)
- −$4,195
- Tax from tax record
- −$854 /mo · $10,246/yr
- Insurance
- −$333
- HOA
- −$2,237
- Vacancy / Maint / Mgmt
- −$902
- Net cashflow
- $-4,226
Break-even live
UW: 25.0% down · 7.5% · 30yr · 1.5% tax · 5.0% vac · 8.0% maint · 8.0% mgmt
Financing live
Cash to close
- Down payment
- $200,000
- Closing costs
- $24,000
- Reserves months
- —
- Total cash needed
- —
Loan-product check · same deal, 3 products live
Conventional
25% down · 7.5% · 30yr
- Down + closing
- —
- Monthly P&I
- —
- Monthly cashflow
- —
- DSCR
- —
- Eligible?
- —
Personal DTI + credit; lowest rate.
DSCR
20% down · 8.5% · 30yr
- Down + closing
- —
- Monthly P&I
- —
- Monthly cashflow
- —
- DSCR
- —
- Eligible?
- —
No personal income docs; deal must DSCR.
Hard money
10% down · 12.0% · 12mo
- Down + closing
- —
- Monthly P&I
- —
- Monthly cashflow
- —
- DSCR
- —
- Eligible?
- —
Short-term bridge; refi at stabilization.
Rent comps 40 comps
| Address | Beds | Baths | Sqft | Rent | $/sqft | DOM | Units | Dist |
|---|---|---|---|---|---|---|---|---|
| 134 San Vicente Blvd Unit C Santa Monica, CA | 1.0 | 1.0 | 631 | $3,650 | $5.78 | 5d | 1 | 0.06mi |
| 142 San Vicente Blvd Apt B Santa Monica, CA | 1.0 | 1.0 | 675 | $3,400 | $5.04 | 5d | 1 | 0.06mi |
| 130 San Vicente Blvd Santa Monica, CA | 1.0 | 1.0 | 635 | $3,900 | $6.14 | 24d | 1 | 0.07mi |
| 316 San Vicente Blvd Santa Monica, CA | 2.0 | 2.0 | 1100 | $4,795 | $4.36 | 24d | 1 | 0.12mi |
| 386 Entrada Dr Santa Monica, CA | 2.0 | 2.0 | 1008 | $7,000 | $6.94 | 43d | 1 | 0.19mi |
| 427 San Vicente Blvd Santa Monica, CA | 1.0 | 1.0 | 720 | $2,795 | $3.88 | 43d | 1 | 0.21mi |
| 217 Amalfi Dr Santa Monica, CA | 1.0 | 1.0 | 809 | $7,500 | $9.27 | 43d | 1 | 0.29mi |
| 540 San Vicente Blvd Unit 22 Santa Monica, CA | 1.0 | 1.0 | 650 | $2,950 | $4.54 | 43d | 1 | 0.33mi |
| 630 San Vicente Blvd Unit B Santa Monica, CA | 1.0 | 1.0 | 775 | $2,495 | $3.22 | 18d | 1 | 0.39mi |
| 630 San Vicente Blvd Unit A Santa Monica, CA | 2.0 | 2.0 | 975 | $3,495 | $3.58 | 3d | 1 | 0.39mi |
| 630 San Vicente Blvd Unit E Santa Monica, CA | 1.0 | 1.0 | 775 | $2,495 | $3.22 | 20d | 1 | 0.39mi |
| 125 Montana Ave #304 Santa Monica, CA | 1.0 | 1.0 | 972 | $4,500 | $4.63 | 11d | 1 | 0.48mi |
| 757 Ocean Ave Santa Monica, CA | 1.0 | 1.0 | 639 | $4,200 | $6.57 | 43d | 2 | 0.50mi |
| 801 2nd St Santa Monica, CA | 1.0–2.0 | 1.0–2.0 | 1008 | $3,645 | $3.62 | 3d | 3 | 0.53mi |
| 402 Montana Ave Apt 12 Santa Monica, CA | 2.0 | 1.0 | 1000 | $3,595 | $3.60 | 24d | 1 | 0.55mi |
| 402 Montana Ave Unit 4 Santa Monica, CA | 1.0 | 1.0 | 600 | $2,595 | $4.33 | 16d | 1 | 0.55mi |
| 818 5th St Santa Monica, CA | 2.0 | 2.0 | 1000 | $3,995 | $4.00 | 43d | 1 | 0.60mi |
| 858860 3rd St Santa Monica, CA | 1.0 | 1.0 | 550 | $3,595 | $6.54 | 4d | 1 | 0.61mi |
| 828 5th St #10 Santa Monica, CA | 1.0 | 1.0 | 619 | $3,200 | $5.17 | 43d | 1 | 0.61mi |
| 808 6th St Santa Monica, CA | 1.0 | 1.0 | 581 | $2,195 | $3.78 | 24d | 1 | 0.62mi |
| 608 Montana Ave Unit 4 Santa Monica, CA | — | 1.0 | 575 | $1,550 | $2.70 | 43d | 1 | 0.63mi |
| 833 5th St Unit 203 Santa Monica, CA | 2.0 | 2.0 | 1100 | $4,795 | $4.36 | 20d | 1 | 0.63mi |
| 833 5th St Unit 105 Santa Monica, CA | 1.0 | 1.0 | 1100 | $3,450 | $3.14 | 15d | 1 | 0.63mi |
| 811 6th St Santa Monica, CA | 1.0 | 1.0 | 950 | $4,295 | $4.52 | 43d | 1 | 0.64mi |
| 901 3rd St Santa Monica, CA | 2.0 | 2.0 | 1100 | $5,295 | $4.81 | 10d | 1 | 0.66mi |
| 627 9th St Unit D Santa Monica, CA | 1.0 | 1.0 | 600 | $2,800 | $4.67 | 6d | 1 | 0.70mi |
| 827 7th St Unit L Santa Monica, CA | 1.0 | 1.0 | 750 | $3,250 | $4.33 | 24d | 1 | 0.71mi |
| 928 4th St Unit 12 Santa Monica, CA | 2.0 | 2.0 | 825 | $3,095 | $3.75 | 14d | 1 | 0.71mi |
| 928 4th St Apt 3 Santa Monica, CA | 1.0 | 1.0 | 600 | $2,395 | $3.99 | 43d | 1 | 0.71mi |
| 928 4th St Apt 5 Santa Monica, CA | 2.0 | 2.0 | 750 | $3,095 | $4.13 | 43d | 1 | 0.71mi |
| 848 7th St Unit 4 Santa Monica, CA | 2.0 | 1.5 | 1000 | $2,995 | $3.00 | 14d | 1 | 0.71mi |
| 938 3rd St Santa Monica, CA | 1.0–2.0 | 1.0–2.0 | 900 | $2,675 | $2.97 | 11d | 3 | 0.72mi |
| 950 4th St Santa Monica, CA | 1.0–2.0 | 1.0–2.0 | 933 | $3,595 | $3.85 | 3d | 2 | 0.76mi |
| 927 6th St Unit 3 Santa Monica, CA | 1.0 | 1.0 | 745 | $2,650 | $3.56 | 20d | 1 | 0.78mi |
| 204 Washington Ave Santa Monica, CA | 2.0 | 2.0 | 1000 | $3,448 | $3.45 | 24d | 1 | 0.78mi |
| 204 Washington Ave #114 Santa Monica, CA | 1.0 | 1.0 | 725 | $3,590 | $4.95 | 20d | 1 | 0.78mi |
| 827 9th St Unit 7 Santa Monica, CA | 2.0 | 1.5 | 950 | $3,400 | $3.58 | 24d | 1 | 0.81mi |
| 914 Lincoln Blvd #207 Santa Monica, CA | 1.0 | 1.0 | 724 | $3,500 | $4.83 | 2d | 1 | 0.82mi |
| 942 7th St Santa Monica, CA | 1.0 | 1.0 | 862 | $3,595 | $4.17 | 16d | 1 | 0.82mi |
| 911 Lincoln Blvd Unit 10 Santa Monica, CA | 1.0 | 1.0 | 800 | $2,600 | $3.25 | 43d | 1 | 0.83mi |
HOA detail condo
- Monthly dues
- $2,237 · $26,844/yr
- Likely covers
- poolgymdoormansecurity
- Assessments
- None detected in remarks — confirm with the listing agent.
Listing history 27 events
-
2026-06-01days on market $799,999 Active 145 DOM
-
2026-05-31days on market $799,999 Active 144 DOM
-
2026-02-16price $799,999 1158-char remark
Show marketing remark (1158 chars)
Welcome to Santa Monica's premier oceanfront residence, perfectly positioned adjacent to the iconic Santa Monica Beach and Palisades Park. This beautifully updated, quiet, back-facing unit showcases breathtaking views of the Santa Monica Mountains. Blending resort-style amenities with sophisticated urban living, this home offers a truly elevated lifestyle experience. Enjoy serene mountain vistas from your private 11th-floor retreat. Exclusive building amenities include a state-of-the-art fitness center with sauna, pool and spa, 24-hour concierge and security, valet parking, and optional maid service all designed for comfort and convenience. Ideally located near Santa Monica's finest dining, shopping, and entertainment along Montana Avenue, Third Street Promenade, and Ocean Avenue, you'll find everything you need just moments away. Inside, discover a spacious open-concept floor plan perfect for entertaining, featuring wood flooring, a private balcony, and a modern kitchen with stainless steel appliances and custom cabinetry. Experience the quintessential Santa Monica lifestyle at Ocean Towers a residence that defines luxury coastal living.
-
2026-01-06$810,000 Active 1158-char remark
Show marketing remark (1158 chars)
Welcome to Santa Monica's premier oceanfront residence, perfectly positioned adjacent to the iconic Santa Monica Beach and Palisades Park. This beautifully updated, quiet, back-facing unit showcases breathtaking views of the Santa Monica Mountains. Blending resort-style amenities with sophisticated urban living, this home offers a truly elevated lifestyle experience. Enjoy serene mountain vistas from your private 11th-floor retreat. Exclusive building amenities include a state-of-the-art fitness center with sauna, pool and spa, 24-hour concierge and security, valet parking, and optional maid service all designed for comfort and convenience. Ideally located near Santa Monica's finest dining, shopping, and entertainment along Montana Avenue, Third Street Promenade, and Ocean Avenue, you'll find everything you need just moments away. Inside, discover a spacious open-concept floor plan perfect for entertaining, featuring wood flooring, a private balcony, and a modern kitchen with stainless steel appliances and custom cabinetry. Experience the quintessential Santa Monica lifestyle at Ocean Towers a residence that defines luxury coastal living.
-
2025-10-08Active
-
2025-06-05Active
-
2025-02-27price
-
2024-10-23price
-
2024-09-17Active
-
2024-07-31price
-
2024-07-01price
-
2024-05-30price
-
2024-04-21Active
-
2019-03-26historical Canceled
-
2019-03-11Active
-
2017-09-27historical Expired
-
2016-12-29Active
-
2016-12-12historical Cancelled
-
2016-11-28price
-
2016-11-17Active
-
2009-04-15historical
-
2009-01-17
-
2005-03-07soldstatus $380,000
-
2005-01-21historical
-
2005-01-18$350,000
-
2002-09-09historical
-
2002-09-01
ⓘ Source: listings_history table (triggers on properties + properties_extension) + one-shot
backfill from property_details.listing_events for pre-trigger history.
Tax reassessment forecast CA · Resets to sale price
- Current annual tax
- $10,246 · $854/mo
- Projected year-2 tax
- $10,246 · $854/mo
- Expected delta
- $0/yr ($0/mo · 0.0%)
ⓘ Screening estimate from a state-policy table — verify with the county assessor before closing.
Climate risk First Street
- Flood 1/10 Low FEMA zone X (unshaded) · 0% chance over 30 yrs
- Wildfire 1/10 Low
- Heat 6/10 Major 7 d/yr ≥83°F today · 20 d/yr by 30 yrs out
- Wind 1/10 Low
- Air quality 4/10 Moderate 5 unhealthy d/yr today · 6 by 30 yrs out
Nearby sold comps map
Loading sold comps map…
Walkable amenities ~0.75 mi
Loading nearby amenities…
Taxation est. · year 1
- Rental income
- $51,548
- − Mortgage interest
- −$44,812
- − Property taxes
- −$10,246
- − Insurance
- −$4,000
- − Repairs & maintenance
- −$4,124
- − Management
- −$4,124
- − HOA
- −$26,844
- − Depreciation
- −$23,273
- Taxable loss
- −$65,875
- Est. tax savings @ 24.0%
- +$15,810
- After-tax cash flow
- $-34,900/yr
For passive investors: Depreciation is non-cash, so a rental often shows a tax loss while cash-flowing — sheltering income. Rental losses are passive: they offset passive income freely, and up to $25,000/yr can offset ordinary (W-2) income if you actively participate and your MAGI is under $100k (phasing out to $0 by $150k); unused losses carry forward. On sale, claimed depreciation is recaptured at up to 25%, and gains may owe capital-gains tax (a 1031 exchange can defer both). Figures are a year-1 estimate at your 24.0% rate — not tax advice; consult a CPA.
Schools (NCES district)
- District
- Santa Monica-Malibu Unified
- NCES district ID
- 0635700
- Math proficiency
- 61% ▬ 0.00%
- Reading proficiency
- 74% ▬ 0.00%
- Median HH income
- $81,489
- Composite
- 61.58/100
- National rank
- #1535
- State rank
- #123 of 1400 in CA
Livability — Santa Monica
- Score
- 72/100
- State rank
- #178
- US rank
- #5878
Category grades
Schools grade is shown separately in the Schools card above.
Census & demographics
- Census place
- Santa Monica, CA
- County
- Los Angeles County · 9,444,647 people
- City population
- 93,581
- Metro
- Los Angeles-Long Beach-Anaheim, CA
- Population (ZIP)
- 11,337
- Household income
- $159,100
- Rent vs Own
- Severe rent burden
- 265.0
Population outlook (Los Angeles County) Hauer SSP2
- Today (2025)
- 10,940,515 people
- By 2030
- 11,256,481 · +2.9%
- By 2040
- 11,729,929 · +7.2%
- By 2050
- 11,948,407 · +9.2%
- By 2075
- 11,818,114 · +8.0%
- By 2100
- 10,842,928 · -0.9%
Race, ethnicity, and origin ACS 2023
- Neighborhood character
- Predominantly White (73%)
- Race & ethnicity
- White 73% Two or more races 10% Hispanic / Latino 10% Asian 9%
- Hispanic origin (detail)
- Mexican 4%
- Common ancestry
- Italian 6% Scotch-Irish 6% Slovak 3%
- Foreign-born
- 15% · China, Canada, South Korea
- Languages at home
- 82% English-only · Other Indo-European 4% Spanish 4% Chinese 4%
Political lean MEDSL · Los Angeles
- 2024 margin
- Solid D (+32.9) · D 64.8% · R 31.9% · Other 3.3%
- 2008→2024 swing
- -7.4pp toward R · 2008: 40.4pp · 2024: 32.9pp
- All cycles
- 2024: D+32.9 2020: D+44.2 2016: D+48.0 2012: D+40.0 2008: D+40.4
Not yet ingested
- Civics
- —
Market trends
- HPI YoY
- ▲ 15.74%
- Current HPI
- 540.458
- Rent YoY
- ▲ 2.03%
- Metro
- Los Angeles-Long Beach-Anaheim, CA
- State GDP YoY
- ▲ 3.21%
- F500 in state
- 116
Industry mix (Fortune 500 HQ in CA)
| Industry | F500 HQs | Revenue |
|---|---|---|
| Technology | 27 | $1,492B |
|
||
| Financial Services | 3 | $174B |
|
||
| Retail | 3 | $44B |
|
||
| Insurance | 3 | $26B |
|
||
| Media / Entertainment | 2 | $115B |
|
||
| Pharmaceuticals / Biotech | 2 | $62B |
|
||
Price history
+128.6% since first listed25 events — show timeline
- 2026-02-16 Price Changed $799,999 TheMLS
- 2026-01-06 Listed $810,000 TheMLS
- 2025-10-08 Listed — TheMLS
- 2025-06-05 Listed — TheMLS
- 2025-02-27 Price Changed — TheMLS
- 2024-10-23 Price Changed — TheMLS
- 2024-09-17 Listed — TheMLS
- 2024-07-31 Price Changed — TheMLS
- 2024-07-01 Price Changed — TheMLS
- 2024-05-30 Price Changed — TheMLS
- 2024-04-21 Listed — TheMLS
- 2019-03-26 Delisted — TheMLS
- 2019-03-11 Listed — TheMLS
- 2017-09-27 Delisted — TheMLS
- 2016-12-29 Listed — TheMLS
- 2016-12-12 Delisted — TheMLS
- 2016-11-28 Price Changed — TheMLS
- 2016-11-17 Listed — TheMLS
- 2009-04-15 Delisted — TheMLS
- 2009-01-17 Listed — TheMLS
- 2005-03-07 Sold (MLS) $380,000 TheMLS
- 2005-01-21 Delisted — TheMLS
- 2005-01-18 Listed $350,000 TheMLS
- 2002-09-09 Delisted — TheMLS
- 2002-09-01 Listed — TheMLS
Property tax history
+4.5%/yrLatest (2025): $10,246 · +6.5% YoY. Source: county tax records.
Cash-flow waterfall
monthlySold comps — $/sqft
last 12 mo · ≤1 miLoading sold comps…