 Fourplex
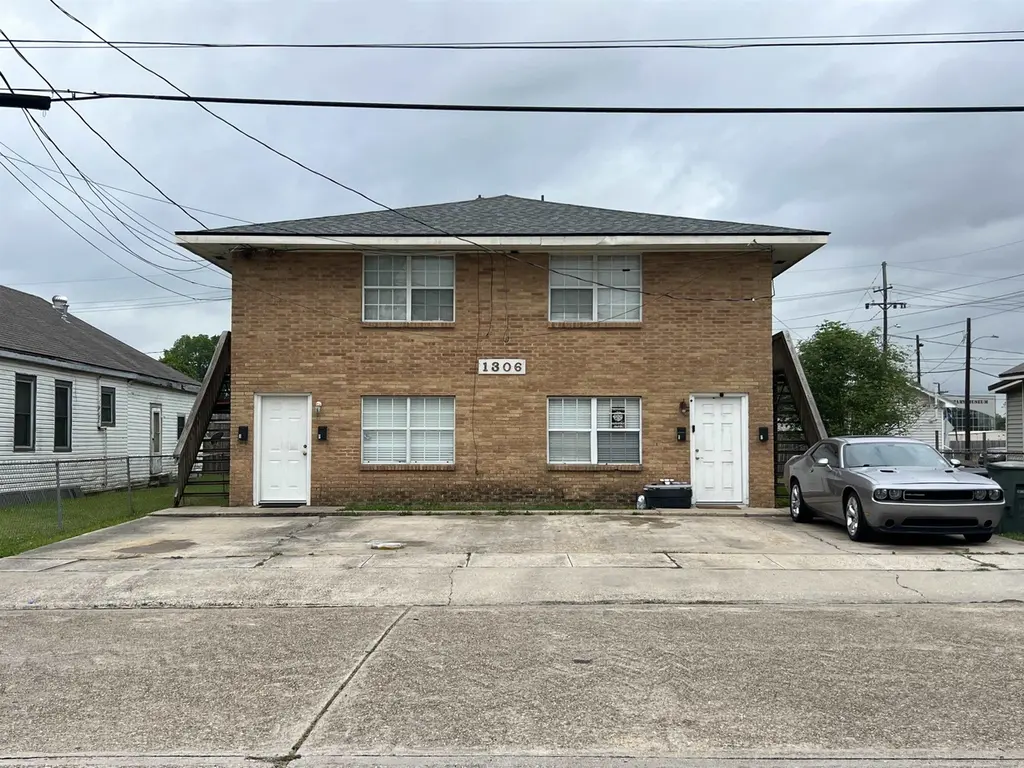
1306 Lee Ave · Houma, LA
Flood risk 9/10 · Severe
- FEMA flood zone
- AE
- Chance of flooding over 30 yrs
- 0.99%
- Est. flood insurance / yr
- $1,737 – $8,500
Fire risk 1/10 · Minimal
- Est. fire insurance / yr
- $1,269 – $2,357
Heat risk 9/10 · Severe
- Hot days now (above 107°F)
- 7 days/yr
- Hot days in 30 yrs
- 22 days/yr
Wind risk 9/10 · Severe
- Chance of severe wind over 30 yrs
- 99.0%
Air-quality risk 1/10 · Minimal
- Unhealthy air days now
- 0 days/yr
- Unhealthy air days in 30 yrs
- 0 days/yr
Risk factors via First Street. Map © Google.
Why this score? — see what drove the B- grade
The composite is a weighted blend of 9 inputs, each scored 0–100. Each bar is that input's sub-score; the figure is the points it added to the 100-point composite (weight × sub-score).
- Cash flow +30.0/30.0
- 1% rule +10.0/10.0
- DSCR +10.0/10.0
- ARV discount +4.0/15.0
- Schools +3.3/10.0
- Rent growth +3.2/5.0
- Livability +3.2/5.0
- Condition / age +2.5/5.0
- Appreciation +0.0/10.0
$220,000
🖨 Deal sheet (PDF) 📄 Offer letter ✓ Due diligence
Multi-family units
County records classify this as Multi-Family (5+ Unit). Listing-text estimate: 4 units. estimate disagrees with records
5+ unit building — per-unit beds/baths from public records are typically unavailable; the breakdown below (if shown) is an estimate from the listing text.
Listing remarks MLS
LISTED WELL BELOW APPRAISAL, this Fourplex presents a prime investment opportunity! Each unit is a 1-bedroom, 1-bath and is currently tenant-occupied, creating immediate cash flow from day one, producing $600 per month per unit with potential for rental increases. Constructed with durable brick exterior and featuring metal stair access to the upper units, the property is designed for low maintenance ownership. Conveniently located near local amenities, this fourplex is also available as part of a package opportunity with additional income-producing properties under the same ownership. Details available upon request.
Key facts
- 4,356 sq ft lot
- Garage
- Listed 67 days
Neighborhood map
What this means for you Summary
Snapshot
- This is a 4 × 1-bed/1-bath units multifamily listed at $220k.
Deal economics
- At list price, monthly cash flow is $1k ($16k/yr) — positive. Per door: $332/mo.
- The deal already cash-flows at list — no discount required.
- Meets the 1% rule at list price ($4k rent vs $220k).
- Recommended offer: $207k (6.0% below list) — sets the bar for market timing.
- Cap rate 15.9% vs local median 4.0% in Houma — top-decile yield for the area; either an underpriced asset or a hidden risk that comps aren't pricing in. Stress-test before assuming the spread holds.
Location & tenants
- Location reads 64/100 on livability (#165 in LA) — a middle-class / working-renter tenant base. Strengths: cost of living A+, housing A; Watch: employment D, crime D-, amenities F.
- Terrebonne Parish (other): math 32% / reading 46% proficiency, ranked #23 of 98 in LA (top 24%) — families likely to look elsewhere, expect single-tenant / working-renter base with shorter leases; 62% free/reduced lunch — lower-income household profile, screen leases tightly.
- Zoned schools: Southdown Elementary School (math 20% / reading 36%, grade F, #355 of 646 statewide, top 55%, 504 students, 76% FRL); Houma Junior High School (math 23% / reading 49%, grade F, #84 of 218 statewide, top 41%, 729 students, 56% FRL); Terrebonne High School (math 38% / reading 41%, grade F, #80 of 265 statewide, top 32%, 1,386 students, 49% FRL) — zoned schools at 61% FRL track the district average.
- Market conditions: Rents rising (+2.8%/yr); 357 active listings in the ZIP; solid renter incomes; 300 units permitted in Terrebonne Parish in 2024 (0 in 5+ unit buildings).
- At $3,862/mo this rent would consume 55% of the median local household income ($85k/yr) (locally 811% of renters already pay >50% of income on rent) — very limited rent-growth headroom before tenants either downsize or default.
Forward outlook
- Local home prices are declining (-3.0%/yr); year-one equity from $2k of loan paydown is wiped out by about $7k of value loss. Plan a longer hold.
- At projected returns (-3.0% appreciation + 2.8% rent growth), your $62k cash investment doubles in ~5 years — after that, you're playing with house money.
Negotiation context
- It's been on market 67 days — a 6% lower offer ($207k) is reasonable based on typical stale-listing flexibility.
- 5 sale attempts since 2y ago with the ask held roughly flat each time — persistent listings suggest the price (not the market) is what's stuck; bring a comps-based counter.
- Current owner paid $30k; list at $220k implies a 633% gain — meaningful room to come down on a strong offer.
Risks & watch-outs
- Watch-outs: flood insurance adds $427/mo.
- Climate carrying-cost: in FEMA flood zone AE (mandatory federal flood insurance); severe wind risk, 99% chance of damaging wind over 30y; extreme-heat days projected 7→22/yr by 2055 (HVAC capex compounding) — expect insurance premiums to compound above CPI over the hold.
Questions for the listing agent
- It's been on market 67 days. Have you received any prior offers? Is the seller open to a 6% concession, seller financing, or rate buy-down credit?
- Can we see the unit-by-unit rent roll, current vacancy, and any below-market leases? What's the average tenancy length?
- What capital expenditures (roof, boiler, parking lot, exteriors) have been made in the last 5 years, and what's planned in the next 2?
- What's the actual annual flood-insurance premium (NFIP or private), and is the property in a SFHA with mandatory coverage?
- Why hasn't it sold? Are there any deal-killer items the seller is aware of (foundation, flood, title, zoning, code violations)?
- Is there a deadline driving the sale (1031 exchange, divorce, estate, relocation)? That informs how much negotiation room exists.
- Schools are B-rated — typically a magnet for longer-tenancy family renters. What's the average tenant stay here, and is there a school-zone premium baked into asking?
- Crime grade is D in this area — have there been break-ins, vandalism, or insurance claims at this property in the last 3 years? What carrier currently insures it and at what premium?
- What's the average days-on-market for RENTAL listings here right now (not sales)? A rising rental-DOM trend means longer vacancies and softer asking-rent achievability than the comps imply.
- What's the recent tenant-quality profile in this submarket — average credit score on applications, eviction rate, late-payment / NSF rate, and stable-employment percentage? A property-management company in the area should have these aggregated.
- How much new apartment / multifamily construction is in the pipeline within 1–3 miles? Heavy new supply (>2% of stock underway) typically softens rents 12–24 months out; light construction supports rent growth.
Investment metrics
- 1% rule
- 1.76% ✓
- Cap rate
- 15.87%
- Cash-on-cash
- 34.19%
- DSCR
- 2.52
- GRM
- 4.7
CMA / ARV
- ARV (median comp)
- $204,166
- List price
- $220,000
- Delta
- 7.76%
- Verdict
- FAIR
- Comps
- 6 within 1.0 mi
Projected returns pro-forma
-3.0% appreciation · 2.82% rent growth · sell at horizon
- IRR
- 19.4%
- Equity multiple
- 1.79×
- Total profit
- $48,464
- Equity at exit
- $32,803
- IRR
- 27.6%
- Equity multiple
- 3.42×
- Total profit
- $149,061
- Equity at exit
- $19,022
Cash invested: $61,600 (down + closing). Projections, not guarantees.
Landlord ↔ Tenant lean methodology
- Overall (STATE)
- 90 Strongly Landlord-Friendly
- State Louisiana
- 90 Strongly Landlord-Friendly · R+12
- County
- — inherits STATE
- City
- — inherits STATE
ZIP-level market 70360
- Rents YoY
- 2.8%
- Active inventory
- 357
- Price-to-rent
- 19.0×
Monthly cashflow live
- Estimated rent
- $3,862 medium interval (Pro) →
- Mortgage (P&I)
- −$1,154
- Tax from tax record
- −$50 /mo · $604/yr
- Insurance
- −$92
- Flood insurance flood zone
- −$427 /mo · $5,118/yr
- HOA
- −$0
- Vacancy / Maint / Mgmt
- −$811
- Net cashflow
- $1,329
Break-even live
Sensitivity live
| Price | -10% $1,453 | -5% $1,391 | +0% $1,329 | +5% $1,266 | +10% $1,204 |
|---|---|---|---|---|---|
| Rent | -10% $1,024 | -5% $1,176 | +0% $1,329 | +5% $1,481 | +10% $1,634 |
| Rate | -1.0pp $1,440 | -0.5pp $1,385 | base $1,329 | +0.5pp $1,272 | +1.0pp $1,214 |
4-unit breakdown (identical units grouped — click to expand)
| Units | Beds | Baths | Est. rent |
|---|---|---|---|
| 4× units | 1 | 1 | $3,860 |
| #1 | 1 | 1 | $965 |
| #2 | 1 | 1 | $965 |
| #3 | 1 | 1 | $965 |
| #4 | 1 | 1 | $965 |
| Total (4 units) | $3,862 | ||
UW: 25.0% down · 7.5% · 30yr · 1.5% tax · 5.0% vac · 8.0% maint · 8.0% mgmt
Financing live
Cash to close
- Down payment
- $55,000
- Closing costs
- $6,600
- Reserves months
- —
- Total cash needed
- —
Loan-product check · same deal, 3 products live
Conventional
25% down · 7.5% · 30yr
- Down + closing
- —
- Monthly P&I
- —
- Monthly cashflow
- —
- DSCR
- —
- Eligible?
- —
Personal DTI + credit; lowest rate.
DSCR
20% down · 8.5% · 30yr
- Down + closing
- —
- Monthly P&I
- —
- Monthly cashflow
- —
- DSCR
- —
- Eligible?
- —
No personal income docs; deal must DSCR.
Hard money
10% down · 12.0% · 12mo
- Down + closing
- —
- Monthly P&I
- —
- Monthly cashflow
- —
- DSCR
- —
- Eligible?
- —
Short-term bridge; refi at stabilization.
Listing history 27 events
-
2026-06-21days on market $220,000 Active 67 DOM
-
2026-06-19days on market $220,000 Active 65 DOM
-
2026-06-18days on market $220,000 Active 64 DOM
-
2026-06-17days on market $220,000 Active 63 DOM
-
2026-06-16days on market $220,000 Active 62 DOM
-
2026-06-15days on market $220,000 Active 61 DOM
-
2026-06-14days on market $220,000 Active 59 DOM
-
2026-06-13days on market $220,000 Active 58 DOM
-
2026-06-10days on market $220,000 Active 56 DOM
-
2026-06-09days on market $220,000 Active 55 DOM
-
2026-06-08days on market $220,000 Active 54 DOM
-
2026-06-07days on market $220,000 Active 53 DOM
-
2026-06-05days on market $220,000 Active 50 DOM
-
2026-06-03days on market $220,000 Active 49 DOM
-
2026-06-02days on market $220,000 Active 48 DOM
-
2026-06-01days on market $220,000 Active 47 DOM
-
2026-05-31days on market $220,000 Active 46 DOM
-
2026-05-30days on market $220,000 Active 45 DOM
-
2026-04-15$220,000 Active 623-char remark
Show marketing remark (623 chars)
LISTED WELL BELOW APPRAISAL, this Fourplex presents a prime investment opportunity! Each unit is a 1-bedroom, 1-bath and is currently tenant-occupied, creating immediate cash flow from day one, producing $600 per month per unit with potential for rental increases. Constructed with durable brick exterior and featuring metal stair access to the upper units, the property is designed for low maintenance ownership. Conveniently located near local amenities, this fourplex is also available as part of a package opportunity with additional income-producing properties under the same ownership. Details available upon request.
-
2024-12-11$240,000 Active
-
2024-12-11historical
-
2024-08-21price $240,000
-
2024-06-14price $250,000
-
2024-05-17$260,000 Active
-
2024-05-17$240,000 Active
-
1987-09-10soldstatus $30,000
ⓘ Source: listings_history table (triggers on properties + properties_extension) + one-shot
backfill from property_details.listing_events for pre-trigger history.
Tax reassessment forecast LA · Resets to sale price
- Current annual tax
- $604 · $50/mo
- Projected year-2 tax
- $1,210 · $101/mo
- Expected delta
- +$606/yr (+$51/mo · 100.4%)
ⓘ Screening estimate from a state-policy table — verify with the county assessor before closing.
Climate risk First Street
- Flood 9/10 Extreme FEMA zone AE · 99% chance over 30 yrs
- Wildfire 1/10 Low
- Heat 9/10 Extreme 7 d/yr ≥107°F today · 22 d/yr by 30 yrs out
- Wind 9/10 Extreme 99% chance of damaging wind over 30 yrs
- Air quality 1/10 Low 0 unhealthy d/yr today · 0 by 30 yrs out
Nearby sold comps map
Loading sold comps map…
Walkable amenities ~0.75 mi
Loading nearby amenities…
Taxation est. · year 1
- Rental income
- $46,344
- − Mortgage interest
- −$12,323
- − Property taxes
- −$604
- − Insurance
- −$6,218
- − Repairs & maintenance
- −$3,708
- − Management
- −$3,708
- − Depreciation
- −$6,400
- Taxable income
- $13,383
- Est. tax owed @ 24.0%
- −$3,212
- After-tax cash flow
- $12,733/yr
For passive investors: Depreciation is non-cash, so a rental often shows a tax loss while cash-flowing — sheltering income. Rental losses are passive: they offset passive income freely, and up to $25,000/yr can offset ordinary (W-2) income if you actively participate and your MAGI is under $100k (phasing out to $0 by $150k); unused losses carry forward. On sale, claimed depreciation is recaptured at up to 25%, and gains may owe capital-gains tax (a 1031 exchange can defer both). Figures are a year-1 estimate at your 24.0% rate — not tax advice; consult a CPA.
Schools (NCES district)
- District
- Terrebonne Parish
- NCES district ID
- 2201740
- Math proficiency
- 32% ▼ -36.00%
- Reading proficiency
- 46% ▼ -30.00%
- Median HH income
- $47,612
- Composite
- 33.38/100
- National rank
- #5480
- State rank
- #23 of 98 in LA
Livability — Houma
- Score
- 64/100
- State rank
- #165
- US rank
- #13966
Category grades
Schools grade is shown separately in the Schools card above.
Census & demographics
- Census place
- Houma, LA
- County
- Terrebonne Parish · 57,290 people
- City population
- 57,290
- Metro
- Houma-Thibodaux, LA
- Population (ZIP)
- 28,574
- Household income
- $84,890
- Rent vs Own
- Severe rent burden
- 811.0
Population outlook (Terrebonne County) Hauer SSP2
- Today (2025)
- 118,724 people
- By 2030
- 120,321 · +1.3%
- By 2040
- 121,894 · +2.7%
- By 2050
- 121,119 · +2.0%
- By 2075
- 117,270 · -1.2%
- By 2100
- 107,544 · -9.4%
Race, ethnicity, and origin ACS 2023
- Neighborhood character
- Predominantly White (70%)
- Race & ethnicity
- White 70% Black 18% Two or more races 6% Hispanic / Latino 6% Native American 3% Asian 2%
- Hispanic origin (detail)
- Mexican 2%
- Common ancestry
- Lithuanian 24% Armenian 1%
- Foreign-born
- 3% · Canada
- Languages at home
- 93% English-only · Spanish 3% French/Haitian/Cajun 2% Other Indo-European 1%
Political lean MEDSL · Terrebonne
- 2024 margin
- Solid R (+51.8) · D 23.5% · R 75.3% · Other 1.2%
- 2008→2024 swing
- -11.0pp toward R · 2008: -40.9pp · 2024: -51.8pp
- All cycles
- 2024: R+51.8 2020: R+50.0 2016: R+48.4 2012: R+41.2 2008: R+40.9
Not yet ingested
- Civics
- —
Market trends
- HPI YoY
- ▼ -149.43%
- Current HPI
- 138.5984
- Rent YoY
- ▲ 2.82%
- Metro
- Houma-Thibodaux, LA
- State GDP YoY
- ▲ 3.29%
- F500 in state
- 10
Industry mix (Fortune 500 HQ in LA)
| Industry | F500 HQs | Revenue |
|---|---|---|
| Telecommunications | 2 | $23B |
|
||
| Utilities | 1 | $12B |
|
||
| Wholesale / Distribution | 1 | $5B |
|
||
| Advertising | 1 | $2B |
|
||
Price history
+633.3% since first listed9 events — show timeline
- 2026-04-15 Listed $220,000 GBRMLS
- 2026-04-15 Listed $220,000 AcadianaMLS
- 2024-12-11 Listed $240,000 GBRMLS
- 2024-12-11 Delisted — GBRMLS
- 2024-08-21 Price Changed $240,000 GBRMLS
- 2024-06-14 Price Changed $250,000 GBRMLS
- 2024-05-17 Listed $240,000 AcadianaMLS
- 2024-05-17 Listed $260,000 GBRMLS
- 1987-09-10 Sold (Public Records) $30,000 Public Records
Property tax history
+0.3%/yrLatest (2025): $604 · -2.3% YoY. Source: county tax records.
Cash-flow waterfall
monthlySold comps — $/sqft
last 12 mo · ≤1 miLoading sold comps…