1502 Spring Garden St · Wilson, PA
Flood risk 1/10 · Minimal
- FEMA flood zone
- X (unshaded)
- Chance of flooding over 30 yrs
- 0.0%
- Est. flood insurance / yr
- $473 – $860
Fire risk 1/10 · Minimal
- Est. fire insurance / yr
- $511 – $949
Heat risk 5/10 · Moderate
- Hot days now (above 100°F)
- 7 days/yr
- Hot days in 30 yrs
- 15 days/yr
Wind risk 4/10 · Minor
- Chance of severe wind over 30 yrs
- 16.0%
Air-quality risk 3/10 · Minor
- Unhealthy air days now
- 3 days/yr
- Unhealthy air days in 30 yrs
- 5 days/yr
Risk factors via First Street. Map © Google.
Why this score? — see what drove the C grade
The composite is a weighted blend of 9 inputs, each scored 0–100. Each bar is that input's sub-score; the figure is the points it added to the 100-point composite (weight × sub-score).
- Cash flow +17.7/30.0
- ARV discount +14.6/15.0
- DSCR +5.5/10.0
- 1% rule +5.1/10.0
- Livability +4.4/5.0
- Rent growth +3.7/5.0
- Schools +3.5/10.0
- Condition / age +2.5/5.0
- Appreciation +0.0/10.0
$189,900
🖨 Deal sheet (PDF) 📄 Offer letter ✓ Due diligence
Listing remarks MLS
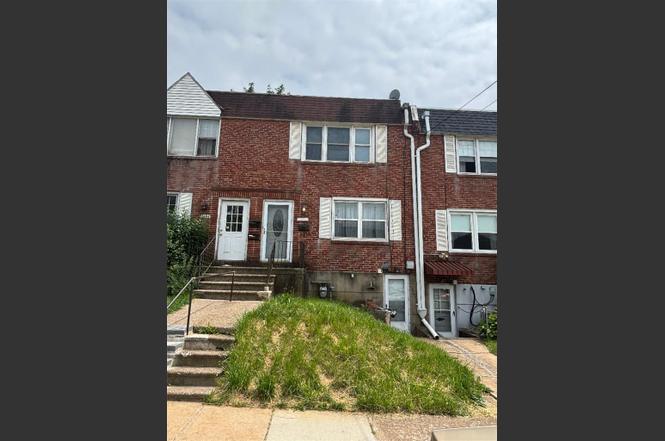
Very nice home in Wilson Borough. Modern large kitchen. Fenced in back yard. New furnace, roof, and electrical system. Close to major routes. Convenient to parks.
Key facts
- Walk out access
- Lower level
- Recent roof
Tags
Property features AI
Exterior
- Parking: On-street parking
- Utilities: Public water; Public sewer; 200+ amp electrical service with circuit breakers
- Home design: Two-story brick home; Entry to lower-level walk-out
- Construction: Brick exterior; Block foundation; Year built: Unknown
- Exterior features: Patio; Lot approximately 76' x 19' (public records); Zoned residential
Interior
- Kitchen: Kitchen/dining room with tile flooring, island, and access to rear patio/yard; Gas oven; Gas range
- Bedrooms: Two bedrooms on the second floor; Additional versatile room in lower level
- Flooring: Carpet; Tile; Vinyl
- Bathrooms: Two full bathrooms (one on the first level, one on the second level)
- Heating & cooling: Forced air gas heating; Wall/window cooling units
- Interior features: Replacement windows; Eat-in kitchen; Kitchen island; Family room on lower level; Partially finished versatile lower-level area with walk-out access
- Laundry & utility: Washer hookup on lower level; Dryer hookup on lower level; Gas water heater
Neighborhood map
What this means for you Summary
Snapshot
- This is a 3-bed/2.0-bath townhouse listed at $190k.
Deal economics
- At list price, monthly cash flow is $153 ($2k/yr) — positive.
- The deal already cash-flows at list — no discount required.
- Meets the 1% rule at list price ($2k rent vs $190k).
- Cap rate 7.3% vs local median 5.1% in Wilson — top-decile yield for the area; either an underpriced asset or a hidden risk that comps aren't pricing in. Stress-test before assuming the spread holds.
Location & tenants
- Location reads 88/100 on livability (#32 in PA, #171 nationally) — a professional / high-income tenant draw. Strengths: schools A+, amenities A+, cost of living A+; Watch: commute F.
- Wilson Area SD (suburban): math 28% / reading 52% proficiency, ranked #338 of 539 in PA (top 63%) — families likely to look elsewhere, expect single-tenant / working-renter base with shorter leases.
- Market conditions: Rents rising fast (+4.9%/yr); 185 active listings in the ZIP; 40 comparable units currently listed for rent nearby; rentals at typical pace (median 24d on market — plan ~3-4 weeks tenant-placement turnaround); solid renter incomes; 567 units permitted in Northampton County in 2024 (151 in 5+ unit buildings).
Forward outlook
- Local home prices are declining (-3.0%/yr); year-one equity from $1k of loan paydown is wiped out by about $6k of value loss. Plan a longer hold.
Negotiation context
- Only 6 days on market — expect competitive offers; lowballing is unlikely to land.
- 2 sale attempts since 21y ago with the ask held roughly flat each time — persistent listings suggest the price (not the market) is what's stuck; bring a comps-based counter.
- Current owner paid $90k; list at $190k implies a 111% gain — meaningful room to come down on a strong offer.
Risks & watch-outs
- Watch-outs: built in 1955 — expect roof / HVAC / electrical / plumbing capex.
- Climate carrying-cost: extreme-heat days projected 7→15/yr by 2055 (HVAC capex compounding) — expect insurance premiums to compound above CPI over the hold.
Questions for the listing agent
- Built in 1955 — when were the roof, HVAC, electrical panel, plumbing, and water heater last replaced?
- Is there a deadline driving the sale (1031 exchange, divorce, estate, relocation)? That informs how much negotiation room exists.
- Schools are A-rated — typically a magnet for longer-tenancy family renters. What's the average tenant stay here, and is there a school-zone premium baked into asking?
- What's the average days-on-market for RENTAL listings here right now (not sales)? A rising rental-DOM trend means longer vacancies and softer asking-rent achievability than the comps imply.
- What's the recent tenant-quality profile in this submarket — average credit score on applications, eviction rate, late-payment / NSF rate, and stable-employment percentage? A property-management company in the area should have these aggregated.
- How much new for-sale + rental construction is in the pipeline within 1–3 miles? Heavy new supply typically softens prices + rents 12–24 months out; constrained supply supports both.
Investment metrics
- 1% rule
- 1.01% ✓
- Cap rate
- 7.26%
- Cash-on-cash
- 3.46%
- DSCR
- 1.15
- GRM
- 8.2
CMA / ARV
- ARV (on-the-fly)
- $225,504
- Comps found
- 12
Show comp detail 12 sales within ~0.75 mi
| Address | Dist | Beds/Ba | Sqft | Sold | Price | $/sf | Match |
|---|---|---|---|---|---|---|---|
| 31 S 14th St | 0.21mi | 3/1.0 | 1,300 (+0%) | 1mo | $215,000 | $165 | 85 |
| 1919 Ferry St | 0.43mi | 3/1.5 | 1,284 (-1%) | 0mo | $250,000 | $195 | 76 |
| 1108 Lehigh St | 0.53mi | 3/1.0 | 1,236 (-5%) | 2mo | $218,000 | $176 | 62 |
| 1516 Lehigh St | 0.35mi | 3/1.5 | 1,120 (-14%) | 1mo | $195,000 | $174 | 58 |
| 917 Spruce St | 0.63mi | 3/1.0 | 1,344 (+4%) | 3mo | $220,000 | $164 | 58 |
| 1143 Lehigh St | 0.48mi | 3/1.5 | 1,430 (+10%) | 2mo | $197,000 | $138 | 57 |
| 1534 Lehigh St | 0.34mi | 3/1.0 | 1,120 (-14%) | 1mo | $195,000 | $174 | 56 |
| 832 Bushkill St | 0.62mi | 2/1.0 (-1) | 1,254 (-3%) | 1mo | $200,000 | $159 | 56 |
| 1914 Fairview Ave | 0.47mi | 3/1.0 | 1,440 (+11%) | 4mo | $275,000 | $191 | 52 |
| 1025 Spruce St | 0.55mi | 2/1.0 (-1) | 1,161 (-10%) | 3mo | $190,000 | $164 | 45 |
| 2028 Washington Blvd | 0.66mi | 3/1.5 | 1,120 (-14%) | 0mo | $270,000 | $241 | 44 |
| 934 Butler St | 0.71mi | 2/1.0 (-1) | 1,456 (+12%) | 2mo | $186,000 | $128 | 35 |
Match score weights: distance 35% · size 25% · config 20% · recency 20%. Top-matched comps best support the ARV.
Projected returns pro-forma
-3.0% appreciation · 4.94% rent growth · sell at horizon
- IRR
- -8.6%
- Equity multiple
- 0.68×
- Total profit
- $-17,140
- Equity at exit
- $28,315
- IRR
- 3.4%
- Equity multiple
- 1.27×
- Total profit
- $14,182
- Equity at exit
- $16,419
Cash invested: $53,172 (down + closing). Projections, not guarantees.
Landlord ↔ Tenant lean methodology
- Overall (STATE)
- 62 Landlord-Friendly
- State Pennsylvania
- 62 Landlord-Friendly · EVEN
- County
- — inherits STATE
- City
- — inherits STATE
ZIP-level market 18042
- Rents YoY
- 4.9%
- Active inventory
- 185
- Price-to-rent
- 8.2×
Monthly cashflow live
- Estimated rent
- $1,919 high interval (Pro) →
- Mortgage (P&I)
- −$996
- Tax from tax record
- −$288 /mo · $3,456/yr
- Insurance
- −$79
- HOA
- −$0
- Vacancy / Maint / Mgmt
- −$403
- Net cashflow
- $153
Break-even live
Sensitivity live
| Price | -10% $261 | -5% $207 | +0% $153 | +5% $99 | +10% $46 |
|---|---|---|---|---|---|
| Rent | -10% $2 | -5% $77 | +0% $153 | +5% $229 | +10% $305 |
| Rate | -1.0pp $249 | -0.5pp $201 | base $153 | +0.5pp $104 | +1.0pp $54 |
UW: 25.0% down · 7.5% · 30yr · 1.5% tax · 5.0% vac · 8.0% maint · 8.0% mgmt
Financing live
Cash to close
- Down payment
- $47,475
- Closing costs
- $5,697
- Reserves months
- —
- Total cash needed
- —
Loan-product check · same deal, 3 products live
Conventional
25% down · 7.5% · 30yr
- Down + closing
- —
- Monthly P&I
- —
- Monthly cashflow
- —
- DSCR
- —
- Eligible?
- —
Personal DTI + credit; lowest rate.
DSCR
20% down · 8.5% · 30yr
- Down + closing
- —
- Monthly P&I
- —
- Monthly cashflow
- —
- DSCR
- —
- Eligible?
- —
No personal income docs; deal must DSCR.
Hard money
10% down · 12.0% · 12mo
- Down + closing
- —
- Monthly P&I
- —
- Monthly cashflow
- —
- DSCR
- —
- Eligible?
- —
Short-term bridge; refi at stabilization.
Rent comps 40 comps
| Address | Beds | Baths | Sqft | Rent | $/sqft | DOM | Units | Dist |
|---|---|---|---|---|---|---|---|---|
| 11 Early St Easton, PA | 2.0 | 1.0 | 998 | $1,625 | $1.63 | 44d | 1 | 0.11mi |
| 122 N 13th St Easton, PA | 4.0 | 3.0 | 1736 | $2,300 | $1.32 | 3d | 1 | 0.23mi |
| 1616 Ferry St Unit 2 Easton, PA | 3.0 | 1.0 | 1316 | $1,700 | $1.29 | 3d | 1 | 0.26mi |
| 1247 Jackson St Easton, PA | 2.0 | 2.0 | 1200 | $1,700 | $1.42 | 3d | 1 | 0.31mi |
| 1619 Butler St Easton, PA | 3.0 | 1.0 | 965 | $2,050 | $2.12 | 24d | 1 | 0.45mi |
| 2001 Ferry St Easton, PA | 3.0 | 1.0 | 1440 | $2,200 | $1.53 | 44d | 1 | 0.48mi |
| 1237 Butler St Unit 2 Easton, PA | 3.0 | 1.0 | 900 | $1,700 | $1.89 | 3d | 1 | 0.52mi |
| 1205 Butler St Easton, PA | 2.0 | 1.0 | 900 | $1,700 | $1.89 | 14d | 1 | 0.55mi |
| 203 S 11th St Unit 1st floor Easton, PA | 2.0 | 1.0 | 900 | $1,450 | $1.61 | 44d | 1 | 0.56mi |
| 912 Spring Garden St Easton, PA | 4.0 | 2.0 | 1534 | $2,400 | $1.56 | 44d | 1 | 0.58mi |
| 922 Northampton St Unit 1 Easton, PA | 2.0 | 1.0 | 900 | $1,395 | $1.55 | 44d | 1 | 0.59mi |
| 1051 Washington St Easton, PA | 3.0 | 1.0 | 900 | $1,550 | $1.72 | 14d | 1 | 0.60mi |
| 2118 Northampton St Unit 1 Easton, PA | 2.0 | 1.0 | 1240 | $1,595 | $1.29 | 24d | 1 | 0.61mi |
| 909 Jackson St Unit 2 Easton, PA | 3.0 | 1.0 | 1300 | $2,350 | $1.81 | 44d | 1 | 0.61mi |
| 204 N 9th St Easton, PA | 3.0 | 1.0 | 1450 | $1,900 | $1.31 | 3d | 1 | 0.62mi |
| 2125 Northampton St Easton, PA | 3.0 | 1.0 | 1440 | $2,000 | $1.39 | 14d | 1 | 0.62mi |
| 1232 Bushkill Dr Unit 1234 Bushkill Drive-201 Easton, PA | 2.0 | 1.0 | 1048 | $1,700 | $1.62 | 24d | 1 | 0.63mi |
| 35 N 9th St Easton, PA | 4.0 | 2.0 | 1512 | $2,250 | $1.49 | 3d | 1 | 0.64mi |
| 1108 Butler St Unit 7 Easton, PA | 3.0 | 1.0 | 1146 | $1,575 | $1.37 | 44d | 1 | 0.64mi |
| 817 Ridge St Easton, PA | 2.0 | 1.0 | 1014 | $1,900 | $1.87 | 44d | 1 | 0.67mi |
| 810 Pine St Easton, PA | 3.0 | 1.0 | 1120 | $1,800 | $1.61 | 24d | 1 | 0.70mi |
| 810 Pine St Easton, PA | 3.0 | 1.0 | 1120 | $1,800 | $1.61 | 44d | 1 | 0.70mi |
| 812 Ferry St Easton, PA | 2.0 | 1.0 | 1000 | $1,640 | $1.64 | 24d | 1 | 0.72mi |
| 214 N 7th St Unit NA Easton, PA | 2.0 | 1.0 | 1000 | $1,550 | $1.55 | 3d | 1 | 0.77mi |
| 29 S 7th St Easton, PA | 2.0 | 2.0 | 1100 | $1,350 | $1.23 | 14d | 1 | 0.78mi |
| 35 N 7th St Easton, PA | 3.0 | 1.0 | 1088 | $1,750 | $1.61 | 14d | 1 | 0.78mi |
| 137 N 7th St Apt 1 Easton, PA | 2.0 | 1.0 | 1000 | $1,395 | $1.40 | 3d | 1 | 0.79mi |
| 2250 Butler St Unit 06 Easton, PA | 2.0 | 1.0 | 1000 | $1,700 | $1.70 | 19d | 1 | 0.81mi |
| 2248 Birch St Easton, PA | 3.0 | 1.5 | 1425 | $1,850 | $1.30 | 44d | 1 | 0.90mi |
| 623 Walnut St Unit C2 Easton, PA | 2.0 | 2.5 | 1500 | $2,300 | $1.53 | 44d | 1 | 0.92mi |
| 623 Walnut St Unit A2 Easton, PA | 2.0 | 2.0 | 1500 | $2,250 | $1.50 | 24d | 1 | 0.92mi |
| 915 George St Easton, PA | 2.0 | 2.0 | 1036 | $1,629 | $1.57 | 3d | 1 | 0.95mi |
| 600 Canal St Easton, PA | 2.0 | 1.0 | 900 | $1,599 | $1.78 | 24d | 2 | 0.95mi |
| 600 Canal St Easton, PA | 2.0 | 1.0 | 900 | $1,599 | $1.78 | 3d | 2 | 0.95mi |
| 1065 Bushkill Dr Easton, PA | 3.0 | 1.5 | 1250 | $2,500 | $2.00 | 44d | 1 | 0.96mi |
| 2406 Birch St Easton, PA | 3.0 | 1.5 | 1265 | $2,300 | $1.82 | 14d | 1 | 0.97mi |
| 2406 Birch St Easton, PA | 3.0 | 1.5 | 1265 | $2,300 | $1.82 | 3d | 1 | 0.97mi |
| 142 S Union St Easton, PA | 3.0 | 2.0 | 1300 | $1,895 | $1.46 | 44d | 1 | 0.98mi |
| 40 S 6th St Easton, PA | 1.0–2.0 | 1.0–2.0 | 1156 | $3,000 | $2.59 | 14d | 11 | 1.01mi |
| 2434 Birch St Easton, PA | 3.0 | 1.0 | 1294 | $1,900 | $1.47 | 3d | 1 | 1.02mi |
Listing history 6 events
-
2026-06-18days on market $189,900 Active 6 DOM
-
2026-06-17days on market $189,900 Active 5 DOM
-
2026-06-16days on market $189,900 Active 4 DOM
-
2026-06-15days on market $189,900 Active 3 DOM
-
2026-06-14remarks 584-char remark
-
2026-06-14$189,900 Active 1 DOM
ⓘ Source: listings_history table (triggers on properties + properties_extension) + one-shot
backfill from property_details.listing_events for pre-trigger history.
Tax reassessment forecast PA · Partial reset (capped growth)
- Current annual tax
- $3,456 · $288/mo
- Projected year-2 tax
- $3,456 · $288/mo
- Expected delta
- $0/yr ($0/mo · 0.0%)
ⓘ Screening estimate from a state-policy table — verify with the county assessor before closing.
Climate risk First Street
- Flood 1/10 Low FEMA zone X (unshaded) · 0% chance over 30 yrs
- Wildfire 1/10 Low
- Heat 5/10 Major 7 d/yr ≥100°F today · 15 d/yr by 30 yrs out
- Wind 4/10 Moderate 16% chance of damaging wind over 30 yrs
- Air quality 3/10 Moderate 3 unhealthy d/yr today · 5 by 30 yrs out
Nearby sold comps map
Loading sold comps map…
Walkable amenities ~0.75 mi
Loading nearby amenities…
Taxation est. · year 1
- Rental income
- $23,030
- − Mortgage interest
- −$10,637
- − Property taxes
- −$3,456
- − Insurance
- −$950
- − Repairs & maintenance
- −$1,842
- − Management
- −$1,842
- − Depreciation
- −$5,524
- Taxable loss
- −$1,222
- Est. tax savings @ 24.0%
- +$293
- After-tax cash flow
- $2,131/yr
For passive investors: Depreciation is non-cash, so a rental often shows a tax loss while cash-flowing — sheltering income. Rental losses are passive: they offset passive income freely, and up to $25,000/yr can offset ordinary (W-2) income if you actively participate and your MAGI is under $100k (phasing out to $0 by $150k); unused losses carry forward. On sale, claimed depreciation is recaptured at up to 25%, and gains may owe capital-gains tax (a 1031 exchange can defer both). Figures are a year-1 estimate at your 24.0% rate — not tax advice; consult a CPA.
Schools (NCES district)
- District
- Wilson Area SD
- NCES district ID
- 4226550
- Math proficiency
- 28% ▼ -29.00%
- Reading proficiency
- 52% ▼ -21.00%
- Median HH income
- $58,534
- Composite
- 35.22/100
- National rank
- #4984
- State rank
- #338 of 539 in PA
Livability — Wilson
- Score
- 88/100
- State rank
- #32
- US rank
- #171
Category grades
Schools grade is shown separately in the Schools card above.
Census & demographics
- Census place
- Wilson, PA
- County
- Northampton County · 236,814 people
- Metro
- Allentown-Bethlehem-Easton, PA-NJ
- Population (ZIP)
- 45,532
- Household income
- $77,556
- Rent vs Own
- Severe rent burden
- 1590.0
Population outlook (Northampton County) Hauer SSP2
- Today (2025)
- 312,227 people
- By 2030
- 314,769 · +0.8%
- By 2040
- 316,914 · +1.5%
- By 2050
- 318,037 · +1.9%
- By 2075
- 334,003 · +7.0%
- By 2100
- 344,696 · +10.4%
Race, ethnicity, and origin ACS 2023
- Neighborhood character
- Diverse neighborhood (Simpson 0.61)
- Race & ethnicity
- White 57% Hispanic / Latino 21% Black 12% Two or more races 12% Asian 3%
- Hispanic origin (detail)
- Mexican 3% Puerto Rican 7% Dominican 3%
- Common ancestry
- Romanian 3% Polish 2% Iranian 1%
- Foreign-born
- 13% · Canada, China, Jamaica
- Languages at home
- 80% English-only · Spanish 15% Other Indo-European 1% Arabic 1%
Political lean MEDSL · Northampton
- 2024 margin
- Toss-up / Even · D 48.6% · R 50.4%
- 2008→2024 swing
- -14.1pp toward R · 2008: 12.3pp · 2024: -1.8pp
- All cycles
- 2024: R+1.8 2020: D+0.7 2016: R+3.8 2012: D+4.6 2008: D+12.3
Not yet ingested
- Civics
- —
Market trends
- HPI YoY
- ▼ -460.52%
- Current HPI
- 254.8776
- Rent YoY
- ▲ 4.94%
- Metro
- Allentown-Bethlehem-Easton, PA-NJ
- State GDP YoY
- ▲ 1.68%
- F500 in state
- 34
Industry mix (Fortune 500 HQ in PA)
| Industry | F500 HQs | Revenue |
|---|---|---|
| Healthcare | 2 | $309B |
|
||
| Insurance | 2 | $27B |
|
||
| Telecommunications / Media | 1 | $124B |
|
||
| Industrial Distribution | 1 | $22B |
|
||
| Financial Services | 1 | $20B |
|
||
| Chemicals / Materials | 1 | $18B |
|
||
Price history
+146.6% since first listed4 events — show timeline
- 2026-06-11 Listed $189,900 GLVRMLS
- 2005-06-30 Sold (MLS) $90,000 GLVRMLS
- 2005-05-11 Listed $95,000 GLVRMLS
- 1993-08-01 Sold (Public Records) $77,000 Public Records
Property tax history
+2.2%/yrLatest (2026): $3,456 · +3.2% YoY. Source: county tax records.
Cash-flow waterfall
monthlySold comps — $/sqft
last 12 mo · ≤1 miLoading sold comps…