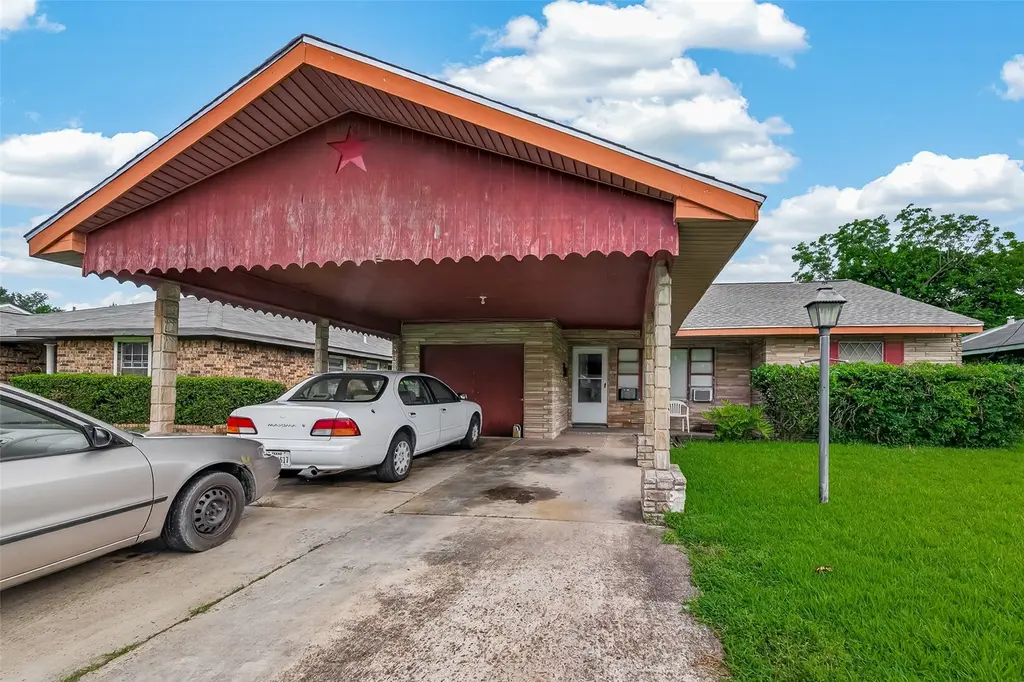
2507 12th St · Galena Park, TX
Flood risk 1/10 · Minimal
- FEMA flood zone
- X (unshaded)
- Chance of flooding over 30 yrs
- 0.0%
- Est. flood insurance / yr
- $507 – $1,088
Fire risk 3/10 · Minor
- Est. fire insurance / yr
- $1,222 – $2,270
Heat risk 9/10 · Severe
- Hot days now (above 109°F)
- 7 days/yr
- Hot days in 30 yrs
- 24 days/yr
Wind risk 9/10 · Severe
- Chance of severe wind over 30 yrs
- 99.0%
Air-quality risk 2/10 · Minimal
- Unhealthy air days now
- 2 days/yr
- Unhealthy air days in 30 yrs
- 2 days/yr
Risk factors via First Street. Map © Google.
Why this score? — see what drove the B+ grade
The composite is a weighted blend of 9 inputs, each scored 0–100. Each bar is that input's sub-score; the figure is the points it added to the 100-point composite (weight × sub-score).
- Cash flow +27.1/30.0
- ARV discount +15.0/15.0
- DSCR +9.4/10.0
- 1% rule +8.2/10.0
- Appreciation +7.5/10.0
- Livability +3.4/5.0
- Schools +2.8/10.0
- Rent growth +2.5/5.0
- Condition / age +2.5/5.0
$135,000
🖨 Deal sheet 📄 Offer letter ✓ Due diligence
Listing remarks
Opportunity awaits with this spacious home featuring great bones and plenty of potential. The entry opens to a large living room that flows into the formal dining area. The kitchen and breakfast room are combined into one open space, creating a functional layout. Several updates have been completed over the years, including kitchen cabinets, countertops, and flooring through part of the home. Some improvements are more recent, while others may benefit from updating. At the back of the home is a large den with a sliding glass door overlooking the backyard. This flexible space includes a dry bar area and a closet and could easily be converted into an additional bedroom with minimal modificati
Key facts
- Open space
- Large living room
- Flooring
Tags
Property features AI
Exterior
- Utilities: Public water; Public sewer
- Home design: Residential property; One-story (entry level: first floor)
- Construction: Brick construction; Built in 1951; Composition roof; Slab foundation
- Exterior features: Subdivision lot
Interior
- Kitchen: Kitchen (10x10); Breakfast nook (10x10)
- Bedrooms: Four possible bedrooms; First-floor bedrooms (three listed at 12x12, 12x12, 16x12)
- Bathrooms: 2 full bathrooms
- Heating & cooling: Central gas heating; Central electric air conditioning
- Interior features: Kitchen/dining combo; 7 total rooms
Neighborhood map
What this means for you Summary
Snapshot
- This is a 4-bed/2.0-bath single-family listed at $135k.
Deal economics
- At list price, monthly cash flow is $381 ($5k/yr) — positive.
- The deal already cash-flows at list — no discount required.
- Meets the 1% rule at list price ($2k rent vs $135k).
- Cap rate 9.7% vs local median 4.1% in Galena Park — top-decile yield for the area; either an underpriced asset or a hidden risk that comps aren't pricing in. Stress-test before assuming the spread holds.
Location & tenants
- Location reads 68/100 on livability (#456 in TX) — a middle-class / working-renter tenant base. Strengths: crime A+, cost of living A+, housing A+; Watch: amenities F, commute F, employment D-.
- Galena Park ISD (suburban): math 32% / reading 33% proficiency, ranked #578 of 826 in TX (top 70%) — families likely to look elsewhere, expect single-tenant / working-renter base with shorter leases; 74% free/reduced lunch — lower-income household profile, screen leases tightly.
- Zoned schools: Galena Park El (math 31% / reading 36%, grade F, #2,174 of 4,322 statewide, top 51%, 597 students, 88% FRL); Galena Park Middle (math 28% / reading 31%, grade F, #1,077 of 1,662 statewide, top 66%, 943 students, 88% FRL); Galena Park H S (math 37% / reading 36%, grade F, #924 of 1,632 statewide, top 57%, 1,914 students, 87% FRL).
- Market conditions: 38 active listings in the ZIP; 9 comparable units currently listed for rent nearby; rentals lingering (median 44d on market — plan ~5-8 weeks vacancy on turnover, expect pricing pressure); 56% of comp listings sitting > 30 days — soft ceiling on asking rent; 29,883 units permitted in Harris County in 2024 (8,621 in 5+ unit buildings).
Forward outlook
- In year one you build about $8k of equity ($933 loan paydown + $7k appreciation (5.0% local appreciation)).
- Harris County population projected at +47% by 2050 — long-run rental-demand tailwind backs the buy-and-hold thesis.
- At projected returns (5.0% appreciation + 3.0% rent growth), your $38k cash investment doubles in ~3 years — after that, you're playing with house money.
- By year 5, paydown + projected appreciation supports a ~$33k cash-out refi (75% LTV) — recoverable capital for the next deal without selling this one.
Negotiation context
- Only 14 days on market — expect competitive offers; lowballing is unlikely to land.
Risks & watch-outs
- Watch-outs: built in 1951 — expect roof / HVAC / electrical / plumbing capex.
- Climate carrying-cost: severe wind risk, 99% chance of damaging wind over 30y; extreme-heat days projected 7→24/yr by 2055 (HVAC capex compounding) — expect insurance premiums to compound above CPI over the hold.
Questions for the listing agent
- Built in 1951 — when were the roof, HVAC, electrical panel, plumbing, and water heater last replaced?
- Is there a deadline driving the sale (1031 exchange, divorce, estate, relocation)? That informs how much negotiation room exists.
- Schools are D-rated, which usually means shorter tenancies and higher turnover. Who's the typical renter profile here, and what's been the actual vacancy rate?
- What's the average days-on-market for RENTAL listings here right now (not sales)? A rising rental-DOM trend means longer vacancies and softer asking-rent achievability than the comps imply.
- What's the recent tenant-quality profile in this submarket — average credit score on applications, eviction rate, late-payment / NSF rate, and stable-employment percentage? A property-management company in the area should have these aggregated.
- How much new for-sale + rental construction is in the pipeline within 1–3 miles? Heavy new supply typically softens prices + rents 12–24 months out; constrained supply supports both.
Investment metrics
- 1% rule
- 1.32% ✓
- Cap rate
- 9.68%
- Cash-on-cash
- 12.10%
- DSCR
- 1.54
- GRM
- 6.3
CMA / ARV
- ARV (on-the-fly)
- $234,900
- Comps found
- 12
Show comp detail 12 sales within ~0.75 mi
| Address | Dist | Beds/Ba | Sqft | Sold | Price | $/sf | Match |
|---|---|---|---|---|---|---|---|
| 2503 13th St | 0.06mi | 4/2.0 | 1,420 (-9%) | 4mo | $221,000 | $156 | 78 |
| 416 Calloway St | 0.16mi | 3/1.0 (-1) | 1,584 (+1%) | 5mo | $199,900 | $126 | 78 |
| 320 Clearwater St | 0.23mi | 3/2.0 (-1) | 1,551 (-1%) | 8mo | $240,000 | $155 | 76 |
| 320 Delaware St | 0.31mi | 3/2.5 (-1) | 1,540 (-2%) | 1mo | $165,000 | $107 | 75 |
| 324 Gans St Unit A | 0.42mi | 3/2.5 (-1) | 1,589 (+2%) | 3mo | $215,000 | $135 | 68 |
| 414 Clinton Park St | 0.43mi | 3/2.0 (-1) | 1,579 (+1%) | 8mo | $155,000 | $98 | 67 |
| 274 Owens St | 0.30mi | 3/2.5 (-1) | 1,469 (-6%) | 8mo | $110,000 | $75 | 62 |
| 326 Gans St Unit A | 0.42mi | 3/2.5 (-1) | 1,505 (-4%) | 6mo | $225,000 | $150 | 62 |
| 328 Gans St | 0.41mi | 3/2.0 (-1) | 1,456 (-7%) | 4mo | $275,000 | $189 | 61 |
| 1204 Sage Dr | 0.05mi | 3/1.0 (-1) | 1,336 (-15%) | 8mo | $160,000 | $120 | 58 |
| 9803 Mimbrough St | 0.49mi | 3/2.0 (-1) | 1,380 (-12%) | 7mo | $207,000 | $150 | 46 |
| 2012 10th St | 0.61mi | 3/2.0 (-1) | 1,395 (-11%) | 6mo | $230,000 | $165 | 43 |
Match score weights: distance 35% · size 25% · config 20% · recency 20%. Top-matched comps best support the ARV.
Projected returns pro-forma
4.96% appreciation · 3.0% rent growth · sell at horizon
- IRR
- 23.2%
- Equity multiple
- 2.46×
- Total profit
- $55,186
- Equity at exit
- $76,185
- IRR
- 22.7%
- Equity multiple
- 4.87×
- Total profit
- $146,162
- Equity at exit
- $131,224
Cash invested: $37,800 (down + closing). Projections, not guarantees.
Landlord ↔ Tenant lean methodology
- Overall (STATE)
- 87 Strongly Landlord-Friendly
- State Texas
- 87 Strongly Landlord-Friendly · R+5
- County
- — inherits STATE
- City
- — inherits STATE
ZIP-level market 77547
- Home prices YoY
- 2.0%
- Active inventory
- 38
- Price-to-rent
- 6.3×
Monthly cashflow live
- Estimated rent
- $1,783 high interval (Pro) →
- Mortgage (P&I)
- −$708
- Tax from tax record
- −$263 /mo · $3,153/yr
- Insurance
- −$56
- HOA
- −$0
- Vacancy / Maint / Mgmt
- −$374
- Net cashflow
- $381
Break-even live
UW: 25.0% down · 7.5% · 30yr · 1.5% tax · 5.0% vac · 8.0% maint · 8.0% mgmt
Financing live
Cash to close
- Down payment
- $33,750
- Closing costs
- $4,050
- Reserves months
- —
- Total cash needed
- —
Loan-product check · same deal, 3 products live
Conventional
25% down · 7.5% · 30yr
- Down + closing
- —
- Monthly P&I
- —
- Monthly cashflow
- —
- DSCR
- —
- Eligible?
- —
Personal DTI + credit; lowest rate.
DSCR
20% down · 8.5% · 30yr
- Down + closing
- —
- Monthly P&I
- —
- Monthly cashflow
- —
- DSCR
- —
- Eligible?
- —
No personal income docs; deal must DSCR.
Hard money
10% down · 12.0% · 12mo
- Down + closing
- —
- Monthly P&I
- —
- Monthly cashflow
- —
- DSCR
- —
- Eligible?
- —
Short-term bridge; refi at stabilization.
Rent comps 9 comps
| Address | Beds | Baths | Sqft | Rent | $/sqft | DOM | Units | Dist |
|---|---|---|---|---|---|---|---|---|
| 423 Armstrong St Houston, TX | 3.0 | 2.0 | 1090 | $1,515 | $1.39 | 2d | 1 | 0.28mi |
| 253 N Carolina St Houston, TX | 4.0 | 2.0 | 1560 | $1,600 | $1.03 | 7d | 1 | 0.32mi |
| 205 Bolden St Unit A Houston, TX | 3.0 | 2.0 | 1200 | $2,500 | $2.08 | 43d | 1 | 0.42mi |
| 220 Armstrong St Houston, TX | 5.0 | 2.0 | 1900 | $2,000 | $1.05 | 43d | 1 | 0.42mi |
| 311 Massachusetts St Unit A Houston, TX | 3.0 | 2.0 | 1184 | $1,700 | $1.44 | 12d | 1 | 0.50mi |
| 2216 3rd St Galena Park, TX | 3.0 | 2.0 | 1500 | $1,400 | $0.93 | 43d | 1 | 0.58mi |
| 9821 Turnbow St Unit C Houston, TX | 3.0 | 2.0 | 1140 | $1,720 | $1.51 | 43d | 1 | 0.68mi |
| 9710 Tuffly St Houston, TX | 3.0 | 2.0 | 1275 | $1,795 | $1.41 | 24d | 1 | 1.00mi |
| 9709 Cargill St Houston, TX | 3.0 | 2.0 | 1184 | $2,300 | $1.94 | 43d | 1 | 1.22mi |
Listing history 10 events
-
2026-06-18days on market $135,000 Active 14 DOM
-
2026-06-17pricedays on market $135,000 Active 13 DOM
-
2026-06-16days on market $145,000 Active 12 DOM
-
2026-06-15days on market $145,000 Active 11 DOM
-
2026-06-13days on market $145,000 Active 9 DOM
-
2026-06-13days on market $145,000 Active 8 DOM
-
2026-06-09days on market $145,000 Active 5 DOM
-
2026-06-08days on market $145,000 Active 4 DOM
-
2026-06-07remarks 699-char remark
-
2026-06-07$145,000 Active 3 DOM
ⓘ Source: listings_history table (triggers on properties + properties_extension) + one-shot
backfill from property_details.listing_events for pre-trigger history.
Tax reassessment forecast TX · Resets to sale price
- Current annual tax
- $3,153 · $263/mo
- Projected year-2 tax
- $3,153 · $263/mo
- Expected delta
- $0/yr ($0/mo · 0.0%)
ⓘ Screening estimate from a state-policy table — verify with the county assessor before closing.
Climate risk First Street
- Flood 1/10 Low FEMA zone X (unshaded) · 0% chance over 30 yrs
- Wildfire 3/10 Moderate
- Heat 9/10 Extreme 7 d/yr ≥109°F today · 24 d/yr by 30 yrs out
- Wind 9/10 Extreme 99% chance of damaging wind over 30 yrs
- Air quality 2/10 Low 2 unhealthy d/yr today · 2 by 30 yrs out
Nearby sold comps map
Loading sold comps map…
Walkable amenities ~0.75 mi
Loading nearby amenities…
Taxation est. · year 1
- Rental income
- $21,390
- − Mortgage interest
- −$7,562
- − Property taxes
- −$3,153
- − Insurance
- −$675
- − Repairs & maintenance
- −$1,711
- − Management
- −$1,711
- − Depreciation
- −$3,927
- Taxable income
- $2,651
- Est. tax owed @ 24.0%
- −$636
- After-tax cash flow
- $3,939/yr
For passive investors: Depreciation is non-cash, so a rental often shows a tax loss while cash-flowing — sheltering income. Rental losses are passive: they offset passive income freely, and up to $25,000/yr can offset ordinary (W-2) income if you actively participate and your MAGI is under $100k (phasing out to $0 by $150k); unused losses carry forward. On sale, claimed depreciation is recaptured at up to 25%, and gains may owe capital-gains tax (a 1031 exchange can defer both). Figures are a year-1 estimate at your 24.0% rate — not tax advice; consult a CPA.
Schools (NCES district)
- District
- Galena Park ISD
- NCES district ID
- 4820250
- Math proficiency
- 32% ▼ -20.00%
- Reading proficiency
- 33% ▼ -7.00%
- Median HH income
- $43,158
- Composite
- 27.62/100
- National rank
- #6927
- State rank
- #578 of 826 in TX
Livability — Galena Park
- Score
- 68/100
- State rank
- #456
- US rank
- #9227
Category grades
Schools grade is shown separately in the Schools card above.
Census & demographics
- Census place
- Galena Park, TX
- City population
- 9,380
- Population (ZIP)
- 9,380
Population outlook (Harris County) Hauer SSP2
- Today (2025)
- 5,571,493 people
- By 2030
- 6,089,821 · +9.3%
- By 2040
- 7,142,806 · +28.2%
- By 2050
- 8,185,864 · +46.9%
- By 2075
- 10,574,329 · +89.8%
- By 2100
- 12,109,958 · +117.4%
Race, ethnicity, and origin ACS 2023
- Neighborhood character
- Predominantly Hispanic (90%)
- Race & ethnicity
- Hispanic / Latino 90% Two or more races 46% Black 5% White 4%
- Hispanic origin (detail)
- Mexican 88%
- Foreign-born
- 32% · Canada
- Languages at home
- 21% English-only · Spanish 79%
Political lean MEDSL · Harris
- 2024 margin
- Lean D (+5.5) · D 52.0% · R 46.4% · Other 1.6%
- 2008→2024 swing
- +3.9pp toward D · 2008: 1.6pp · 2024: 5.5pp
- All cycles
- 2024: D+5.5 2020: D+13.3 2016: D+12.4 2012: D+0.1 2008: D+1.6
Not yet ingested
- Civics
- —
Market trends
- HPI YoY
- ▲ 4.96%
- Current HPI
- 252.9899
- Rent YoY
- —
- Metro
- —
- State GDP YoY
- ▲ 3.95%
- F500 in state
- 110
Industry mix (Fortune 500 HQ in TX)
| Industry | F500 HQs | Revenue |
|---|---|---|
| Energy | 16 | $1,198B |
|
||
| Technology | 5 | $198B |
|
||
| Engineering / Construction | 4 | $72B |
|
||
| Energy Services | 3 | $60B |
|
||
| Utilities | 3 | $41B |
|
||
| Healthcare | 2 | $330B |
|
||
Price history
2 events — show timeline
- 2026-06-04 Listed $145,000 HARMLS
- 1995-06-11 Sold (Public Records) — Public Records
Property tax history
+1.8%/yrLatest (2025): $3,153 · +14.7% YoY. Source: county tax records.
Cash-flow waterfall
monthlySold comps — $/sqft
last 12 mo · ≤1 miLoading sold comps…