 🏷️ Likely Rental
1200 Boylston Ave #304 · Seattle, WA
Flood risk 1/10 · Minimal
- FEMA flood zone
- X (unshaded)
- Chance of flooding over 30 yrs
- 0.0%
- Est. flood insurance / yr
- $507 – $1,088
Fire risk 1/10 · Minimal
- Est. fire insurance / yr
- $604 – $1,122
Heat risk 3/10 · Minor
- Hot days now (above 86°F)
- 7 days/yr
- Hot days in 30 yrs
- 14 days/yr
Wind risk 1/10 · Minimal
- Chance of severe wind over 30 yrs
- —
Air-quality risk 7/10 · Major
- Unhealthy air days now
- 11 days/yr
- Unhealthy air days in 30 yrs
- 11 days/yr
Risk factors via First Street. Map © Google.
Why this score? — see what drove the D grade
The composite is a weighted blend of 9 inputs, each scored 0–100. Each bar is that input's sub-score; the figure is the points it added to the 100-point composite (weight × sub-score).
- ARV discount +15.0/15.0
- Schools +6.1/10.0
- Appreciation +4.7/10.0
- Cash flow +4.4/30.0
- 1% rule +4.0/10.0
- Livability +3.8/5.0
- Condition / age +2.5/5.0
- Rent growth +2.4/5.0
- DSCR +0.0/10.0
$225,000
🖨 Deal sheet (PDF) 📄 Offer letter ✓ Due diligence
Listing remarks
Got allergies? This condo is for you! No pets allowed and no carpet in the unit! Unit features vinyl plank floors, fresh paint, & brand new refrigerator. Windows face east for morning sun and cooler afternoons. Walkable to downtown & Cap Hill - central location to restaurants, music venues, parks, grocery, & hospitals. Proactive HOA and a secure building. HOA dues include heat and hot water. No rental cap means you can live there yourself or rent it out - lots of flexibility! Easy access to buses and light rail - Location! Location! Location!
Key facts
- Fresh paint
- Secure building
- Walkable to downtown
Tags
Property features AI
Finance
- Other: 49 units in the building; Common features include elevator and lobby entrance; Bus service nearby
- Financial info: Listing terms: Cash or Conventional
- HOA & community: Monthly association fee of $740; HOA fee includes central hot water, sewer, trash, and water; Building amenities: elevator, lobby entrance, fire sprinklers; Pets not allowed; Association contact: Melanie Ondruska
Exterior
- Parking: No parking included
- Security: Fire sprinklers; Lobby entrance
- Utilities: Electric and natural gas service; Water and sewer provided by SPU; Power from Seattle City Light; Cable and internet: Comcast Xfinity
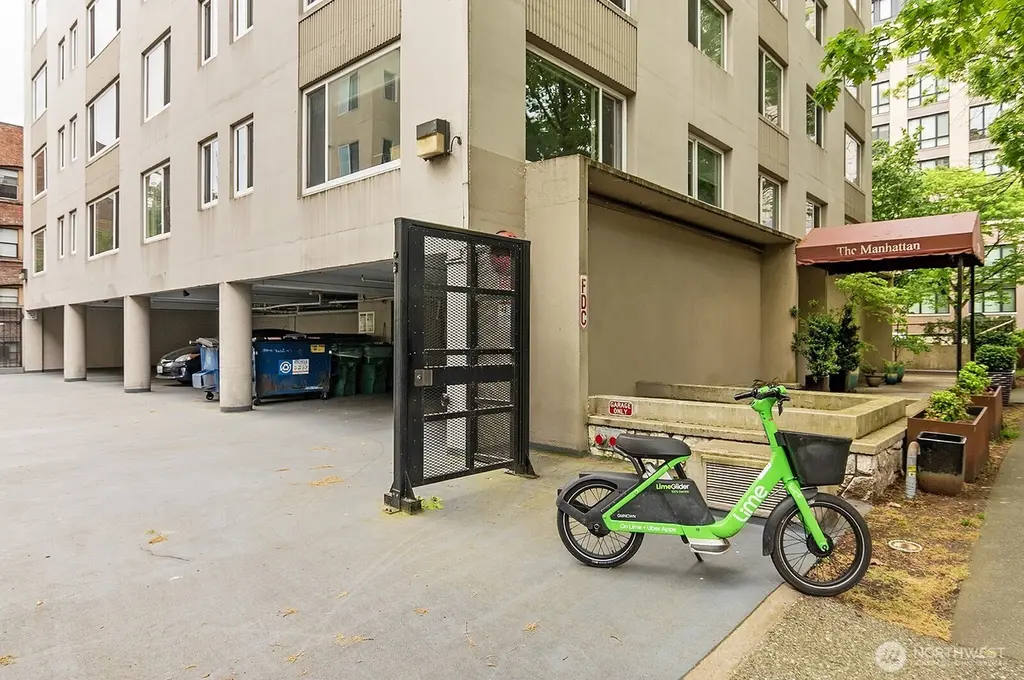
- Home design: Attached condominium; One-level condo unit; Located on the 3rd floor of a 10-story building; Main-level entry; Building name: Manhattan
- Construction: Cement construction materials; Flat torch-down roof; Built as a multi-family structure
- Exterior features: Cement/concrete exterior; Corner lot setting; Alley access; Paved surfaces and sidewalks
Interior
- Kitchen: Dishwasher; Garbage disposal; Microwave; Refrigerator; Stove/Range
- Bedrooms: One bedroom on the main level (Primary Bedroom on main level)
- Flooring: Vinyl; Vinyl plank
- Bathrooms: One full bathroom with bathtub and separate shower (main level)
- Heating & cooling: Radiator heating; No central air conditioning
- Interior features: Blinds on windows; End unit with insulated windows; Entry hall; Dining room; Living room; Unit has a view
- Laundry & utility: Storage in basement (storage unit #304)
Neighborhood map
What this means for you Summary
Snapshot
- This is a 1-bed/1.0-bath condo listed at $225k.
Deal economics
- At list price, monthly cash flow is $-594 ($-7k/yr) — negative.
- To cash-flow at today's rent, offer at most $120k (46.6% below list).
- To meet the 1% rule (rent ≥ 1% of price), the offer needs to be $203k (9.6% below list).
- Recommended offer: $120k (46.6% below list) — sets the bar for cash-flow.
- Cap rate 3.1% vs local median 1.6% in Seattle — top-decile yield for the area; either an underpriced asset or a hidden risk that comps aren't pricing in. Stress-test before assuming the spread holds.
Location & tenants
- Location reads 75/100 on livability (#166 in WA, #4,033 nationally) — a middle-class / working-renter tenant base. Strengths: amenities A+, commute A+, employment A+; Watch: crime F, cost of living F.
- Seattle Public Schools (urban): math 64% / reading 72% proficiency, ranked #19 of 291 in WA (top 6%) — acceptable for families but not a draw, mixed tenant base, ~2y average lease.
- Zoned schools: Hazel Wolf K-8 (720 students, 22% FRL); Washington Middle School (555 students, 65% FRL); Garfield High School (1,642 students, 40% FRL).
- Market conditions: Rents soft (-0.3%/yr); 155 active listings in the ZIP; 40 comparable units currently listed for rent nearby; rentals leasing fast (median 0d on market — plan ~1-2 weeks tenant-placement turnaround); high-income renter base; 10,555 units permitted in King County in 2024 (7,119 in 5+ unit buildings).
Forward outlook
- In year one you build about $382 of equity ($2k loan paydown + $-1k appreciation (-0.5% local appreciation)).
- King County population projected at +44% by 2050 — long-run rental-demand tailwind backs the buy-and-hold thesis.
Negotiation context
- It's been on market 41 days — a 3% lower offer ($218k) is reasonable based on typical stale-listing flexibility.
- Current owner paid $56k; list at $225k implies a 305% gain — meaningful room to come down on a strong offer.
Risks & watch-outs
- Watch-outs: HOA is 36% of rent.
Questions for the listing agent
- What do current leases actually rent for vs. the listed asking? Can we see a recent rent roll and the last 12 months of T-12 income?
- It's been on market 41 days. Have you received any prior offers? Is the seller open to a 47% concession, seller financing, or rate buy-down credit?
- Built in 1960 — when were the roof, HVAC, electrical panel, plumbing, and water heater last replaced?
- What does the HOA fee cover, when was the last increase, and are there any pending special assessments or reserve-fund shortfalls?
- Any open or pending special assessments — roof, HVAC, plumbing, elevator, façade? What's the per-unit balance and payoff schedule, and is the seller paying it off at close or rolling it to the buyer?
- Is there a deadline driving the sale (1031 exchange, divorce, estate, relocation)? That informs how much negotiation room exists.
- Schools are A-rated — typically a magnet for longer-tenancy family renters. What's the average tenant stay here, and is there a school-zone premium baked into asking?
- Crime grade is F in this area — have there been break-ins, vandalism, or insurance claims at this property in the last 3 years? What carrier currently insures it and at what premium?
- The area grade is low — what's the realistic commute time and amenity access for the typical tenant pool here? Any planned neighborhood developments (good or bad) we should know about?
- What's the average days-on-market for RENTAL listings here right now (not sales)? A rising rental-DOM trend means longer vacancies and softer asking-rent achievability than the comps imply.
- What's the recent tenant-quality profile in this submarket — average credit score on applications, eviction rate, late-payment / NSF rate, and stable-employment percentage? A property-management company in the area should have these aggregated.
- How much new apartment / multifamily construction is in the pipeline within 1–3 miles? Heavy new supply (>2% of stock underway) typically softens rents 12–24 months out; light construction supports rent growth.
Investment metrics
- 1% rule
- 0.90% ✗
- Cap rate
- 3.13%
- Cash-on-cash
- -11.31%
- DSCR
- 0.50
- GRM
- 9.2
CMA / ARV
- ARV (median comp)
- $327,147
- List price
- $225,000
- Delta
- -31.22%
- Verdict
- UNDERPRICED
- Comps
- 20 within 1.0 mi
Projected returns pro-forma
-0.52% appreciation · 0.0% rent growth · sell at horizon
- IRR
- -20.5%
- Equity multiple
- 0.12×
- Total profit
- $-55,392
- Equity at exit
- $59,525
- IRR
- -17.3%
- Equity multiple
- -0.50×
- Total profit
- $-94,731
- Equity at exit
- $67,067
Cash invested: $63,000 (down + closing). Projections, not guarantees.
Landlord ↔ Tenant lean methodology
- Overall (CITY)
- 0 Strongly Tenant-Friendly
- State Washington
- 28 Tenant-Leaning · D+8
- County
- — inherits STATE
- City Seattle
- 0 Strongly Tenant-Friendly · D+52
ZIP-level market 98101
- Home prices YoY
- -0.3%
- Rents YoY
- -0.3%
- Active inventory
- 155
- Price-to-rent
- 9.2×
Monthly cashflow live
- Estimated rent
- $2,033 high interval (Pro) →
- Mortgage (P&I)
- −$1,180
- Tax from tax record
- −$186 /mo · $2,237/yr
- Insurance
- −$94
- HOA
- −$740
- Vacancy / Maint / Mgmt
- −$427
- Net cashflow
- $-594
Break-even live
Sensitivity live
| Price | -10% $-466 | -5% $-530 | +0% $-594 | +5% $-657 | +10% $-721 |
|---|---|---|---|---|---|
| Rent | -10% $-754 | -5% $-674 | +0% $-594 | +5% $-513 | +10% $-433 |
| Rate | -1.0pp $-480 | -0.5pp $-537 | base $-594 | +0.5pp $-652 | +1.0pp $-711 |
UW: 25.0% down · 7.5% · 30yr · 1.5% tax · 5.0% vac · 8.0% maint · 8.0% mgmt
Financing live
Cash to close
- Down payment
- $56,250
- Closing costs
- $6,750
- Reserves months
- —
- Total cash needed
- —
Loan-product check · same deal, 3 products live
Conventional
25% down · 7.5% · 30yr
- Down + closing
- —
- Monthly P&I
- —
- Monthly cashflow
- —
- DSCR
- —
- Eligible?
- —
Personal DTI + credit; lowest rate.
DSCR
20% down · 8.5% · 30yr
- Down + closing
- —
- Monthly P&I
- —
- Monthly cashflow
- —
- DSCR
- —
- Eligible?
- —
No personal income docs; deal must DSCR.
Hard money
10% down · 12.0% · 12mo
- Down + closing
- —
- Monthly P&I
- —
- Monthly cashflow
- —
- DSCR
- —
- Eligible?
- —
Short-term bridge; refi at stabilization.
Rent comps 40 comps
| Address | Beds | Baths | Sqft | Rent | $/sqft | DOM | Units | Dist |
|---|---|---|---|---|---|---|---|---|
| 1321 Seneca St Seattle, WA | 1.0 | 1.0 | 648 | $2,995 | $4.62 | 14d | 1 | 0.02mi |
| 1321 Seneca St Seattle, WA | 1.0 | 1.0 | 696 | $3,100 | $4.45 | 12d | 1 | 0.02mi |
| 1100 Boylston Ave Seattle, WA | 1.0–2.0 | 1.0 | 720 | $2,537 | $3.52 | 0d | 11 | 0.03mi |
| 1201 Boylston Ave Seattle, WA | 1.0 | 1.0 | 563 | $1,945 | $3.45 | 0d | 4 | 0.04mi |
| 1414 Seneca St Seattle, WA | 2.0 | 1.0 | 732 | $1,698 | $2.32 | 0d | 4 | 0.05mi |
| 1220 Boylston Ave Seattle, WA | 1.0 | 1.0 | 725 | $1,470 | $2.03 | 0d | 3 | 0.06mi |
| 1215 Seneca St Seattle, WA | 2.0 | 1.0 | 546 | $1,745 | $3.19 | 0d | 7 | 0.08mi |
| 1425 Spring St Seattle, WA | 1.0–3.0 | 1.0–3.0 | 1575 | $2,302 | $1.46 | 0d | 14 | 0.09mi |
| 1103 Summit Ave Seattle, WA | — | 1.0 | 331 | $1,555 | $4.70 | 45d | 5 | 0.09mi |
| 1103 Summit Ave Seattle, WA | — | 1.0 | 352 | $1,375 | $3.91 | 0d | 3 | 0.09mi |
| 604 E Union St Seattle, WA | — | 1.0 | 514 | $1,362 | $2.65 | 0d | 4 | 0.09mi |
| 1404 Boylston Ave Seattle, WA | — | 1.0 | 361 | $1,462 | $4.05 | 0d | 6 | 0.09mi |
| 1421 Harvard Ave Seattle, WA | 2.0 | 1.0–2.0 | 721 | $3,118 | $4.32 | 0d | 5 | 0.10mi |
| 1416 Boylston Ave Seattle, WA | 2.0 | 1.0–2.0 | 911 | $2,950 | $3.24 | 15d | 5 | 0.10mi |
| 1417 Boylston Ave #121 Seattle, WA | 1.0 | 1.0 | 525 | $1,495 | $2.85 | 0d | 1 | 0.11mi |
| 1419 Boylston Ave Apt 321 Seattle, WA | — | 1.0 | 400 | $1,195 | $2.99 | 0d | 1 | 0.11mi |
| 1420 Boylston Ave Apt 2 Seattle, WA | 1.0 | 1.0 | 485 | $1,250 | $2.58 | 45d | 1 | 0.12mi |
| 516 E Union St Seattle, WA | — | 1.0 | 432 | $1,310 | $3.03 | 0d | 4 | 0.12mi |
| 506 E Union St Seattle, WA | 1.0 | 1.0 | 390 | $1,295 | $3.32 | 0d | 2 | 0.13mi |
| 713 E Pike St Unit 301 Seattle, WA | 2.0 | 1.0 | 730 | $1,850 | $2.53 | 26d | 1 | 0.13mi |
| 1000 Minor Ave Seattle, WA | 2.0 | 1.0–2.0 | 858 | $2,684 | $3.13 | 0d | 21 | 0.14mi |
| 601 E Pike St Seattle, WA | 1.0 | 1.0 | 560 | $2,599 | $4.64 | 0d | 4 | 0.14mi |
| 1430 Summit Ave Seattle, WA | 1.0–2.0 | 1.0–2.0 | 779 | $2,195 | $2.82 | 0d | 7 | 0.16mi |
| 1001 Minor Ave Seattle, WA | 1.0–2.0 | 1.0–2.0 | 790 | $2,312 | $2.93 | 0d | 14 | 0.16mi |
| 501 E Pike St Seattle, WA | 1.0–2.0 | 1.0–2.0 | 779 | $2,225 | $2.85 | 0d | 7 | 0.17mi |
| 1225 10th Ave Seattle, WA | 1.0 | 1.0 | 433 | $2,095 | $4.84 | 0d | 6 | 0.17mi |
| 954 E Union St Seattle, WA | 2.0 | 1.0–2.0 | 843 | $2,845 | $3.37 | 0d | 4 | 0.17mi |
| 1512 Boylston Ave Seattle, WA | 1.0 | 1.0 | 600 | $1,395 | $2.33 | 0d | 1 | 0.17mi |
| 1220 Boren Ave Seattle, WA | 1.0 | 1.0 | 585 | $2,495 | $4.26 | 0d | 7 | 0.17mi |
| 1105 Spring St Seattle, WA | 1.0 | 1.0 | 655 | $1,888 | $2.88 | 0d | 2 | 0.18mi |
| 1105 Spring St Seattle, WA | 1.0 | 1.0 | 655 | $1,875 | $2.86 | 4d | 3 | 0.18mi |
| 1511 Boylston Ave Apt 106 Seattle, WA | 1.0 | 1.0 | 600 | $1,525 | $2.54 | 19d | 1 | 0.18mi |
| 1511 Boylston Ave Apt 304 Seattle, WA | 1.0 | 1.0 | 600 | $1,550 | $2.58 | 23d | 1 | 0.18mi |
| 1511 Boylston Ave Seattle, WA | 1.0 | 1.0 | 600 | $1,550 | $2.58 | 3d | 1 | 0.18mi |
| 1530 Belmont Ave Seattle, WA | 2.0 | 1.0–3.0 | 889 | $2,858 | $3.21 | 0d | 1 | 0.19mi |
| 1525 Harvard Ave Seattle, WA | 1.0–2.0 | 1.0–2.0 | 717 | $2,310 | $3.22 | 0d | 3 | 0.19mi |
| 1017 Boren Ave Seattle, WA | — | 1.0 | 473 | $1,440 | $3.04 | 0d | 1 | 0.21mi |
| 1529 Boylston Ave Seattle, WA | 1.0 | 1.0 | 450 | $1,325 | $2.94 | 0d | 1 | 0.21mi |
| 1020 Seneca St Seattle, WA | 1.0 | 1.0 | 592 | $2,477 | $4.18 | 0d | 9 | 0.21mi |
| 1414 10th Ave Seattle, WA | 2.0 | 1.0–2.0 | 816 | $2,864 | $3.51 | 0d | 22 | 0.21mi |
HOA detail condo
- Monthly dues
- $740 · $8,880/yr
- Likely covers
- water
- Assessments
- None detected in remarks — confirm with the listing agent.
Listing history 26 events
-
2026-06-22days on market $225,000 Active 41 DOM
-
2026-06-21days on market $225,000 Active 40 DOM
-
2026-06-21days on market $225,000 Active 39 DOM
-
2026-06-19days on market $225,000 Active 38 DOM
-
2026-06-18days on market $225,000 Active 37 DOM
-
2026-06-17days on market $225,000 Active 36 DOM
-
2026-06-16days on market $225,000 Active 35 DOM
-
2026-06-15days on market $225,000 Active 34 DOM
-
2026-06-15days on market $225,000 Active 33 DOM
-
2026-06-13days on market $225,000 Active 32 DOM
-
2026-06-12days on market $225,000 Active 31 DOM
-
2026-06-10days on market $225,000 Active 29 DOM
-
2026-06-09days on market $225,000 Active 28 DOM
-
2026-06-08days on market $225,000 Active 27 DOM
-
2026-06-07days on market $225,000 Active 26 DOM
-
2026-06-07days on market $225,000 Active 25 DOM
-
2026-06-04days on market $225,000 Active 23 DOM
-
2026-06-03days on market $225,000 Active 22 DOM
-
2026-06-02days on market $225,000 Active 21 DOM
-
2026-06-01days on market $225,000 Active 20 DOM
-
2026-05-31days on market $225,000 Active 19 DOM
-
2026-05-12$225,000 Active
-
1994-11-04soldstatus $55,500
-
1990-06-15soldstatus $60,000
-
1987-05-11soldstatus $34,000
-
1980-06-18soldstatus $40,500
ⓘ Source: listings_history table (triggers on properties + properties_extension) + one-shot
backfill from property_details.listing_events for pre-trigger history.
Tax reassessment forecast WA · Resets to sale price
- Current annual tax
- $2,237 · $186/mo
- Projected year-2 tax
- $2,237 · $186/mo
- Expected delta
- $0/yr ($0/mo · 0.0%)
ⓘ Screening estimate from a state-policy table — verify with the county assessor before closing.
Climate risk First Street
- Flood 1/10 Low FEMA zone X (unshaded) · 0% chance over 30 yrs
- Wildfire 1/10 Low
- Heat 3/10 Moderate 7 d/yr ≥86°F today · 14 d/yr by 30 yrs out
- Wind 1/10 Low
- Air quality 7/10 Severe 11 unhealthy d/yr today · 11 by 30 yrs out
Nearby sold comps map
Loading sold comps map…
Walkable amenities ~0.75 mi
Loading nearby amenities…
Taxation est. · year 1
- Rental income
- $24,399
- − Mortgage interest
- −$12,603
- − Property taxes
- −$2,237
- − Insurance
- −$1,125
- − Repairs & maintenance
- −$1,952
- − Management
- −$1,952
- − HOA
- −$8,880
- − Depreciation
- −$6,545
- Taxable loss
- −$10,895
- Est. tax savings @ 24.0%
- +$2,615
- After-tax cash flow
- $-4,511/yr
For passive investors: Depreciation is non-cash, so a rental often shows a tax loss while cash-flowing — sheltering income. Rental losses are passive: they offset passive income freely, and up to $25,000/yr can offset ordinary (W-2) income if you actively participate and your MAGI is under $100k (phasing out to $0 by $150k); unused losses carry forward. On sale, claimed depreciation is recaptured at up to 25%, and gains may owe capital-gains tax (a 1031 exchange can defer both). Figures are a year-1 estimate at your 24.0% rate — not tax advice; consult a CPA.
Schools (NCES district)
- District
- Seattle Public Schools
- NCES district ID
- 5307710
- Math proficiency
- 64% ▼ -1.00%
- Reading proficiency
- 72% ▬ 0.00%
- Median HH income
- $68,695
- Composite
- 60.76/100
- National rank
- #1649
- State rank
- #19 of 291 in WA
Livability — Seattle
- Score
- 75/100
- State rank
- #166
- US rank
- #4033
Category grades
Schools grade is shown separately in the Schools card above.
Census & demographics
- Census place
- Seattle, WA
- County
- King County · 2,251,916 people
- City population
- 706,262
- Metro
- Seattle-Tacoma-Bellevue, WA
- Population (ZIP)
- 17,153
- Household income
- $128,882
- Rent vs Own
- Severe rent burden
- 1840.0
Population outlook (King County) Hauer SSP2
- Today (2025)
- 2,576,485 people
- By 2030
- 2,803,316 · +8.8%
- By 2040
- 3,255,921 · +26.4%
- By 2050
- 3,706,444 · +43.9%
- By 2075
- 4,746,063 · +84.2%
- By 2100
- 5,407,730 · +109.9%
Race, ethnicity, and origin ACS 2023
- Neighborhood character
- Diverse neighborhood (Simpson 0.64)
- Race & ethnicity
- White 48% Asian 35% Two or more races 7% Black 6% Hispanic / Latino 5%
- Hispanic origin (detail)
- Mexican 4%
- Common ancestry
- Italian 2% Slovak 2% Lithuanian 1%
- Foreign-born
- 38% · China, Canada, South Korea
- Languages at home
- 67% English-only · Other Indo-European 10% Chinese 8% Spanish 4%
Political lean MEDSL · King
- 2024 margin
- Solid D (+51.7) · D 74.2% · R 22.5% · Other 3.4%
- 2008→2024 swing
- +9.6pp toward D · 2008: 42.1pp · 2024: 51.7pp
- All cycles
- 2024: D+51.7 2020: D+52.7 2016: D+50.4 2012: D+39.9 2008: D+42.1
Not yet ingested
- Civics
- —
Market trends
- HPI YoY
- ▼ -0.52%
- Current HPI
- 193.0062
- Rent YoY
- ▼ -0.28%
- Metro
- Seattle-Tacoma-Bellevue, WA
- State GDP YoY
- ▲ 4.65%
- F500 in state
- 22
Industry mix (Fortune 500 HQ in WA)
| Industry | F500 HQs | Revenue |
|---|---|---|
| Retail | 2 | $269B |
|
||
| Technology / Retail | 1 | $638B |
|
||
| Technology | 1 | $245B |
|
||
| Telecommunications | 1 | $38B |
|
||
| Food / Beverage | 1 | $36B |
|
||
| Automotive / Trucks | 1 | $34B |
|
||
Price history
+455.6% since first listed5 events — show timeline
- 2026-05-12 Listed $225,000 NWMLS as Distributed by MLS Grid
- 1994-11-04 Sold (Public Records) $55,500 Public Records
- 1990-06-15 Sold (Public Records) $60,000 Public Records
- 1987-05-11 Sold (Public Records) $34,000 Public Records
- 1980-06-18 Sold (Public Records) $40,500 Public Records
Property tax history
+2.0%/yrLatest (2025): $2,237 · -10.1% YoY. Source: county tax records.
Cash-flow waterfall
monthlySold comps — $/sqft
last 12 mo · ≤1 miLoading sold comps…