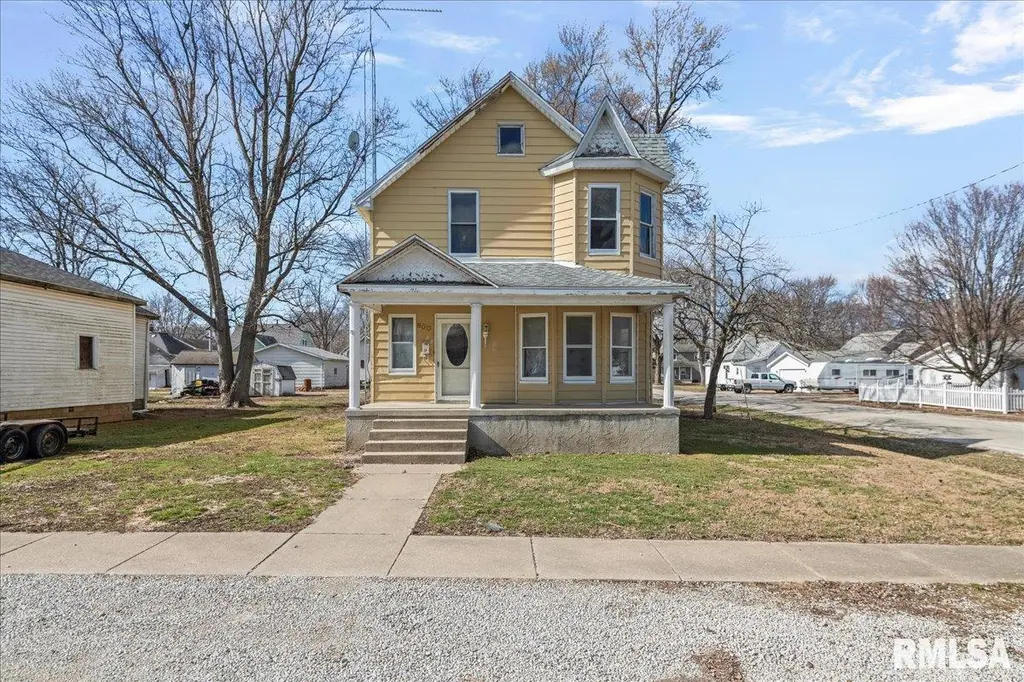
600 Sanford Ave · Nokomis, IL
Flood risk 1/10 · Minimal
- FEMA flood zone
- X
- Chance of flooding over 30 yrs
- 0.0%
- Est. flood insurance / yr
- $473 – $860
Fire risk 1/10 · Minimal
- Est. fire insurance / yr
- $804 – $1,492
Heat risk 4/10 · Minor
- Hot days now (above 104°F)
- 7 days/yr
- Hot days in 30 yrs
- 20 days/yr
Wind risk 2/10 · Minimal
- Chance of severe wind over 30 yrs
- 2.0%
Air-quality risk 4/10 · Minor
- Unhealthy air days now
- 4 days/yr
- Unhealthy air days in 30 yrs
- 6 days/yr
Risk factors via First Street. Map © Google.
Why this score? — see what drove the B+ grade
The composite is a weighted blend of 9 inputs, each scored 0–100. Each bar is that input's sub-score; the figure is the points it added to the 100-point composite (weight × sub-score).
- Cash flow +30.0/30.0
- 1% rule +10.0/10.0
- DSCR +10.0/10.0
- Appreciation +10.0/10.0
- ARV discount +5.4/15.0
- Livability +3.3/5.0
- Schools +2.7/10.0
- Rent growth +2.5/5.0
- Condition / age +2.5/5.0
$74,000
🖨 Deal sheet 📄 Offer letter ✓ Due diligence
Listing remarks MLS
Welcome home to this spacious and inviting two-story house! Offering 3 bedrooms plus a dedicated office that could easily serve as a 4th bedroom, and 1.5 bathrooms. Step inside through the welcoming foyer and immediately notice the warmth of beautiful hardwood floors that flow throughout the main living areas. The thoughtfully designed floor plan offers comfortable living spaces filled with natural light. Convenience is key with main floor laundry, making daily routines a breeze. The spacious living areas provide plenty of room to gather, while the two-story layout offers privacy and separation between living and sleeping spaces. Outside, enjoy the added benefits of a corner lot — extra yard space. The detached 2-car garage provides ample storage. Home is being sold as is.
Key facts
- Main floor laundry
- Dedicated office
- Corner lot
Tags
Neighborhood map
What this means for you Summary
Snapshot
- This is a 3-bed/1.5-bath single-family listed at $74k.
Deal economics
- At list price, monthly cash flow is $288 ($3k/yr) — positive.
- The deal already cash-flows at list — no discount required.
- Meets the 1% rule at list price ($1k rent vs $74k).
- Recommended offer: $67k (9.0% below list) — sets the bar for market timing.
Location & tenants
- Location reads 66/100 on livability (#547 in IL) — a middle-class / working-renter tenant base. Strengths: cost of living A+, housing A+, crime B; Watch: amenities F, commute F, health & safety F.
- Nokomis CUSD 22 (town): math 32% / reading 31% proficiency, ranked #241 of 620 in IL (top 39%) — families likely to look elsewhere, expect single-tenant / working-renter base with shorter leases.
- Market conditions: 16 active listings in the ZIP; 12 units permitted in Montgomery County in 2024 (0 in 5+ unit buildings).
Forward outlook
- In year one you build about $8k of equity ($512 loan paydown + $7k appreciation (10.0% local appreciation)).
- Montgomery County population projected at -20% by 2050 — secular population decline; favor cash flow + early exit over multi-decade hold.
- At projected returns (10.0% appreciation + 3.0% rent growth), your $21k cash investment doubles in ~2 years — after that, you're playing with house money.
- By year 5, paydown + projected appreciation supports a ~$37k cash-out refi (75% LTV) — recoverable capital for the next deal without selling this one.
Negotiation context
- It's been on market 115 days — a 9% lower offer ($67k) is reasonable based on typical stale-listing flexibility.
- Current owner paid $62k; 18% above their basis — modest negotiation headroom, anchor on the comps not their cost.
Risks & watch-outs
- Watch-outs: property tax is 3.4% of price; built in 1920 — expect roof / HVAC / electrical / plumbing capex.
Questions for the listing agent
- It's been on market 115 days. Have you received any prior offers? Is the seller open to a 9% concession, seller financing, or rate buy-down credit?
- Built in 1920 — when were the roof, HVAC, electrical panel, plumbing, and water heater last replaced?
- Property tax is high relative to price — has the assessment been appealed recently, and will the sale trigger a re-assessment?
- Why hasn't it sold? Are there any deal-killer items the seller is aware of (foundation, flood, title, zoning, code violations)?
- Is there a deadline driving the sale (1031 exchange, divorce, estate, relocation)? That informs how much negotiation room exists.
- What's the average days-on-market for RENTAL listings here right now (not sales)? A rising rental-DOM trend means longer vacancies and softer asking-rent achievability than the comps imply.
- What's the recent tenant-quality profile in this submarket — average credit score on applications, eviction rate, late-payment / NSF rate, and stable-employment percentage? A property-management company in the area should have these aggregated.
- How much new for-sale + rental construction is in the pipeline within 1–3 miles? Heavy new supply typically softens prices + rents 12–24 months out; constrained supply supports both.
Investment metrics
- 1% rule
- 1.56% ✓
- Cap rate
- 10.96%
- Cash-on-cash
- 16.68%
- DSCR
- 1.74
- GRM
- 5.3
CMA / ARV
- ARV (median comp)
- $70,662
- List price
- $74,000
- Delta
- 4.72%
- Verdict
- FAIR
- Comps
- 20 within 1.0 mi
Show comp detail 12 sales within ~0.75 mi
| Address | Dist | Beds/Ba | Sqft | Sold | Price | $/sf | Match |
|---|---|---|---|---|---|---|---|
| 603 Capps Ave | 0.18mi | 3/1.0 | 1,352 (-6%) | 12mo | $82,500 | $61 | 70 |
| 519 S Pine St | 0.05mi | 4/2.0 (+1) | 1,266 (-12%) | 5mo | $125,000 | $99 | 66 |
| 221 S Blue Ave | 0.50mi | 3/2.0 | 1,458 (+1%) | 10mo | $155,000 | $106 | 64 |
| 304 Pine St | 0.21mi | 4/1.0 (+1) | 1,417 (-2%) | 20mo | $59,900 | $42 | 64 |
| 518 Stevens St | 0.41mi | 3/2.0 | 1,350 (-6%) | 14mo | $295,000 | $219 | 57 |
| 405 Griffin St | 0.61mi | 3/2.0 | 1,542 (+7%) | 2mo | $135,000 | $88 | 56 |
| 123 S Oak St | 0.40mi | 3/2.0 | 1,580 (+10%) | 10mo | $149,500 | $95 | 55 |
| 301 W South St | 0.16mi | 2/1.5 (-1) | 1,573 (+9%) | 23mo | $145,000 | $92 | 53 |
| 927 E Union St | 0.65mi | 3/1.0 | 1,511 (+5%) | 10mo | $35,000 | $23 | 51 |
| 523 W Franklin St | 0.57mi | 3/1.5 | 1,272 (-12%) | 16mo | $185,000 | $145 | 41 |
| 323 N Pine St | 0.65mi | 3/1.0 | 1,285 (-11%) | 14mo | $95,000 | $74 | 39 |
| 317 East St | 0.65mi | 3/2.0 | 1,612 (+12%) | 17mo | $245,000 | $152 | 33 |
Match score weights: distance 35% · size 25% · config 20% · recency 20%. Top-matched comps best support the ARV.
Projected returns pro-forma
10.0% appreciation · 3.0% rent growth · sell at horizon
- IRR
- 36.7%
- Equity multiple
- 3.83×
- Total profit
- $58,734
- Equity at exit
- $66,665
- IRR
- 31.6%
- Equity multiple
- 8.66×
- Total profit
- $158,712
- Equity at exit
- $143,766
Cash invested: $20,720 (down + closing). Projections, not guarantees.
Landlord ↔ Tenant lean methodology
- Overall (STATE)
- 43 Moderately Tenant-Leaning
- State Illinois
- 43 Moderately Tenant-Leaning · D+7
- County
- — inherits STATE
- City
- — inherits STATE
ZIP-level market 62075
- Home prices YoY
- 15.1%
- Active inventory
- 16
- Price-to-rent
- 5.3×
Monthly cashflow live
- Estimated rent
- $1,157 medium interval (Pro) →
- Mortgage (P&I)
- −$388
- Tax from tax record
- −$207 /mo · $2,489/yr
- Insurance
- −$31
- HOA
- −$0
- Vacancy / Maint / Mgmt
- −$243
- Net cashflow
- $288
Break-even live
UW: 25.0% down · 7.5% · 30yr · 1.5% tax · 5.0% vac · 8.0% maint · 8.0% mgmt
Financing live
Cash to close
- Down payment
- $18,500
- Closing costs
- $2,220
- Reserves months
- —
- Total cash needed
- —
Loan-product check · same deal, 3 products live
Conventional
25% down · 7.5% · 30yr
- Down + closing
- —
- Monthly P&I
- —
- Monthly cashflow
- —
- DSCR
- —
- Eligible?
- —
Personal DTI + credit; lowest rate.
DSCR
20% down · 8.5% · 30yr
- Down + closing
- —
- Monthly P&I
- —
- Monthly cashflow
- —
- DSCR
- —
- Eligible?
- —
No personal income docs; deal must DSCR.
Hard money
10% down · 12.0% · 12mo
- Down + closing
- —
- Monthly P&I
- —
- Monthly cashflow
- —
- DSCR
- —
- Eligible?
- —
Short-term bridge; refi at stabilization.
Listing history 18 events
-
2026-06-18days on market $74,000 Active 115 DOM
-
2026-06-17days on market $74,000 Active 114 DOM
-
2026-06-16days on market $74,000 Active 113 DOM
-
2026-06-15days on market $74,000 Active 112 DOM
-
2026-06-13days on market $74,000 Active 110 DOM
-
2026-06-12days on market $74,000 Active 109 DOM
-
2026-06-09days on market $74,000 Active 106 DOM
-
2026-06-08days on market $74,000 Active 105 DOM
-
2026-06-07days on market $74,000 Active 104 DOM
-
2026-06-07days on market $74,000 Active 103 DOM
-
2026-06-04days on market $74,000 Active 100 DOM
-
2026-06-02days on market $74,000 Active 99 DOM
-
2026-06-01days on market $74,000 Active 98 DOM
-
2026-05-31days on market $74,000 Active 97 DOM
-
2026-05-31days on market $74,000 Active 96 DOM
-
2026-04-07price $79,999 789-char remark
Show marketing remark (789 chars)
Welcome home to this spacious and inviting two-story house! Offering 3 bedrooms plus a dedicated office that could easily serve as a 4th bedroom, and 1.5 bathrooms. Step inside through the welcoming foyer and immediately notice the warmth of beautiful hardwood floors that flow throughout the main living areas. The thoughtfully designed floor plan offers comfortable living spaces filled with natural light. Convenience is key with main floor laundry, making daily routines a breeze. The spacious living areas provide plenty of room to gather, while the two-story layout offers privacy and separation between living and sleeping spaces. Outside, enjoy the added benefits of a corner lot — extra yard space. The detached 2-car garage provides ample storage. Home is being sold as is.
-
2026-02-23$84,000 Active 789-char remark
Show marketing remark (789 chars)
Welcome home to this spacious and inviting two-story house! Offering 3 bedrooms plus a dedicated office that could easily serve as a 4th bedroom, and 1.5 bathrooms. Step inside through the welcoming foyer and immediately notice the warmth of beautiful hardwood floors that flow throughout the main living areas. The thoughtfully designed floor plan offers comfortable living spaces filled with natural light. Convenience is key with main floor laundry, making daily routines a breeze. The spacious living areas provide plenty of room to gather, while the two-story layout offers privacy and separation between living and sleeping spaces. Outside, enjoy the added benefits of a corner lot — extra yard space. The detached 2-car garage provides ample storage. Home is being sold as is.
-
2001-11-01soldstatus $62,500
ⓘ Source: listings_history table (triggers on properties + properties_extension) + one-shot
backfill from property_details.listing_events for pre-trigger history.
Tax reassessment forecast IL · Partial reset (capped growth)
- Current annual tax
- $2,489 · $207/mo
- Projected year-2 tax
- $2,489 · $207/mo
- Expected delta
- $0/yr ($0/mo · 0.0%)
ⓘ Screening estimate from a state-policy table — verify with the county assessor before closing.
Climate risk First Street
- Flood 1/10 Low FEMA zone X · 0% chance over 30 yrs
- Wildfire 1/10 Low
- Heat 4/10 Moderate 7 d/yr ≥104°F today · 20 d/yr by 30 yrs out
- Wind 2/10 Low 2% chance of damaging wind over 30 yrs
- Air quality 4/10 Moderate 4 unhealthy d/yr today · 6 by 30 yrs out
Nearby sold comps map
Loading sold comps map…
Walkable amenities ~0.75 mi
Loading nearby amenities…
Taxation est. · year 1
- Rental income
- $13,889
- − Mortgage interest
- −$4,145
- − Property taxes
- −$2,489
- − Insurance
- −$370
- − Repairs & maintenance
- −$1,111
- − Management
- −$1,111
- − Depreciation
- −$2,153
- Taxable income
- $2,509
- Est. tax owed @ 24.0%
- −$602
- After-tax cash flow
- $2,854/yr
For passive investors: Depreciation is non-cash, so a rental often shows a tax loss while cash-flowing — sheltering income. Rental losses are passive: they offset passive income freely, and up to $25,000/yr can offset ordinary (W-2) income if you actively participate and your MAGI is under $100k (phasing out to $0 by $150k); unused losses carry forward. On sale, claimed depreciation is recaptured at up to 25%, and gains may owe capital-gains tax (a 1031 exchange can defer both). Figures are a year-1 estimate at your 24.0% rate — not tax advice; consult a CPA.
Schools (NCES district)
- District
- Nokomis CUSD 22
- NCES district ID
- 1728560
- Math proficiency
- 32% ▼ -6.00%
- Reading proficiency
- 31% ▼ -17.00%
- Median HH income
- $42,673
- Composite
- 26.76/100
- National rank
- #7132
- State rank
- #241 of 620 in IL
Livability — Nokomis
- Score
- 66/100
- State rank
- #547
- US rank
- #11441
Category grades
Schools grade is shown separately in the Schools card above.
Census & demographics
- Census place
- Nokomis, IL
- City population
- 3,180
- Population (ZIP)
- 3,180
Population outlook (Montgomery County) Hauer SSP2
- Today (2025)
- 27,471 people
- By 2030
- 26,410 · -3.9%
- By 2040
- 24,233 · -11.8%
- By 2050
- 21,948 · -20.1%
- By 2075
- 16,686 · -39.3%
- By 2100
- 11,369 · -58.6%
Race, ethnicity, and origin ACS 2023
- Neighborhood character
- Predominantly White (93%)
- Race & ethnicity
- White 93% Asian 4% Two or more races 2% Hispanic / Latino 1%
- Common ancestry
- Romanian 1% Iranian 1% Slovak 1%
- Foreign-born
- 2% · China
- Languages at home
- 96% English-only · Other Indo-European 2% German/W. Germanic 1%
Political lean MEDSL · Montgomery
- 2024 margin
- Solid R (+44.0) · D 27.1% · R 71.1% · Other 1.8%
- 2008→2024 swing
- -46.7pp toward R · 2008: 2.6pp · 2024: -44.0pp
- All cycles
- 2024: R+44.0 2020: R+41.0 2016: R+40.0 2012: R+14.2 2008: D+2.6
Not yet ingested
- Civics
- —
Market trends
- HPI YoY
- ▲ 25.27%
- Current HPI
- 192.84
- Rent YoY
- —
- Metro
- —
- State GDP YoY
- ▲ 1.59%
- F500 in state
- 60
Industry mix (Fortune 500 HQ in IL)
| Industry | F500 HQs | Revenue |
|---|---|---|
| Insurance | 4 | $201B |
|
||
| Consumer Goods | 4 | $87B |
|
||
| Industrial Machinery | 3 | $64B |
|
||
| Healthcare | 2 | $55B |
|
||
| Retail / Pharmacy | 1 | $148B |
|
||
| Agriculture / Food | 1 | $86B |
|
||
Price history
+28.0% since first listed3 events — show timeline
- 2026-04-07 Price Changed $79,999 RMLSA as Distributed by MLS Grid
- 2026-02-23 Listed $84,000 RMLSA as Distributed by MLS Grid
- 2001-11-01 Sold (Public Records) $62,500 Public Records
Property tax history
+4.1%/yrLatest (2024): $2,489 · +5.6% YoY. Source: county tax records.
Cash-flow waterfall
monthlySold comps — $/sqft
last 12 mo · ≤1 miLoading sold comps…