 Triplex
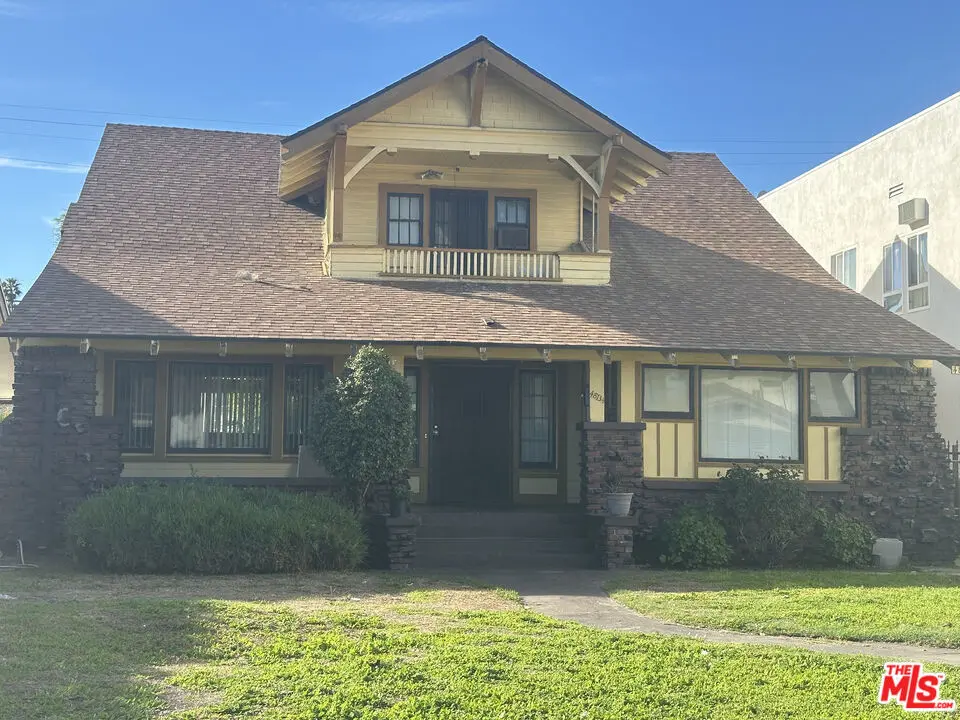
4811 S Gramercy Pl · Los Angeles, CA
Flood risk 1/10 · Minimal
- FEMA flood zone
- X (unshaded)
- Chance of flooding over 30 yrs
- 0.0%
- Est. flood insurance / yr
- $507 – $1,088
Fire risk 1/10 · Minimal
- Est. fire insurance / yr
- $659 – $1,223
Heat risk 6/10 · Moderate
- Hot days now (above 87°F)
- 7 days/yr
- Hot days in 30 yrs
- 21 days/yr
Wind risk 1/10 · Minimal
- Chance of severe wind over 30 yrs
- —
Air-quality risk 5/10 · Moderate
- Unhealthy air days now
- 7 days/yr
- Unhealthy air days in 30 yrs
- 7 days/yr
Risk factors via First Street. Map © Google.
Why this score? — see what drove the C- grade
The composite is a weighted blend of 9 inputs, each scored 0–100. Each bar is that input's sub-score; the figure is the points it added to the 100-point composite (weight × sub-score).
- Cash flow +16.1/30.0
- ARV discount +15.0/15.0
- DSCR +5.0/10.0
- Rent growth +5.0/5.0
- 1% rule +4.4/10.0
- Schools +3.6/10.0
- Livability +3.4/5.0
- Condition / age +2.5/5.0
- Appreciation +0.0/10.0
$899,999
🖨 Deal sheet 📄 Offer letter ✓ Due diligence
Multi-family units
County records classify this as Multi-Family (2-4 Unit). Listing-text estimate: 3 units. confirmed
Listing remarks MLS
MAJOR PRICE IMPROVEMENT STRATEGIC VALUE-ADD OPPORTUNITY: Unlock substantial equity with this high-upside 1911 Craftsman triplex, spanning approximately 4,308 sq ft of living area on a prime 6,502 sq ft LAR4-zoned lot. This transparent, no-frills probate sale is priced to move, specifically accounting for the cosmetic updates needed to capture a healthy spread between acquisition and market value. Offering the rare advantage of flexible occupancy, it can be delivered vacant, investors can bypass tenant buyouts and move straight to a total rental reset or renovation at 2026 market rates. With its classic architectural "bones, " multiple structures, and high-density development potential per the LAR4 zoning (Buyer to verify), this property is a cornerstone asset positioned near major transit and employment corridors. Sold strictly as-is and subject to court confirmation, this is a clear-cut opportunity for a professional investor to reposition a large-scale multi-unit asset in a supply-constrained neighborhood; the estate is motivated and ready to review serious offers.
Key facts
- Zoned lar4
- Multi unit property
- Craftsman style
Tags
Neighborhood map
What this means for you Summary
Snapshot
- This is a 3 × 2-bed/0.7-bath units multifamily listed at $900k.
Deal economics
- At list price, monthly cash flow is $457 ($5k/yr) — positive. Per door: $152/mo.
- The deal already cash-flows at list — no discount required.
- To meet the 1% rule (rent ≥ 1% of price), the offer needs to be $848k (5.7% below list).
- Recommended offer: $819k (9.0% below list) — sets the bar for market timing.
- Cap rate 6.9% vs local median 2.1% in Los Angeles — top-decile yield for the area; either an underpriced asset or a hidden risk that comps aren't pricing in. Stress-test before assuming the spread holds.
Location & tenants
- Location reads 68/100 on livability (#273 in CA) — a middle-class / working-renter tenant base. Strengths: amenities A+, commute A+, employment B; Watch: health & safety C-, schools D+, crime F.
- Los Angeles Unified (urban): math 29% / reading 54% proficiency, ranked #223 of 517 in CA (top 43%) — families likely to look elsewhere, expect single-tenant / working-renter base with shorter leases; 67% free/reduced lunch — lower-income household profile, screen leases tightly.
- Market conditions: Rents rising fast (+14.5%/yr); 86 active listings in the ZIP; 4 comparable units currently listed for rent nearby; rentals lingering (median 44d on market — plan ~5-8 weeks vacancy on turnover, expect pricing pressure); 75% of comp listings sitting > 30 days — soft ceiling on asking rent; 19,697 units permitted in Los Angeles County in 2024 (9,426 in 5+ unit buildings).
- At $8,484/mo this rent would consume 150% of the median local household income ($68k/yr) (locally 1890% of renters already pay >50% of income on rent) — very limited rent-growth headroom before tenants either downsize or default.
Forward outlook
- Local home prices are declining (-3.0%/yr); year-one equity from $6k of loan paydown is wiped out by about $27k of value loss. Plan a longer hold.
- Los Angeles County population projected at +9% by 2050 — modest demand growth; plan on rents tracking national, not racing it.
Negotiation context
- It's been on market 118 days — a 9% lower offer ($819k) is reasonable based on typical stale-listing flexibility.
- 2 sale attempts; this cycle's ask has dropped $400k (31%) from the opening price — seller is motivated, your offer sets the floor, not the list.
Risks & watch-outs
- Watch-outs: built in 1911 — expect roof / HVAC / electrical / plumbing capex.
- Climate carrying-cost: extreme-heat days projected 7→21/yr by 2055 (HVAC capex compounding) — expect insurance premiums to compound above CPI over the hold.
Questions for the listing agent
- It's been on market 118 days. Have you received any prior offers? Is the seller open to a 9% concession, seller financing, or rate buy-down credit?
- Can we see the unit-by-unit rent roll, current vacancy, and any below-market leases? What's the average tenancy length?
- What capital expenditures (roof, boiler, parking lot, exteriors) have been made in the last 5 years, and what's planned in the next 2?
- Built in 1911 — when were the roof, HVAC, electrical panel, plumbing, and water heater last replaced?
- Why hasn't it sold? Are there any deal-killer items the seller is aware of (foundation, flood, title, zoning, code violations)?
- Is there a deadline driving the sale (1031 exchange, divorce, estate, relocation)? That informs how much negotiation room exists.
- Schools are D-rated, which usually means shorter tenancies and higher turnover. Who's the typical renter profile here, and what's been the actual vacancy rate?
- Crime grade is F in this area — have there been break-ins, vandalism, or insurance claims at this property in the last 3 years? What carrier currently insures it and at what premium?
- What's the average days-on-market for RENTAL listings here right now (not sales)? A rising rental-DOM trend means longer vacancies and softer asking-rent achievability than the comps imply.
- What's the recent tenant-quality profile in this submarket — average credit score on applications, eviction rate, late-payment / NSF rate, and stable-employment percentage? A property-management company in the area should have these aggregated.
- How much new apartment / multifamily construction is in the pipeline within 1–3 miles? Heavy new supply (>2% of stock underway) typically softens rents 12–24 months out; light construction supports rent growth.
Investment metrics
- 1% rule
- 0.94% ✗
- Cap rate
- 6.90%
- Cash-on-cash
- 2.18%
- DSCR
- 1.10
- GRM
- 8.8
CMA / ARV
- ARV (median comp)
- $1,123,681
- List price
- $899,999
- Delta
- -19.91%
- Verdict
- UNDERPRICED
- Comps
- 20 within 1.0 mi
Show comp detail 1 sale within ~0.75 mi
| Address | Dist | Beds/Ba | Sqft | Sold | Price | $/sf | Match |
|---|---|---|---|---|---|---|---|
| 1549 W 54th St | 0.71mi | 4/4.0 | 3,478 (-8%) | 16mo | $865,000 | $249 | 27 |
Match score weights: distance 35% · size 25% · config 20% · recency 20%. Top-matched comps best support the ARV.
Projected returns pro-forma
-3.0% appreciation · 8.0% rent growth · sell at horizon
- IRR
- -7.3%
- Equity multiple
- 0.72×
- Total profit
- $-71,748
- Equity at exit
- $134,193
- IRR
- 7.7%
- Equity multiple
- 1.71×
- Total profit
- $179,660
- Equity at exit
- $77,815
Cash invested: $252,000 (down + closing). Projections, not guarantees.
Landlord ↔ Tenant lean methodology
- Overall (CITY)
- 0 Strongly Tenant-Friendly
- State California
- 18 Strongly Tenant-Friendly · D+13
- County
- — inherits STATE
- City Los Angeles
- 0 Strongly Tenant-Friendly · D+22
ZIP-level market 90062
- Rents YoY
- 14.5%
- Active inventory
- 86
- Price-to-rent
- 26.5×
Monthly cashflow live
- Estimated rent
- $8,484 high interval (Pro) →
- Mortgage (P&I)
- −$4,720
- Tax from tax record
- −$1,151 /mo · $13,807/yr
- Insurance
- −$375
- HOA
- −$0
- Vacancy / Maint / Mgmt
- −$1,782
- Net cashflow
- $457
Break-even live
3-unit breakdown (identical units grouped — click to expand)
| Units | Beds | Baths | Est. rent |
|---|---|---|---|
| 3× units | 2 | 0.7 | $8,484 |
| #1 | 2 | 0.7 | $2,828 |
| #2 | 2 | 0.7 | $2,828 |
| #3 | 2 | 0.7 | $2,828 |
| Total (3 units) | $8,484 | ||
UW: 25.0% down · 7.5% · 30yr · 1.5% tax · 5.0% vac · 8.0% maint · 8.0% mgmt
Financing live
Cash to close
- Down payment
- $225,000
- Closing costs
- $27,000
- Reserves months
- —
- Total cash needed
- —
Loan-product check · same deal, 3 products live
Conventional
25% down · 7.5% · 30yr
- Down + closing
- —
- Monthly P&I
- —
- Monthly cashflow
- —
- DSCR
- —
- Eligible?
- —
Personal DTI + credit; lowest rate.
DSCR
20% down · 8.5% · 30yr
- Down + closing
- —
- Monthly P&I
- —
- Monthly cashflow
- —
- DSCR
- —
- Eligible?
- —
No personal income docs; deal must DSCR.
Hard money
10% down · 12.0% · 12mo
- Down + closing
- —
- Monthly P&I
- —
- Monthly cashflow
- —
- DSCR
- —
- Eligible?
- —
Short-term bridge; refi at stabilization.
Rent comps 4 comps
| Address | Beds | Baths | Sqft | Rent | $/sqft | DOM | Units | Dist |
|---|---|---|---|---|---|---|---|---|
| 4284 S Hobart Blvd Los Angeles, CA | 3.0 | 1.0 | 3040 | $3,300 | $1.09 | 43d | 1 | 0.51mi |
| 4240 Denker Ave Los Angeles, CA | 4.0 | 3.0 | 2684 | $3,025 | $1.13 | 7d | 1 | 0.71mi |
| 5357 S Victoria Ave Los Angeles, CA | 4.0 | 3.5 | 3925 | $7,950 | $2.03 | 43d | 1 | 1.16mi |
| 3659 Aureola Blvd View Park, CA | 5.0 | 4.5 | 4662 | $9,700 | $2.08 | 43d | 1 | 1.39mi |
Listing history 18 events
-
2026-06-18days on market $899,999 Active 118 DOM
-
2026-06-17days on market $899,999 Active 117 DOM
-
2026-06-16days on market $899,999 Active 116 DOM
-
2026-06-15days on market $899,999 Active 115 DOM
-
2026-06-13days on market $899,999 Active 113 DOM
-
2026-06-09days on market $899,999 Active 109 DOM
-
2026-06-08days on market $899,999 Active 108 DOM
-
2026-06-07days on market $899,999 Active 107 DOM
-
2026-06-04days on market $899,999 Active 104 DOM
-
2026-06-03days on market $899,999 Active 103 DOM
-
2026-06-02days on market $899,999 Active 102 DOM
-
2026-06-01days on market $899,999 Active 101 DOM
-
2026-05-31days on market $899,999 Active 100 DOM
-
2026-04-28price $899,999 1094-char remark
Show marketing remark (1094 chars)
MAJOR PRICE IMPROVEMENT STRATEGIC VALUE-ADD OPPORTUNITY: Unlock substantial equity with this high-upside 1911 Craftsman triplex, spanning approximately 4,308 sq ft of living area on a prime 6,502 sq ft LAR4-zoned lot. This transparent, no-frills probate sale is priced to move, specifically accounting for the cosmetic updates needed to capture a healthy spread between acquisition and market value. Offering the rare advantage of flexible occupancy, it can be delivered vacant, investors can bypass tenant buyouts and move straight to a total rental reset or renovation at 2026 market rates. With its classic architectural "bones, " multiple structures, and high-density development potential per the LAR4 zoning (Buyer to verify), this property is a cornerstone asset positioned near major transit and employment corridors. Sold strictly as-is and subject to court confirmation, this is a clear-cut opportunity for a professional investor to reposition a large-scale multi-unit asset in a supply-constrained neighborhood; the estate is motivated and ready to review serious offers.
-
2026-03-27price $999,900 1094-char remark
Show marketing remark (1094 chars)
MAJOR PRICE IMPROVEMENT STRATEGIC VALUE-ADD OPPORTUNITY: Unlock substantial equity with this high-upside 1911 Craftsman triplex, spanning approximately 4,308 sq ft of living area on a prime 6,502 sq ft LAR4-zoned lot. This transparent, no-frills probate sale is priced to move, specifically accounting for the cosmetic updates needed to capture a healthy spread between acquisition and market value. Offering the rare advantage of flexible occupancy, it can be delivered vacant, investors can bypass tenant buyouts and move straight to a total rental reset or renovation at 2026 market rates. With its classic architectural "bones, " multiple structures, and high-density development potential per the LAR4 zoning (Buyer to verify), this property is a cornerstone asset positioned near major transit and employment corridors. Sold strictly as-is and subject to court confirmation, this is a clear-cut opportunity for a professional investor to reposition a large-scale multi-unit asset in a supply-constrained neighborhood; the estate is motivated and ready to review serious offers.
-
2026-02-18historical
-
2026-01-05$1,300,000 Active
-
2025-12-22$1,099,000 Active 1094-char remark
Show marketing remark (1094 chars)
MAJOR PRICE IMPROVEMENT STRATEGIC VALUE-ADD OPPORTUNITY: Unlock substantial equity with this high-upside 1911 Craftsman triplex, spanning approximately 4,308 sq ft of living area on a prime 6,502 sq ft LAR4-zoned lot. This transparent, no-frills probate sale is priced to move, specifically accounting for the cosmetic updates needed to capture a healthy spread between acquisition and market value. Offering the rare advantage of flexible occupancy, it can be delivered vacant, investors can bypass tenant buyouts and move straight to a total rental reset or renovation at 2026 market rates. With its classic architectural "bones, " multiple structures, and high-density development potential per the LAR4 zoning (Buyer to verify), this property is a cornerstone asset positioned near major transit and employment corridors. Sold strictly as-is and subject to court confirmation, this is a clear-cut opportunity for a professional investor to reposition a large-scale multi-unit asset in a supply-constrained neighborhood; the estate is motivated and ready to review serious offers.
ⓘ Source: listings_history table (triggers on properties + properties_extension) + one-shot
backfill from property_details.listing_events for pre-trigger history.
Tax reassessment forecast CA · Resets to sale price
- Current annual tax
- $13,807 · $1,151/mo
- Projected year-2 tax
- $13,807 · $1,151/mo
- Expected delta
- $0/yr ($0/mo · 0.0%)
ⓘ Screening estimate from a state-policy table — verify with the county assessor before closing.
Climate risk First Street
- Flood 1/10 Low FEMA zone X (unshaded) · 0% chance over 30 yrs
- Wildfire 1/10 Low
- Heat 6/10 Major 7 d/yr ≥87°F today · 21 d/yr by 30 yrs out
- Wind 1/10 Low
- Air quality 5/10 Major 7 unhealthy d/yr today · 7 by 30 yrs out
Nearby sold comps map
Loading sold comps map…
Walkable amenities ~0.75 mi
Loading nearby amenities…
Taxation est. · year 1
- Rental income
- $101,808
- − Mortgage interest
- −$50,414
- − Property taxes
- −$13,807
- − Insurance
- −$4,500
- − Repairs & maintenance
- −$8,145
- − Management
- −$8,145
- − Depreciation
- −$26,182
- Taxable loss
- −$9,384
- Est. tax savings @ 24.0%
- +$2,252
- After-tax cash flow
- $7,737/yr
For passive investors: Depreciation is non-cash, so a rental often shows a tax loss while cash-flowing — sheltering income. Rental losses are passive: they offset passive income freely, and up to $25,000/yr can offset ordinary (W-2) income if you actively participate and your MAGI is under $100k (phasing out to $0 by $150k); unused losses carry forward. On sale, claimed depreciation is recaptured at up to 25%, and gains may owe capital-gains tax (a 1031 exchange can defer both). Figures are a year-1 estimate at your 24.0% rate — not tax advice; consult a CPA.
Schools (NCES district)
- District
- Los Angeles Unified
- NCES district ID
- 0622710
- Math proficiency
- 29% ▼ -4.00%
- Reading proficiency
- 54% ▲ 10.00%
- Median HH income
- $50,403
- Composite
- 35.67/100
- National rank
- #4875
- State rank
- #223 of 517 in CA
Livability — Los Angeles
- Score
- 68/100
- State rank
- #273
- US rank
- #9237
Category grades
Schools grade is shown separately in the Schools card above.
Census & demographics
- Census place
- Los Angeles, CA
- County
- Los Angeles County · 9,444,647 people
- City population
- 3,838,149
- Metro
- Los Angeles-Long Beach-Anaheim, CA
- Population (ZIP)
- 32,715
- Household income
- $67,701
- Rent vs Own
- Severe rent burden
- 1890.0
Population outlook (Los Angeles County) Hauer SSP2
- Today (2025)
- 10,940,515 people
- By 2030
- 11,256,481 · +2.9%
- By 2040
- 11,729,929 · +7.2%
- By 2050
- 11,948,407 · +9.2%
- By 2075
- 11,818,114 · +8.0%
- By 2100
- 10,842,928 · -0.9%
Race, ethnicity, and origin ACS 2023
- Neighborhood character
- Majority Hispanic (63%)
- Race & ethnicity
- Hispanic / Latino 63% Black 26% Two or more races 15% White 3% Asian 2% Native American 2%
- Hispanic origin (detail)
- Mexican 29%
- Common ancestry
- British 3%
- Foreign-born
- 38% · Canada, South Korea, Guatemala
- Languages at home
- 36% English-only · Spanish 61% Korean 1% French/Haitian/Cajun 1%
Political lean MEDSL · Los Angeles
- 2024 margin
- Solid D (+32.9) · D 64.8% · R 31.9% · Other 3.3%
- 2008→2024 swing
- -7.4pp toward R · 2008: 40.4pp · 2024: 32.9pp
- All cycles
- 2024: D+32.9 2020: D+44.2 2016: D+48.0 2012: D+40.0 2008: D+40.4
Not yet ingested
- Civics
- —
Market trends
- HPI YoY
- ▼ -670.48%
- Current HPI
- 500.9289
- Rent YoY
- ▲ 14.48%
- Metro
- Los Angeles-Long Beach-Anaheim, CA
- State GDP YoY
- ▲ 3.21%
- F500 in state
- 116
Industry mix (Fortune 500 HQ in CA)
| Industry | F500 HQs | Revenue |
|---|---|---|
| Technology | 27 | $1,492B |
|
||
| Financial Services | 3 | $174B |
|
||
| Retail | 3 | $44B |
|
||
| Insurance | 3 | $26B |
|
||
| Media / Entertainment | 2 | $115B |
|
||
| Pharmaceuticals / Biotech | 2 | $62B |
|
||
Price history
-18.1% since first listed5 events — show timeline
- 2026-04-28 Price Changed $899,999 TheMLS
- 2026-03-27 Price Changed $999,900 TheMLS
- 2026-02-18 Listing Removed — CRMLS
- 2026-01-05 Listed $1,300,000 CRMLS
- 2025-12-22 Listed $1,099,000 TheMLS
Property tax history
+17.5%/yrLatest (2025): $13,807 · +1.4% YoY. Source: county tax records.
Cash-flow waterfall
monthlySold comps — $/sqft
last 12 mo · ≤1 miLoading sold comps…