16657 E Forrestal · Conroe, TX
Flood risk No data
- FEMA flood zone
- —
- Chance of flooding over 30 yrs
- —
- Est. flood insurance / yr
- —
Fire risk No data
- Est. fire insurance / yr
- —
Heat risk No data
- Hot days now (above threshold)
- —
- Hot days in 30 yrs
- —
Wind risk No data
- Chance of severe wind over 30 yrs
- —
Air-quality risk No data
- Unhealthy air days now
- —
- Unhealthy air days in 30 yrs
- —
Risk factors via First Street. Map © Google.
Why this score? — see what drove the D+ grade
The composite is a weighted blend of 9 inputs, each scored 0–100. Each bar is that input's sub-score; the figure is the points it added to the 100-point composite (weight × sub-score).
- Cash flow +15.1/30.0
- ARV discount +7.5/15.0
- Schools +5.4/10.0
- DSCR +4.6/10.0
- 1% rule +4.4/10.0
- Livability +3.7/5.0
- Rent growth +2.6/5.0
- Condition / age +2.5/5.0
- Appreciation +0.0/10.0
$165,000
🖨 Deal sheet 📄 Offer letter ✓ Due diligence
Listing remarks MLS
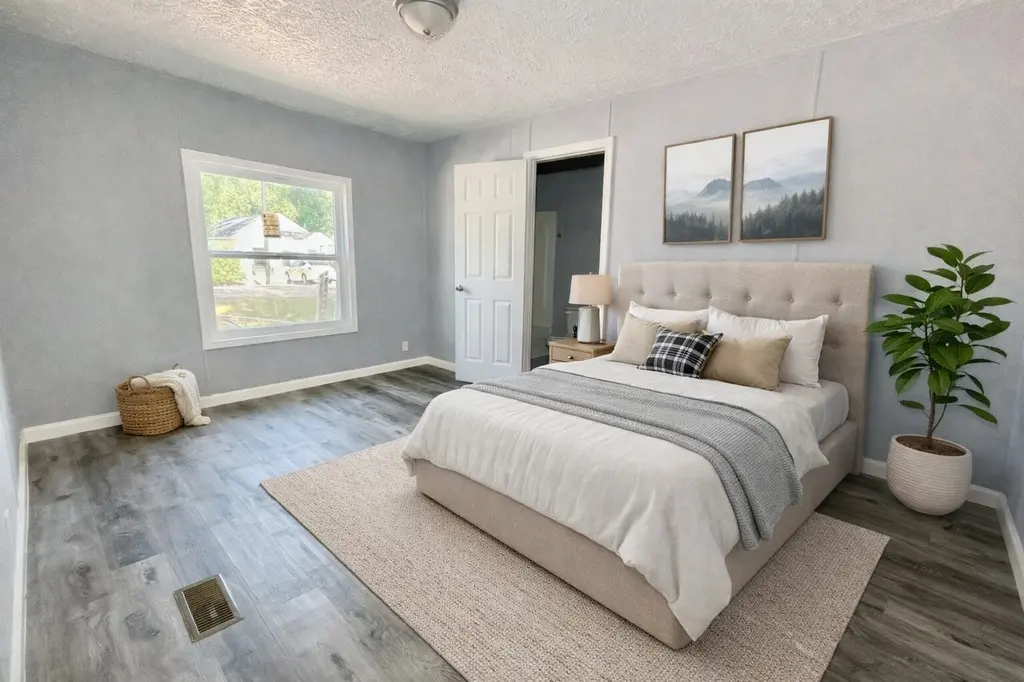
Discover the charm of this delightful updated 2-bedroom, 2-bath manufactured home located in the peaceful community of Lake Conroe Village, situated on top of three lots, just minutes from Montgomery, TX. This inviting residence offers a comfortable and practical layout, perfect for those seeking to be near the lake. A new shed in the backyard is an excellent addition to the lot, which can turn into a storage, a tiny home, or a functional workshop.
Key facts
- Three lots
- Peaceful community
- Near the lake
Tags
Neighborhood map
What this means for you Summary
Snapshot
- This is a 2-bed/2.0-bath manufactured listed at $165k.
Deal economics
- At list price, monthly cash flow is $54 ($650/yr) — positive.
- The deal already cash-flows at list — no discount required.
- To meet the 1% rule (rent ≥ 1% of price), the offer needs to be $155k (6.1% below list).
- Recommended offer: $150k (9.0% below list) — sets the bar for market timing.
- Cap rate 6.7% vs local median 3.1% in Conroe — top-decile yield for the area; either an underpriced asset or a hidden risk that comps aren't pricing in. Stress-test before assuming the spread holds.
Location & tenants
- Location reads 74/100 on livability (#169 in TX, #4,447 nationally) — a middle-class / working-renter tenant base. Strengths: cost of living A+, housing A+, amenities B; Watch: schools D+, commute F, health & safety F.
- Montgomery ISD (rural): math 63% / reading 57% proficiency, ranked #49 of 826 in TX (top 6%) — acceptable for families but not a draw, mixed tenant base, ~2y average lease.
- Market conditions: Rents flat; 2283 active listings in the ZIP; 9 comparable units currently listed for rent nearby; rentals lingering (median 44d on market — plan ~5-8 weeks vacancy on turnover, expect pricing pressure); 56% of comp listings sitting > 30 days — soft ceiling on asking rent; high-income renter base; 13,259 units permitted in Montgomery County in 2024 (1,402 in 5+ unit buildings).
- This rent is only 15% of the median local income ($124k/yr) — well below the 30% rent-burden line; pricing power to push rent on renewal without tenant pushback.
Forward outlook
- Local home prices are declining (-3.0%/yr); year-one equity from $1k of loan paydown is wiped out by about $5k of value loss. Plan a longer hold.
- Montgomery County population projected at +65% by 2050 — long-run rental-demand tailwind backs the buy-and-hold thesis.
Negotiation context
- It's been on market 105 days — a 9% lower offer ($150k) is reasonable based on typical stale-listing flexibility.
- 2 sale attempts with the ask held roughly flat each time — persistent listings suggest the price (not the market) is what's stuck; bring a comps-based counter.
Questions for the listing agent
- It's been on market 105 days. Have you received any prior offers? Is the seller open to a 9% concession, seller financing, or rate buy-down credit?
- What does the HOA fee cover, when was the last increase, and are there any pending special assessments or reserve-fund shortfalls?
- Why hasn't it sold? Are there any deal-killer items the seller is aware of (foundation, flood, title, zoning, code violations)?
- Is there a deadline driving the sale (1031 exchange, divorce, estate, relocation)? That informs how much negotiation room exists.
- Schools are D-rated, which usually means shorter tenancies and higher turnover. Who's the typical renter profile here, and what's been the actual vacancy rate?
- The area grade is low — what's the realistic commute time and amenity access for the typical tenant pool here? Any planned neighborhood developments (good or bad) we should know about?
- What's the average days-on-market for RENTAL listings here right now (not sales)? A rising rental-DOM trend means longer vacancies and softer asking-rent achievability than the comps imply.
- What's the recent tenant-quality profile in this submarket — average credit score on applications, eviction rate, late-payment / NSF rate, and stable-employment percentage? A property-management company in the area should have these aggregated.
- How much new for-sale + rental construction is in the pipeline within 1–3 miles? Heavy new supply typically softens prices + rents 12–24 months out; constrained supply supports both.
Investment metrics
- 1% rule
- 0.94% ✗
- Cap rate
- 6.69%
- Cash-on-cash
- 1.41%
- DSCR
- 1.06
- GRM
- 8.9
CMA / ARV
- ARV (median comp)
- $103,221
- List price
- $165,000
- Delta
- 59.85%
- Verdict
- OVERPRICED
- Comps
- 4 within 1.0 mi
Projected returns pro-forma
-3.0% appreciation · 0.4% rent growth · sell at horizon
- IRR
- -17.1%
- Equity multiple
- 0.41×
- Total profit
- $-27,197
- Equity at exit
- $24,602
- IRR
- -14.9%
- Equity multiple
- 0.25×
- Total profit
- $-34,463
- Equity at exit
- $14,266
Cash invested: $46,200 (down + closing). Projections, not guarantees.
Landlord ↔ Tenant lean methodology
- Overall (STATE)
- 87 Strongly Landlord-Friendly
- State Texas
- 87 Strongly Landlord-Friendly · R+5
- County
- — inherits STATE
- City
- — inherits STATE
ZIP-level market 77316
- Home prices YoY
- -10.7%
- Rents YoY
- 0.4%
- Active inventory
- 2283
- Price-to-rent
- 8.9×
Monthly cashflow live
- Estimated rent
- $1,550 high interval (Pro) →
- Mortgage (P&I)
- −$865
- Tax from tax record
- −$203 /mo · $2,437/yr
- Insurance
- −$69
- HOA
- −$33
- Vacancy / Maint / Mgmt
- −$325
- Net cashflow
- $54
Break-even live
UW: 25.0% down · 7.5% · 30yr · 1.5% tax · 5.0% vac · 8.0% maint · 8.0% mgmt
Financing live
Cash to close
- Down payment
- $41,250
- Closing costs
- $4,950
- Reserves months
- —
- Total cash needed
- —
Loan-product check · same deal, 3 products live
Conventional
25% down · 7.5% · 30yr
- Down + closing
- —
- Monthly P&I
- —
- Monthly cashflow
- —
- DSCR
- —
- Eligible?
- —
Personal DTI + credit; lowest rate.
DSCR
20% down · 8.5% · 30yr
- Down + closing
- —
- Monthly P&I
- —
- Monthly cashflow
- —
- DSCR
- —
- Eligible?
- —
No personal income docs; deal must DSCR.
Hard money
10% down · 12.0% · 12mo
- Down + closing
- —
- Monthly P&I
- —
- Monthly cashflow
- —
- DSCR
- —
- Eligible?
- —
Short-term bridge; refi at stabilization.
Rent comps 9 comps
| Address | Beds | Baths | Sqft | Rent | $/sqft | DOM | Units | Dist |
|---|---|---|---|---|---|---|---|---|
| 16928 Kempwood Montgomery, TX | 3.0 | 2.0 | 1100 | $1,450 | $1.32 | 43d | 1 | 0.31mi |
| 16967 W Ivanhoe Montgomery, TX | 3.0 | 2.0 | 1012 | $1,350 | $1.33 | 12d | 1 | 0.35mi |
| 1406 April Villas Montgomery, TX | 1.0 | 1.0 | 750 | $1,150 | $1.53 | 24d | 1 | 0.64mi |
| 1406 April Villas Unit C Montgomery, TX | 1.0 | 1.0 | 717 | $1,150 | $1.60 | 24d | 1 | 0.64mi |
| 1050 S Pine Lake Rd Montgomery, TX | 2.0 | 2.0 | 1052 | $1,845 | $1.75 | 24d | 1 | 0.83mi |
| 298 Capetown Way Unit A Montgomery, TX | 2.0 | 1.5 | 1100 | $1,400 | $1.27 | 43d | 1 | 0.84mi |
| 275 Pine Terrace Dr Unit 1103A Montgomery, TX | 1.0 | 1.0 | 709 | $1,210 | $1.71 | 43d | 1 | 1.09mi |
| 275 Pine Terrace Dr Unit 1201A Montgomery, TX | 1.0 | 1.0 | 923 | $1,775 | $1.92 | 43d | 1 | 1.09mi |
| 275 Pine Terrace Dr Unit 1101A Montgomery, TX | 1.0 | 1.0 | 821 | $1,855 | $2.26 | 43d | 1 | 1.09mi |
HOA detail
- Monthly dues
- $33 · $396/yr
Listing history 17 events
-
2026-06-18days on market $165,000 Active 105 DOM
-
2026-06-17days on market $165,000 Active 104 DOM
-
2026-06-16days on market $165,000 Active 103 DOM
-
2026-06-15days on market $165,000 Active 102 DOM
-
2026-06-13days on market $165,000 Active 100 DOM
-
2026-06-13days on market $165,000 Active 99 DOM
-
2026-06-09days on market $165,000 Active 96 DOM
-
2026-06-08days on market $165,000 Active 95 DOM
-
2026-06-07days on market $165,000 Active 94 DOM
-
2026-06-04days on market $165,000 Active 91 DOM
-
2026-06-03days on market $165,000 Active 90 DOM
-
2026-06-02days on market $165,000 Active 89 DOM
-
2026-06-01days on market $165,000 Active 88 DOM
-
2026-05-31days on market $165,000 Active 87 DOM
-
2026-03-05$165,000 Active 452-char remark
Show marketing remark (452 chars)
Discover the charm of this delightful updated 2-bedroom, 2-bath manufactured home located in the peaceful community of Lake Conroe Village, situated on top of three lots, just minutes from Montgomery, TX. This inviting residence offers a comfortable and practical layout, perfect for those seeking to be near the lake. A new shed in the backyard is an excellent addition to the lot, which can turn into a storage, a tiny home, or a functional workshop.
-
2025-12-31historical
-
2025-10-27$175,000 Active
ⓘ Source: listings_history table (triggers on properties + properties_extension) + one-shot
backfill from property_details.listing_events for pre-trigger history.
Tax reassessment forecast TX · Resets to sale price
- Current annual tax
- $2,437 · $203/mo
- Projected year-2 tax
- $3,020 · $252/mo
- Expected delta
- +$582/yr (+$49/mo · 23.9%)
ⓘ Screening estimate from a state-policy table — verify with the county assessor before closing.
Nearby sold comps map
Loading sold comps map…
Walkable amenities ~0.75 mi
Loading nearby amenities…
Taxation est. · year 1
- Rental income
- $18,597
- − Mortgage interest
- −$9,243
- − Property taxes
- −$2,437
- − Insurance
- −$825
- − Repairs & maintenance
- −$1,488
- − Management
- −$1,488
- − HOA
- −$396
- − Depreciation
- −$4,800
- Taxable loss
- −$2,079
- Est. tax savings @ 24.0%
- +$499
- After-tax cash flow
- $1,149/yr
For passive investors: Depreciation is non-cash, so a rental often shows a tax loss while cash-flowing — sheltering income. Rental losses are passive: they offset passive income freely, and up to $25,000/yr can offset ordinary (W-2) income if you actively participate and your MAGI is under $100k (phasing out to $0 by $150k); unused losses carry forward. On sale, claimed depreciation is recaptured at up to 25%, and gains may owe capital-gains tax (a 1031 exchange can defer both). Figures are a year-1 estimate at your 24.0% rate — not tax advice; consult a CPA.
Schools (NCES district)
- District
- Montgomery ISD
- NCES district ID
- 4831260
- Math proficiency
- 63% ▼ -3.00%
- Reading proficiency
- 57% ▼ -3.00%
- Median HH income
- $75,596
- Composite
- 53.55/100
- National rank
- #1445
- State rank
- #49 of 826 in TX
Livability — Conroe
- Score
- 74/100
- State rank
- #169
- US rank
- #4447
Category grades
Schools grade is shown separately in the Schools card above.
Census & demographics
- County
- Montgomery County · 663,713 people
- City population
- 205,417
- Metro
- Houston-The Woodlands-Sugar Land, TX
- Population (ZIP)
- 34,694
- Household income
- $124,055
- Rent vs Own
- Severe rent burden
- 273.0
Population outlook (Montgomery County) Hauer SSP2
- Today (2025)
- 713,896 people
- By 2030
- 805,263 · +12.8%
- By 2040
- 992,708 · +39.1%
- By 2050
- 1,179,590 · +65.2%
- By 2075
- 1,628,084 · +128.1%
- By 2100
- 1,937,880 · +171.5%
Race, ethnicity, and origin ACS 2023
- Neighborhood character
- Predominantly White (80%)
- Race & ethnicity
- White 80% Hispanic / Latino 14% Two or more races 11% Black 1% Asian 1%
- Hispanic origin (detail)
- Mexican 9%
- Common ancestry
- Lithuanian 6% Slovak 3% Romanian 3%
- Foreign-born
- 6% · Canada
- Languages at home
- 90% English-only · Spanish 8%
Political lean MEDSL · Montgomery
- 2024 margin
- Solid R (+45.5) · D 26.8% · R 72.3%
- 2008→2024 swing
- +7.2pp toward D · 2008: -52.7pp · 2024: -45.5pp
- All cycles
- 2024: R+45.5 2020: R+43.8 2016: R+51.4 2012: R+60.7 2008: R+52.7
Not yet ingested
- Civics
- —
Market trends
- HPI YoY
- ▼ -31.44%
- Current HPI
- 262.6973
- Rent YoY
- ▲ 0.40%
- Metro
- Houston-The Woodlands-Sugar Land, TX
- State GDP YoY
- ▲ 3.95%
- F500 in state
- 110
Industry mix (Fortune 500 HQ in TX)
| Industry | F500 HQs | Revenue |
|---|---|---|
| Energy | 16 | $1,198B |
|
||
| Technology | 5 | $198B |
|
||
| Engineering / Construction | 4 | $72B |
|
||
| Energy Services | 3 | $60B |
|
||
| Utilities | 3 | $41B |
|
||
| Healthcare | 2 | $330B |
|
||
Price history
-5.7% since first listed3 events — show timeline
- 2026-03-05 Listed $165,000 HARMLS
- 2025-12-31 Listing Removed — HARMLS
- 2025-10-27 Listed $175,000 HARMLS
Property tax history
+35.4%/yrLatest (2025): $2,437 · +12.0% YoY. Source: county tax records.
Cash-flow waterfall
monthlySold comps — $/sqft
last 12 mo · ≤1 miLoading sold comps…