 Duplex
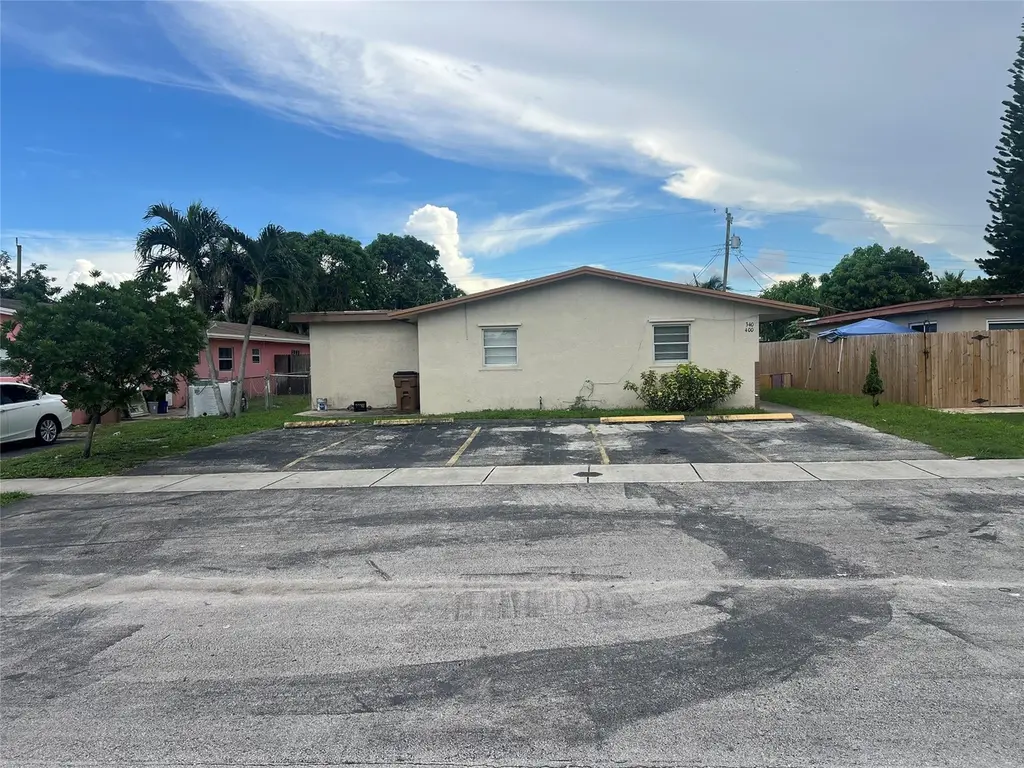
340-400 NE 44th St · Deerfield Beach, FL
Flood risk 1/10 · Minimal
- FEMA flood zone
- X (unshaded)
- Chance of flooding over 30 yrs
- 0.0%
- Est. flood insurance / yr
- $507 – $1,088
Fire risk 1/10 · Minimal
- Est. fire insurance / yr
- $947 – $1,759
Heat risk 9/10 · Severe
- Hot days now (above 107°F)
- 7 days/yr
- Hot days in 30 yrs
- 26 days/yr
Wind risk 10/10 · Severe
- Chance of severe wind over 30 yrs
- 99.0%
Air-quality risk 2/10 · Minimal
- Unhealthy air days now
- 1 days/yr
- Unhealthy air days in 30 yrs
- 3 days/yr
Risk factors via First Street. Map © Google.
Why this score? — see what drove the D grade
The composite is a weighted blend of 9 inputs, each scored 0–100. Each bar is that input's sub-score; the figure is the points it added to the 100-point composite (weight × sub-score).
- Cash flow +15.0/30.0
- ARV discount +7.5/15.0
- DSCR +4.6/10.0
- 1% rule +4.2/10.0
- Schools +4.1/10.0
- Livability +3.8/5.0
- Rent growth +2.9/5.0
- Condition / age +2.5/5.0
- Appreciation +0.0/10.0
$600,000
🖨 Deal sheet (PDF) 📄 Offer letter ✓ Due diligence
Multi-family units
County records classify this as Multi-Family (2-4 Unit). Listing-text estimate: 2 units. confirmed
Listing remarks
Good opportunity for investors in Pompano Beach. This duplex has two big units with 3 bedrooms and 1 bath for each. There is space for additional inside. A large storage room that can be used for laundry rooms and so on. tenants have been living there for years. This property is well situated, close to North Broward Hospital, Sample Road, Hillsboro Blvd. It is a money growth investment. SELLER IS WILLING TO HELP WITH CLOSING COSTS. Bring you best offer.
Key facts
- Large storage room
- Close to sample road
- Built 1972
Tags
Neighborhood map
What this means for you Summary
Snapshot
- This is a 2 × 3-bed/1.0-bath units multifamily listed at $600k.
Deal economics
- At list price, monthly cash flow is $192 ($2k/yr) — positive. Per door: $96/mo.
- The deal already cash-flows at list — no discount required.
- To meet the 1% rule (rent ≥ 1% of price), the offer needs to be $549k (8.5% below list).
- Recommended offer: $549k (8.5% below list) — sets the bar for 1% rule.
- Cap rate 6.7% vs local median 4.1% in Deerfield Beach — top-decile yield for the area; either an underpriced asset or a hidden risk that comps aren't pricing in. Stress-test before assuming the spread holds.
Location & tenants
- Location reads 75/100 on livability (#250 in FL, #3,970 nationally) — a middle-class / working-renter tenant base. Strengths: housing A+, health & safety A+, cost of living A; Watch: amenities D-, employment D-.
- Broward (suburban): math 42% / reading 53% proficiency, ranked #46 of 73 in FL (top 63%) — families likely to look elsewhere, expect single-tenant / working-renter base with shorter leases.
- Zoned schools: Nova Blanche Forman Elementary (math 35% / reading 55%, grade D-, #1,271 of 2,144 statewide, top 60%, 769 students, 72% FRL); Nova Middle School (math 44% / reading 53%, grade C-, #274 of 571 statewide, top 50%, 1,284 students, 68% FRL); Deerfield Beach High School (math 12% / reading 37%, grade F, #505 of 667 statewide, top 79%, 2,251 students, 69% FRL) — zoned schools average 69% FRL vs 51% district-wide (18 pts higher); higher-poverty schools than district average — tighter screening recommended.
- Market conditions: Rents rising (+1.8%/yr); 595 active listings in the ZIP; 32 comparable units currently listed for rent nearby; rentals at typical pace (median 20d on market — plan ~3-4 weeks tenant-placement turnaround); 2,111 units permitted in Broward County in 2024 (1,265 in 5+ unit buildings).
- At $5,492/mo this rent would consume 92% of the median local household income ($71k/yr) (locally 2907% of renters already pay >50% of income on rent) — very limited rent-growth headroom before tenants either downsize or default.
Forward outlook
- Local home prices are declining (-3.0%/yr); year-one equity from $4k of loan paydown is wiped out by about $18k of value loss. Plan a longer hold.
- Broward County population projected at +34% by 2050 — long-run rental-demand tailwind backs the buy-and-hold thesis.
Negotiation context
- It's been on market 45 days — a 3% lower offer ($582k) is reasonable based on typical stale-listing flexibility.
Risks & watch-outs
- Climate carrying-cost: severe wind risk, 99% chance of damaging wind over 30y; extreme-heat days projected 7→26/yr by 2055 (HVAC capex compounding) — expect insurance premiums to compound above CPI over the hold.
Questions for the listing agent
- It's been on market 45 days. Have you received any prior offers? Is the seller open to a 8% concession, seller financing, or rate buy-down credit?
- Can we see the unit-by-unit rent roll, current vacancy, and any below-market leases? What's the average tenancy length?
- What capital expenditures (roof, boiler, parking lot, exteriors) have been made in the last 5 years, and what's planned in the next 2?
- Built in 1972 — when were the roof, HVAC, electrical panel, plumbing, and water heater last replaced?
- Is there a deadline driving the sale (1031 exchange, divorce, estate, relocation)? That informs how much negotiation room exists.
- Schools are D-rated, which usually means shorter tenancies and higher turnover. Who's the typical renter profile here, and what's been the actual vacancy rate?
- The area grade is low — what's the realistic commute time and amenity access for the typical tenant pool here? Any planned neighborhood developments (good or bad) we should know about?
- What's the average days-on-market for RENTAL listings here right now (not sales)? A rising rental-DOM trend means longer vacancies and softer asking-rent achievability than the comps imply.
- What's the recent tenant-quality profile in this submarket — average credit score on applications, eviction rate, late-payment / NSF rate, and stable-employment percentage? A property-management company in the area should have these aggregated.
- How much new apartment / multifamily construction is in the pipeline within 1–3 miles? Heavy new supply (>2% of stock underway) typically softens rents 12–24 months out; light construction supports rent growth.
Investment metrics
- 1% rule
- 0.92% ✗
- Cap rate
- 6.68%
- Cash-on-cash
- 1.37%
- DSCR
- 1.06
- GRM
- 9.1
CMA / ARV
No comps found within radius.
Projected returns pro-forma
-3.0% appreciation · 1.75% rent growth · sell at horizon
- IRR
- -15.5%
- Equity multiple
- 0.45×
- Total profit
- $-91,723
- Equity at exit
- $89,462
- IRR
- -9.3%
- Equity multiple
- 0.46×
- Total profit
- $-91,071
- Equity at exit
- $51,877
Cash invested: $168,000 (down + closing). Projections, not guarantees.
Landlord ↔ Tenant lean methodology
- Overall (STATE)
- 87 Strongly Landlord-Friendly
- State Florida
- 87 Strongly Landlord-Friendly · R+3
- County
- — inherits STATE
- City
- — inherits STATE
ZIP-level market 33064
- Home prices YoY
- -18.7%
- Rents YoY
- 1.8%
- Active inventory
- 595
- Price-to-rent
- 18.2×
Monthly cashflow live
- Estimated rent
- $5,492 high interval (Pro) →
- Mortgage (P&I)
- −$3,146
- Tax est. 1.5%
- −$750 /mo · $9,000/yr
- Insurance
- −$250
- HOA
- −$0
- Vacancy / Maint / Mgmt
- −$1,153
- Net cashflow
- $192
Break-even live
Sensitivity live
| Price | -10% $607 | -5% $400 | +0% $192 | +5% $-15 | +10% $-222 |
|---|---|---|---|---|---|
| Rent | -10% $-242 | -5% $-25 | +0% $192 | +5% $409 | +10% $626 |
| Rate | -1.0pp $494 | -0.5pp $345 | base $192 | +0.5pp $37 | +1.0pp $-121 |
2-unit breakdown (identical units grouped — click to expand)
| Units | Beds | Baths | Est. rent |
|---|---|---|---|
| 2× units | 3 | 1 | $5,492 |
| #1 | 3 | 1 | $2,746 |
| #2 | 3 | 1 | $2,746 |
| Total (2 units) | $5,492 | ||
UW: 25.0% down · 7.5% · 30yr · 1.5% tax · 5.0% vac · 8.0% maint · 8.0% mgmt
Financing live
Cash to close
- Down payment
- $150,000
- Closing costs
- $18,000
- Reserves months
- —
- Total cash needed
- —
Loan-product check · same deal, 3 products live
Conventional
25% down · 7.5% · 30yr
- Down + closing
- —
- Monthly P&I
- —
- Monthly cashflow
- —
- DSCR
- —
- Eligible?
- —
Personal DTI + credit; lowest rate.
DSCR
20% down · 8.5% · 30yr
- Down + closing
- —
- Monthly P&I
- —
- Monthly cashflow
- —
- DSCR
- —
- Eligible?
- —
No personal income docs; deal must DSCR.
Hard money
10% down · 12.0% · 12mo
- Down + closing
- —
- Monthly P&I
- —
- Monthly cashflow
- —
- DSCR
- —
- Eligible?
- —
Short-term bridge; refi at stabilization.
Rent comps 32 comps
| Address | Beds | Baths | Sqft | Rent | $/sqft | DOM | Units | Dist |
|---|---|---|---|---|---|---|---|---|
| 378 NE 47th Pl #378 Pompano Beach, FL | 3.0 | 2.5 | 1457 | $3,000 | $2.06 | 26d | 1 | 0.28mi |
| 4030 NE 2nd Ter Deerfield Beach, FL | 3.0 | 2.0 | 1740 | $3,650 | $2.10 | 16d | 1 | 0.39mi |
| 4030 NE 2nd Ter Deerfield Beach, FL | 3.0 | 2.0 | 1740 | $3,650 | $2.10 | 13d | 1 | 0.39mi |
| 220 NW 43rd Ct Deerfield Beach, FL | 3.0 | 2.0 | 1458 | $2,700 | $1.85 | 16d | 1 | 0.58mi |
| 220 NW 43rd St Deerfield Beach, FL | 3.0 | 2.0 | 1458 | $2,800 | $1.92 | 26d | 1 | 0.59mi |
| 3850 NE 12th Ter Pompano Beach, FL | 3.0 | 2.0 | 1528 | $3,500 | $2.29 | 0d | 1 | 0.86mi |
| 3850 NE 12th Ter Pompano Beach, FL | 3.0 | 2.0 | 1528 | $4,200 | $2.75 | 18d | 1 | 0.86mi |
| 1320 SW 11th Ave Unit A Deerfield Beach, FL | 2.0 | 1.0 | 2266 | $2,000 | $0.88 | 26d | 1 | 1.04mi |
| 3120 NE 8th Ave Pompano Beach, FL | 3.0 | 2.0 | 1538 | $2,999 | $1.95 | 26d | 1 | 1.10mi |
| 4771 NE 17th Ave Pompano Beach, FL | 3.0 | 1.0 | 1400 | $2,750 | $1.96 | 9d | 1 | 1.11mi |
| 4053 Eastridge Dr Deerfield Beach, FL | 3.0 | 2.5 | 1478 | $3,300 | $2.23 | 26d | 1 | 1.13mi |
| 223 SW 14th Pl Deerfield Beach, FL | 3.0 | 2.0 | 1550 | $2,950 | $1.90 | 6d | 1 | 1.15mi |
| 4362 Veleiros Ave Pompano Beach, FL | 3.0 | 2.5 | 1628 | $3,700 | $2.27 | 26d | 1 | 1.17mi |
| 3743 NE 16th Ter Pompano Beach, FL | 3.0 | 2.0 | 1806 | $3,400 | $1.88 | 3d | 1 | 1.18mi |
| 1757 NE 49th Ct Pompano Beach, FL | 3.0 | 2.0 | 1671 | $2,150 | $1.29 | 5d | 1 | 1.18mi |
| 3050 NE 9th Ter Pompano Beach, FL | 3.0 | 2.0 | 1400 | $2,850 | $2.04 | 7d | 1 | 1.19mi |
| 2217 Discovery Cir W Deerfield Beach, FL | 2.0 | 2.5 | 1429 | $2,400 | $1.68 | 16d | 1 | 1.20mi |
| 4329 Veleiros Ave Pompano Beach, FL | 3.0 | 2.5 | 1479 | $3,499 | $2.37 | 26d | 1 | 1.22mi |
| 400 NE 30th St Unit 2 Pompano Beach, FL | 2.0 | 2.0 | 2119 | $2,400 | $1.13 | 9d | 1 | 1.22mi |
| 1741 NE 39th St Pompano Beach, FL | 3.0 | 2.0 | 2072 | $3,500 | $1.69 | 26d | 1 | 1.23mi |
| 110 NE 30th St Pompano Beach, FL | 3.0 | 2.0 | 1418 | $4,400 | $3.10 | 26d | 1 | 1.25mi |
| 1067 Rio Ct Unit 1067 Lighthouse Point, FL | 3.0 | 2.5 | 1622 | $3,800 | $2.34 | 26d | 1 | 1.27mi |
| 1832 NE 49th St Pompano Beach, FL | 3.0 | 2.0 | 1400 | $2,600 | $1.86 | 26d | 1 | 1.27mi |
| 4317 Lago Dr Unit 4317 Lighthouse Point, FL | 3.0 | 2.5 | 1830 | $3,750 | $2.05 | 26d | 1 | 1.28mi |
| 1040 Crystal Lake Dr #2 Deerfield Beach, FL | 2.0 | 2.0 | 1550 | $2,000 | $1.29 | 16d | 1 | 1.35mi |
| 1221 NW 44th St Deerfield Beach, FL | 3.0 | 2.0 | 1624 | $3,100 | $1.91 | 9d | 1 | 1.36mi |
| 2313 Vintage Dr Lighthouse Point, FL | 2.0 | 2.5 | 1430 | $3,000 | $2.10 | 19d | 1 | 1.40mi |
| 2351 Vintage Dr Unit 2351 Lighthouse Point, FL | 2.0 | 2.5 | 1430 | $3,100 | $2.17 | 18d | 1 | 1.42mi |
| 2351 Vintage Dr Unit 2351 Lighthouse Point, FL | 2.0 | 2.5 | 1430 | $3,100 | $2.17 | 17d | 1 | 1.42mi |
| 5161 NW 11th Ln Deerfield Beach, FL | 3.0 | 2.0 | 1486 | $2,925 | $1.97 | 26d | 1 | 1.45mi |
| 1398 SW 24th Ter Deerfield Beach, FL | 3.0 | 2.0 | 1865 | $5,000 | $2.68 | 26d | 1 | 1.49mi |
| 1087 NW 33rd Mnr Pompano Beach, FL | 3.0 | 2.5 | 1495 | $2,675 | $1.79 | 26d | 1 | 1.49mi |
Listing history 3 events
-
2026-04-25status Pending
-
2026-03-25price $600,000
-
2025-10-08$615,000 Active
ⓘ Source: listings_history table (triggers on properties + properties_extension) + one-shot
backfill from property_details.listing_events for pre-trigger history.
Climate risk First Street
- Flood 1/10 Low FEMA zone X (unshaded) · 0% chance over 30 yrs
- Wildfire 1/10 Low
- Heat 9/10 Extreme 7 d/yr ≥107°F today · 26 d/yr by 30 yrs out
- Wind 10/10 Extreme 99% chance of damaging wind over 30 yrs
- Air quality 2/10 Low 1 unhealthy d/yr today · 3 by 30 yrs out
Nearby sold comps map
Loading sold comps map…
Walkable amenities ~0.75 mi
Loading nearby amenities…
Taxation est. · year 1
- Rental income
- $65,904
- − Mortgage interest
- −$33,609
- − Property taxes
- −$9,000
- − Insurance
- −$3,000
- − Repairs & maintenance
- −$5,272
- − Management
- −$5,272
- − Depreciation
- −$17,455
- Taxable loss
- −$7,705
- Est. tax savings @ 24.0%
- +$1,849
- After-tax cash flow
- $4,156/yr
For passive investors: Depreciation is non-cash, so a rental often shows a tax loss while cash-flowing — sheltering income. Rental losses are passive: they offset passive income freely, and up to $25,000/yr can offset ordinary (W-2) income if you actively participate and your MAGI is under $100k (phasing out to $0 by $150k); unused losses carry forward. On sale, claimed depreciation is recaptured at up to 25%, and gains may owe capital-gains tax (a 1031 exchange can defer both). Figures are a year-1 estimate at your 24.0% rate — not tax advice; consult a CPA.
Schools (NCES district)
- District
- Broward
- NCES district ID
- 1200180
- Math proficiency
- 42% ▼ -18.00%
- Reading proficiency
- 53% ▼ -5.00%
- Median HH income
- $52,139
- Composite
- 40.88/100
- National rank
- #3621
- State rank
- #46 of 73 in FL
Livability — Deerfield Beach
- Score
- 75/100
- State rank
- #250
- US rank
- #3970
Category grades
Schools grade is shown separately in the Schools card above.
Census & demographics
- Census place
- Deerfield Beach, FL
- County
- Broward County · 1,963,430 people
- City population
- 61,449
- Metro
- Miami-Fort Lauderdale-Pompano Beach, FL
- Population (ZIP)
- 64,563
- Household income
- $71,301
- Rent vs Own
- Severe rent burden
- 2907.0
Population outlook (Broward County) Hauer SSP2
- Today (2025)
- 2,207,033 people
- By 2030
- 2,360,704 · +7.0%
- By 2040
- 2,661,208 · +20.6%
- By 2050
- 2,946,698 · +33.5%
- By 2075
- 3,602,273 · +63.2%
- By 2100
- 3,970,984 · +79.9%
Race, ethnicity, and origin ACS 2023
- Neighborhood character
- Highly diverse neighborhood (Simpson 0.75)
- Race & ethnicity
- White 34% Hispanic / Latino 27% Black 25% Two or more races 24% Asian 2%
- Hispanic origin (detail)
- Mexican 4% Puerto Rican 4% Cuban 4% Dominican 2%
- Common ancestry
- Hispanic 13% Estonian 10% Romanian 1%
- Foreign-born
- 43% · Canada, Jamaica, Dominican Republic
- Languages at home
- 45% English-only · Spanish 23% French/Haitian/Cajun 16% Other Indo-European 13%
Political lean MEDSL · Broward
- 2024 margin
- D (+17.0) · D 58.0% · R 41.0%
- 2008→2024 swing
- -17.8pp toward R · 2008: 34.7pp · 2024: 17.0pp
- All cycles
- 2024: D+17.0 2020: D+29.8 2016: D+35.0 2012: D+34.9 2008: D+34.7
Not yet ingested
- Civics
- —
Market trends
- HPI YoY
- ▼ -109.09%
- Current HPI
- 474.7007
- Rent YoY
- ▲ 1.75%
- Metro
- Miami-Fort Lauderdale-Pompano Beach, FL
- State GDP YoY
- ▲ 3.28%
- F500 in state
- 36
Industry mix (Fortune 500 HQ in FL)
| Industry | F500 HQs | Revenue |
|---|---|---|
| Industrial Technology | 2 | $29B |
|
||
| Insurance | 2 | $17B |
|
||
| Retail | 1 | $60B |
|
||
| Technology Distribution | 1 | $58B |
|
||
| Homebuilding | 1 | $35B |
|
||
| Technology Manufacturing | 1 | $35B |
|
||
Price history
-2.4% since first listed3 events — show timeline
- 2026-04-25 Pending — Beaches MLS
- 2026-03-25 Price Changed $600,000 Beaches MLS
- 2025-10-08 Listed $615,000 Beaches MLS
Cash-flow waterfall
monthlySold comps — $/sqft
last 12 mo · ≤1 miLoading sold comps…