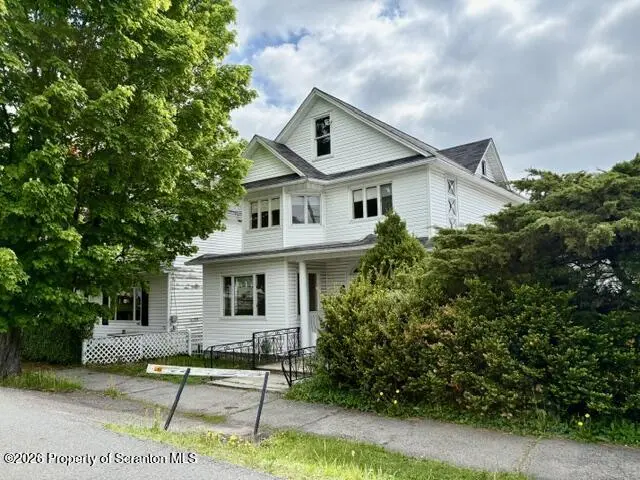
706 Delaware St · Forest City, PA
Flood risk 1/10 · Minimal
- FEMA flood zone
- X (unshaded)
- Chance of flooding over 30 yrs
- 0.0%
- Est. flood insurance / yr
- $473 – $860
Fire risk 1/10 · Minimal
- Est. fire insurance / yr
- $511 – $949
Heat risk 2/10 · Minimal
- Hot days now (above 87°F)
- 8 days/yr
- Hot days in 30 yrs
- 19 days/yr
Wind risk 2/10 · Minimal
- Chance of severe wind over 30 yrs
- 2.0%
Air-quality risk 2/10 · Minimal
- Unhealthy air days now
- 0 days/yr
- Unhealthy air days in 30 yrs
- 1 days/yr
Risk factors via First Street. Map © Google.
Why this score? — see what drove the C+ grade
The composite is a weighted blend of 9 inputs, each scored 0–100. Each bar is that input's sub-score; the figure is the points it added to the 100-point composite (weight × sub-score).
- Cash flow +15.6/30.0
- ARV discount +15.0/15.0
- Appreciation +10.0/10.0
- 1% rule +4.8/10.0
- DSCR +4.8/10.0
- Schools +3.6/10.0
- Livability +3.3/5.0
- Rent growth +2.5/5.0
- Condition / age +2.5/5.0
$174,900
🖨 Deal sheet 📄 Offer letter ✓ Due diligence
Listing remarks
Classic charm, generous living space, and endless potential await in this stately two-story home in the heart of Forest City. Featuring 4 spacious bedrooms and 1 full bath and 2 additional 1/2 baths, this property offers the opportunity to restore and customize a timeless home with character throughout. Hardwood floors extend across the main and second levels, complementing the large formal living and dining rooms. A beautiful sunroom/parlor with abundant natural light creates the perfect space for relaxing, reading, or entertaining. The kitchen is ready for refinishing and offers excellent potential for redesign. A convenient half bath is located just off the kitchen, while an additional h
Key facts
- Covered front porch
- Cedar closet
- Walk up attic
Tags
Property features AI
Finance
- HOA & community: No community features listed
Exterior
- Parking: Attached garage plus on-street parking; Garage faces rear; 1 garage space
- Utilities: Public water; Public sewer; Electricity connected (circuit breakers); Natural gas connected
- Home design: Single-family house; Two levels; Built in 1910 (estimated); Fixer condition
- Construction: Block, stone, vinyl siding and concrete construction; Block and stone foundation (permanent)
- Exterior features: Private yard; Porch; Partial fencing; Gentle sloping lot; City street frontage on a paved road
Interior
- Kitchen: Kitchen (needs work)
- Bedrooms: 4 bedrooms (one with cedar closet; one with walk-up attic access and hardwood floors; others with hardwood)
- Flooring: Hardwood; Carpet; Linoleum
- Bathrooms: 3 bathrooms total — 1 full bath and 2 half baths (one half bath noted as needing rehab)
- Heating & cooling: Steam heating with natural gas; ENERGY STAR qualified equipment; Ceiling fan(s)
- Interior features: Cedar closets and attic storage; Natural woodwork; Decorative fireplace; Bay and display windows; Floored walk-up attic
- Laundry & utility: No laundry features listed
Neighborhood map
What this means for you Summary
Snapshot
- This is a 4-bed/2.0-bath single-family listed at $175k.
Deal economics
- At list price, monthly cash flow is $73 ($880/yr) — positive.
- The deal already cash-flows at list — no discount required.
- To meet the 1% rule (rent ≥ 1% of price), the offer needs to be $171k (2.4% below list).
- Recommended offer: $171k (2.4% below list) — sets the bar for 1% rule.
Location & tenants
- Location reads 66/100 on livability (#1,019 in PA) — a middle-class / working-renter tenant base. Strengths: crime A+, cost of living A+, housing A+; Watch: amenities F, commute F, employment D-.
- Forest City Regional SD (suburban): math 34% / reading 51% proficiency, ranked #308 of 539 in PA (top 57%) — families likely to look elsewhere, expect single-tenant / working-renter base with shorter leases.
- Market conditions: 53 active listings in the ZIP; 80 units permitted in Susquehanna County in 2024 (5 in 5+ unit buildings).
Forward outlook
- In year one you build about $19k of equity ($1k loan paydown + $17k appreciation (10.0% local appreciation)).
- Susquehanna County population projected at -30% by 2050 — secular population decline; favor cash flow + early exit over multi-decade hold.
- At projected returns (10.0% appreciation + 3.0% rent growth), your $49k cash investment doubles in ~3 years — after that, you're playing with house money.
- By year 2, paydown + projected appreciation supports a ~$30k cash-out refi (75% LTV) — recoverable capital for the next deal without selling this one.
Negotiation context
- It's been on market 29 days — a 2% lower offer ($172k) is reasonable based on typical stale-listing flexibility.
Risks & watch-outs
- Watch-outs: built in 1910 — expect roof / HVAC / electrical / plumbing capex.
Questions for the listing agent
- Built in 1910 — when were the roof, HVAC, electrical panel, plumbing, and water heater last replaced?
- Is there a deadline driving the sale (1031 exchange, divorce, estate, relocation)? That informs how much negotiation room exists.
- What's the average days-on-market for RENTAL listings here right now (not sales)? A rising rental-DOM trend means longer vacancies and softer asking-rent achievability than the comps imply.
- What's the recent tenant-quality profile in this submarket — average credit score on applications, eviction rate, late-payment / NSF rate, and stable-employment percentage? A property-management company in the area should have these aggregated.
- How much new for-sale + rental construction is in the pipeline within 1–3 miles? Heavy new supply typically softens prices + rents 12–24 months out; constrained supply supports both.
Investment metrics
- 1% rule
- 0.98% ✗
- Cap rate
- 6.80%
- Cash-on-cash
- 1.80%
- DSCR
- 1.08
- GRM
- 8.5
CMA / ARV
- ARV (on-the-fly)
- $240,460
- Comps found
- 6
Show comp detail 6 sales within ~0.75 mi
| Address | Dist | Beds/Ba | Sqft | Sold | Price | $/sf | Match |
|---|---|---|---|---|---|---|---|
| 514 Hudson St | 0.16mi | 4/2.0 | 2,050 (-6%) | 2mo | $156,400 | $76 | 81 |
| 720 Delaware St | 0.03mi | 3/2.5 (-1) | 2,056 (-6%) | 4mo | $140,000 | $68 | 78 |
| 730 Main St | 0.11mi | 4/2.0 | 2,354 (+8%) | 11mo | $215,000 | $91 | 73 |
| 417 Marion St | 0.52mi | 4/2.0 | 1,972 (-10%) | 2mo | $265,000 | $134 | 58 |
| 142 Dundaff St | 0.20mi | 3/2.5 (-1) | 1,998 (-9%) | 22mo | $220,000 | $110 | 51 |
| 22 Firemans Ln | 0.75mi | 3/3.0 (-1) | 1,950 (-11%) | 16mo | $220,000 | $113 | 25 |
Match score weights: distance 35% · size 25% · config 20% · recency 20%. Top-matched comps best support the ARV.
Projected returns pro-forma
10.0% appreciation · 3.0% rent growth · sell at horizon
- IRR
- 25.6%
- Equity multiple
- 3.04×
- Total profit
- $99,992
- Equity at exit
- $157,564
- IRR
- 22.5%
- Equity multiple
- 6.94×
- Total profit
- $290,919
- Equity at exit
- $339,792
Cash invested: $48,972 (down + closing). Projections, not guarantees.
Landlord ↔ Tenant lean methodology
- Overall (STATE)
- 62 Landlord-Friendly
- State Pennsylvania
- 62 Landlord-Friendly · EVEN
- County
- — inherits STATE
- City
- — inherits STATE
ZIP-level market 18421
- Home prices YoY
- 20.9%
- Active inventory
- 53
- Price-to-rent
- 8.5×
Monthly cashflow live
- Estimated rent
- $1,707 medium interval (Pro) →
- Mortgage (P&I)
- −$917
- Tax from tax record
- −$285 /mo · $3,422/yr
- Insurance
- −$73
- HOA
- −$0
- Vacancy / Maint / Mgmt
- −$358
- Net cashflow
- $73
Break-even live
UW: 25.0% down · 7.5% · 30yr · 1.5% tax · 5.0% vac · 8.0% maint · 8.0% mgmt
Financing live
Cash to close
- Down payment
- $43,725
- Closing costs
- $5,247
- Reserves months
- —
- Total cash needed
- —
Loan-product check · same deal, 3 products live
Conventional
25% down · 7.5% · 30yr
- Down + closing
- —
- Monthly P&I
- —
- Monthly cashflow
- —
- DSCR
- —
- Eligible?
- —
Personal DTI + credit; lowest rate.
DSCR
20% down · 8.5% · 30yr
- Down + closing
- —
- Monthly P&I
- —
- Monthly cashflow
- —
- DSCR
- —
- Eligible?
- —
No personal income docs; deal must DSCR.
Hard money
10% down · 12.0% · 12mo
- Down + closing
- —
- Monthly P&I
- —
- Monthly cashflow
- —
- DSCR
- —
- Eligible?
- —
Short-term bridge; refi at stabilization.
Listing history 17 events
-
2026-06-18days on market $174,900 Active 29 DOM
-
2026-06-17days on market $174,900 Active 28 DOM
-
2026-06-16days on market $174,900 Active 27 DOM
-
2026-06-15price $174,900 Active 26 DOM
-
2026-06-15days on market $199,000 Active 26 DOM
-
2026-06-14days on market $199,000 Active 24 DOM
-
2026-06-13days on market $199,000 Active 23 DOM
-
2026-06-10days on market $199,000 Active 21 DOM
-
2026-06-09days on market $199,000 Active 20 DOM
-
2026-06-08days on market $199,000 Active 19 DOM
-
2026-06-07days on market $199,000 Active 18 DOM
-
2026-06-03days on market $199,000 Active 14 DOM
-
2026-06-02days on market $199,000 Active 13 DOM
-
2026-06-01days on market $199,000 Active 12 DOM
-
2026-05-31days on market $199,000 Active 11 DOM
-
2026-05-30days on market $199,000 Active 10 DOM
-
2026-05-20$215,000 Active
ⓘ Source: listings_history table (triggers on properties + properties_extension) + one-shot
backfill from property_details.listing_events for pre-trigger history.
Tax reassessment forecast PA · Partial reset (capped growth)
- Current annual tax
- $3,422 · $285/mo
- Projected year-2 tax
- $3,422 · $285/mo
- Expected delta
- $0/yr ($0/mo · 0.0%)
ⓘ Screening estimate from a state-policy table — verify with the county assessor before closing.
Climate risk First Street
- Flood 1/10 Low FEMA zone X (unshaded) · 0% chance over 30 yrs
- Wildfire 1/10 Low
- Heat 2/10 Low 8 d/yr ≥87°F today · 19 d/yr by 30 yrs out
- Wind 2/10 Low 2% chance of damaging wind over 30 yrs
- Air quality 2/10 Low 0 unhealthy d/yr today · 1 by 30 yrs out
Nearby sold comps map
Loading sold comps map…
Walkable amenities ~0.75 mi
Loading nearby amenities…
Taxation est. · year 1
- Rental income
- $20,484
- − Mortgage interest
- −$9,797
- − Property taxes
- −$3,422
- − Insurance
- −$874
- − Repairs & maintenance
- −$1,639
- − Management
- −$1,639
- − Depreciation
- −$5,088
- Taxable loss
- −$1,975
- Est. tax savings @ 24.0%
- +$474
- After-tax cash flow
- $1,354/yr
For passive investors: Depreciation is non-cash, so a rental often shows a tax loss while cash-flowing — sheltering income. Rental losses are passive: they offset passive income freely, and up to $25,000/yr can offset ordinary (W-2) income if you actively participate and your MAGI is under $100k (phasing out to $0 by $150k); unused losses carry forward. On sale, claimed depreciation is recaptured at up to 25%, and gains may owe capital-gains tax (a 1031 exchange can defer both). Figures are a year-1 estimate at your 24.0% rate — not tax advice; consult a CPA.
Schools (NCES district)
- District
- Forest City Regional SD
- NCES district ID
- 4209930
- Math proficiency
- 34% ▼ -17.00%
- Reading proficiency
- 51% ▼ -11.00%
- Median HH income
- $47,744
- Composite
- 36.29/100
- National rank
- #4701
- State rank
- #308 of 539 in PA
Livability — Forest City
- Score
- 66/100
- State rank
- #1019
- US rank
- #11278
Category grades
Schools grade is shown separately in the Schools card above.
Census & demographics
- Census place
- Forest City, PA
- Population (ZIP)
- 4,475
Population outlook (Susquehanna County) Hauer SSP2
- Today (2025)
- 37,552 people
- By 2030
- 35,270 · -6.1%
- By 2040
- 30,663 · -18.3%
- By 2050
- 26,492 · -29.5%
- By 2075
- 19,658 · -47.7%
- By 2100
- 15,179 · -59.6%
Race, ethnicity, and origin ACS 2023
- Neighborhood character
- Predominantly White (93%)
- Race & ethnicity
- White 93% Hispanic / Latino 4% Two or more races 3%
- Common ancestry
- Romanian 11% Italian 3% Scotch-Irish 2%
- Foreign-born
- 3% · Canada, Vietnam
- Languages at home
- 97% English-only · Spanish 1% Vietnamese 1% Russian/Polish/Slavic 1%
Political lean MEDSL · Susquehanna
- 2024 margin
- Solid R (+44.7) · D 27.2% · R 71.9%
- 2008→2024 swing
- -33.0pp toward R · 2008: -11.7pp · 2024: -44.7pp
- All cycles
- 2024: R+44.7 2020: R+41.2 2016: R+42.9 2012: R+21.4 2008: R+11.7
Not yet ingested
- Civics
- —
Market trends
- HPI YoY
- ▲ 48.80%
- Current HPI
- 282.5624
- Rent YoY
- —
- Metro
- —
- State GDP YoY
- ▲ 1.68%
- F500 in state
- 34
Industry mix (Fortune 500 HQ in PA)
| Industry | F500 HQs | Revenue |
|---|---|---|
| Healthcare | 2 | $309B |
|
||
| Insurance | 2 | $27B |
|
||
| Telecommunications / Media | 1 | $124B |
|
||
| Industrial Distribution | 1 | $22B |
|
||
| Financial Services | 1 | $20B |
|
||
| Chemicals / Materials | 1 | $18B |
|
||
Price history
1 event — show timeline
- 2026-05-20 Listed $215,000 GSBR as distributed by MLS GRID
Property tax history
+2.3%/yrLatest (2026): $3,422 · +4.0% YoY. Source: county tax records.
Cash-flow waterfall
monthlySold comps — $/sqft
last 12 mo · ≤1 miLoading sold comps…