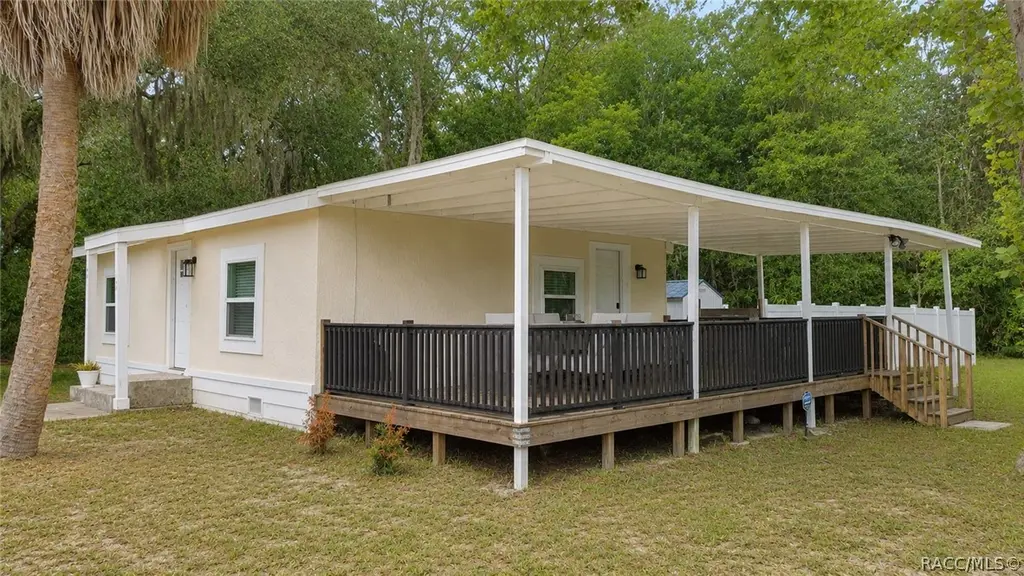
668 NE 8th Ave · Crystal River, FL
Flood risk 10/10 · Severe
- FEMA flood zone
- AE
- Chance of flooding over 30 yrs
- 0.99%
- Est. flood insurance / yr
- $1,737 – $8,500
Fire risk 4/10 · Minor
- Est. fire insurance / yr
- $947 – $1,759
Heat risk 10/10 · Severe
- Hot days now (above 109°F)
- 7 days/yr
- Hot days in 30 yrs
- 26 days/yr
Wind risk 9/10 · Severe
- Chance of severe wind over 30 yrs
- 99.0%
Air-quality risk 1/10 · Minimal
- Unhealthy air days now
- 0 days/yr
- Unhealthy air days in 30 yrs
- 0 days/yr
Risk factors via First Street. Map © Google.
Why this score? — see what drove the D+ grade
The composite is a weighted blend of 9 inputs, each scored 0–100. Each bar is that input's sub-score; the figure is the points it added to the 100-point composite (weight × sub-score).
- Cash flow +20.9/30.0
- DSCR +6.7/10.0
- 1% rule +5.5/10.0
- Schools +4.1/10.0
- Livability +3.3/5.0
- ARV discount +2.9/15.0
- Rent growth +2.5/5.0
- Condition / age +2.5/5.0
- Appreciation +0.0/10.0
$170,000
🖨 Deal sheet (PDF) 📄 Offer letter ✓ Due diligence
Listing remarks MLS
Charming remodeled beautiful, turn key home in the heart of Crystal River! This home offers 2 bed, 1bath and an extra room that could be used as an office or third bedroom. So much work has gone into this remodeled home. .. New roof, A/C, windows, sub flooring, laminate wood floors throughout, tile in wet areas, ceiling fans, outlet covers, cabinets, granite counter tops, back slash, stainless steel appliances even the kitchen sink is new! Fresh paint inside and out, and a new front entrance deck. This home sits on . 24 of an acre of land and is located close to a everything Crystal River has to offer! Shopping, restaurants, Down Town, Kings Bay and the Gulf of Mexico!
Key facts
- Quartz countertops
- Upgraded cabinetry
- New roof
Tags
Property features AI
Exterior
- Parking: Attached carport; Paved driveway; RV access/parking; Total of 1 parking space
- Utilities: Public water; Public sewer
- Home design: Single-family residence; One story
- Construction: Frame and stucco construction; Block foundation; Asphalt shingle roof; Built using typical residential materials
- Exterior features: Deck; Vinyl fencing; Shed(s); Corner lot; Wooded lot; Paved road frontage on a county road
Interior
- Kitchen: Dishwasher; Electric oven; Electric range; Microwave; Refrigerator
- Flooring: Tile flooring
- Bathrooms: 1 full bathroom
- Heating & cooling: Heat pump heating; Central electric air conditioning
- Interior features: Walk-in closet(s); Blinds, drapes and other window coverings; Double-pane windows
- Laundry & utility: Stacked washer and dryer
Neighborhood map
What this means for you Summary
Snapshot
- This is a 2-bed/1.0-bath single-family listed at $170k.
Deal economics
- At list price, monthly cash flow is $-189 ($-2k/yr) — negative.
- To cash-flow at today's rent, offer at most $137k (19.7% below list).
- Meets the 1% rule at list price ($2k rent vs $170k).
- Recommended offer: $137k (19.7% below list) — sets the bar for cash-flow.
- Cap rate 8.0% vs local median 2.1% in Crystal River — top-decile yield for the area; either an underpriced asset or a hidden risk that comps aren't pricing in. Stress-test before assuming the spread holds.
Location & tenants
- Location reads 66/100 on livability (#603 in FL) — a middle-class / working-renter tenant base. Strengths: crime A+, cost of living A+; Watch: health & safety C-, amenities F, commute F.
- Citrus (rural): math 49% / reading 50% proficiency, ranked #44 of 73 in FL (top 60%) — families likely to look elsewhere, expect single-tenant / working-renter base with shorter leases.
- Zoned schools: Crystal River Primary School (math 45% / reading 55%, grade D+, #1,070 of 2,144 statewide, top 51%, 654 students, 70% FRL); Crystal River Middle School (math 49% / reading 47%, grade C-, #286 of 571 statewide, top 50%, 900 students, 64% FRL); Crystal River High School (math 31% / reading 44%, grade F, #336 of 667 statewide, top 51%, 1,249 students, 56% FRL).
- Market conditions: 322 active listings in the ZIP; 5 comparable units currently listed for rent nearby; rentals at typical pace (median 22d on market — plan ~3-4 weeks tenant-placement turnaround); 2,443 units permitted in Citrus County in 2024 (0 in 5+ unit buildings).
- This rent runs 42% of the median local income ($51k/yr) — at the standard rent-burdened threshold; future hikes will face affordability resistance.
Forward outlook
- Local home prices are declining (-3.0%/yr); year-one equity from $1k of loan paydown is wiped out by about $5k of value loss. Plan a longer hold.
- Citrus County population projected to shrink 10% by 2050 — rents likely to lag national; underwrite the cash flow, not the appreciation.
Negotiation context
- It's been on market 31 days — a 3% lower offer ($165k) is reasonable based on typical stale-listing flexibility.
- 6 sale attempts since 21y ago with the ask held roughly flat each time — persistent listings suggest the price (not the market) is what's stuck; bring a comps-based counter.
- Current owner paid $140k; 21% above their basis — modest negotiation headroom, anchor on the comps not their cost.
Risks & watch-outs
- Watch-outs: flood insurance adds $427/mo; built in 1945 — expect roof / HVAC / electrical / plumbing capex.
- Climate carrying-cost: in FEMA flood zone AE (mandatory federal flood insurance); severe wind risk, 99% chance of damaging wind over 30y; extreme-heat days projected 7→26/yr by 2055 (HVAC capex compounding) — expect insurance premiums to compound above CPI over the hold.
Questions for the listing agent
- What do current leases actually rent for vs. the listed asking? Can we see a recent rent roll and the last 12 months of T-12 income?
- It's been on market 31 days. Have you received any prior offers? Is the seller open to a 20% concession, seller financing, or rate buy-down credit?
- Built in 1945 — when were the roof, HVAC, electrical panel, plumbing, and water heater last replaced?
- What's the actual annual flood-insurance premium (NFIP or private), and is the property in a SFHA with mandatory coverage?
- Is there a deadline driving the sale (1031 exchange, divorce, estate, relocation)? That informs how much negotiation room exists.
- Schools are D-rated, which usually means shorter tenancies and higher turnover. Who's the typical renter profile here, and what's been the actual vacancy rate?
- The area grade is low — what's the realistic commute time and amenity access for the typical tenant pool here? Any planned neighborhood developments (good or bad) we should know about?
- What's the average days-on-market for RENTAL listings here right now (not sales)? A rising rental-DOM trend means longer vacancies and softer asking-rent achievability than the comps imply.
- What's the recent tenant-quality profile in this submarket — average credit score on applications, eviction rate, late-payment / NSF rate, and stable-employment percentage? A property-management company in the area should have these aggregated.
- How much new for-sale + rental construction is in the pipeline within 1–3 miles? Heavy new supply typically softens prices + rents 12–24 months out; constrained supply supports both.
Investment metrics
- 1% rule
- 1.05% ✓
- Cap rate
- 7.97%
- Cash-on-cash
- 5.98%
- DSCR
- 1.27
- GRM
- 7.9
CMA / ARV
- ARV (on-the-fly)
- $154,368
- Comps found
- 6
Show comp detail 6 sales within ~0.75 mi
| Address | Dist | Beds/Ba | Sqft | Sold | Price | $/sf | Match |
|---|---|---|---|---|---|---|---|
| 1006 NE 7th Ave | 0.32mi | 2/1.0 | 875 (+14%) | 4mo | $148,000 | $169 | 58 |
| 167 NE 9th St | 0.62mi | 2/1.0 | 720 (-6%) | 4mo | $98,500 | $137 | 57 |
| 222 NE 4th Ave | 0.48mi | 1/1.0 (-1) | 676 (-12%) | 4mo | $175,000 | $259 | 49 |
| 654 NE 2nd St | 0.33mi | 2/1.0 | 667 (-13%) | 20mo | $140,000 | $210 | 46 |
| 326 NE 9th St | 0.49mi | 1/1.0 (-1) | 872 (+14%) | 10mo | $175,000 | $201 | 41 |
| 220 NE 7th Ter | 0.55mi | 2/1.0 | 660 (-14%) | 20mo | $97,500 | $148 | 34 |
Match score weights: distance 35% · size 25% · config 20% · recency 20%. Top-matched comps best support the ARV.
Projected returns pro-forma
-3.0% appreciation · 3.0% rent growth · sell at horizon
- IRR
- -24.1%
- Equity multiple
- 0.17×
- Total profit
- $-39,306
- Equity at exit
- $25,348
- IRR
- -18.8%
- Equity multiple
- -0.02×
- Total profit
- $-48,560
- Equity at exit
- $14,698
Cash invested: $47,600 (down + closing). Projections, not guarantees.
Landlord ↔ Tenant lean methodology
- Overall (STATE)
- 87 Strongly Landlord-Friendly
- State Florida
- 87 Strongly Landlord-Friendly · R+3
- County
- — inherits STATE
- City
- — inherits STATE
ZIP-level market 34428
- Home prices YoY
- -15.3%
- Active inventory
- 322
- Price-to-rent
- 7.9×
Monthly cashflow live
- Estimated rent
- $1,792 high interval (Pro) →
- Mortgage (P&I)
- −$891
- Tax from tax record
- −$216 /mo · $2,589/yr
- Insurance
- −$71
- Flood insurance flood zone
- −$427 /mo · $5,118/yr
- HOA
- −$0
- Vacancy / Maint / Mgmt
- −$376
- Net cashflow
- $-189
Break-even live
Sensitivity live
| Price | -10% $-93 | -5% $-141 | +0% $-189 | +5% $-237 | +10% $-285 |
|---|---|---|---|---|---|
| Rent | -10% $-331 | -5% $-260 | +0% $-189 | +5% $-118 | +10% $-48 |
| Rate | -1.0pp $-104 | -0.5pp $-146 | base $-189 | +0.5pp $-233 | +1.0pp $-278 |
UW: 25.0% down · 7.5% · 30yr · 1.5% tax · 5.0% vac · 8.0% maint · 8.0% mgmt
Financing live
Cash to close
- Down payment
- $42,500
- Closing costs
- $5,100
- Reserves months
- —
- Total cash needed
- —
Loan-product check · same deal, 3 products live
Conventional
25% down · 7.5% · 30yr
- Down + closing
- —
- Monthly P&I
- —
- Monthly cashflow
- —
- DSCR
- —
- Eligible?
- —
Personal DTI + credit; lowest rate.
DSCR
20% down · 8.5% · 30yr
- Down + closing
- —
- Monthly P&I
- —
- Monthly cashflow
- —
- DSCR
- —
- Eligible?
- —
No personal income docs; deal must DSCR.
Hard money
10% down · 12.0% · 12mo
- Down + closing
- —
- Monthly P&I
- —
- Monthly cashflow
- —
- DSCR
- —
- Eligible?
- —
Short-term bridge; refi at stabilization.
Rent comps 5 comps
| Address | Beds | Baths | Sqft | Rent | $/sqft | DOM | Units | Dist |
|---|---|---|---|---|---|---|---|---|
| 41 Beach Ln #3 Crystal River, FL | 1.0 | 1.5 | 760 | $1,800 | $2.37 | 22d | 1 | 0.83mi |
| 3371 N Bay Ave Crystal River, FL | 3.0 | 1.0 | 1008 | $1,750 | $1.74 | 22d | 1 | 1.35mi |
| 843 SE Mayo Dr Crystal River, FL | 1.0 | 1.0 | 616 | $1,350 | $2.19 | 22d | 1 | 1.41mi |
| 853 SE Mayo Dr Crystal River, FL | 1.0 | 1.0 | 616 | $1,500 | $2.44 | 22d | 1 | 1.42mi |
| 955 SE Mayo Dr Crystal River, FL | 1.0 | 1.0 | 616 | $1,425 | $2.31 | 22d | 1 | 1.42mi |
Listing history 31 events
-
2026-06-21days on market $170,000 Active 31 DOM
-
2026-06-19days on market $170,000 Active 29 DOM
-
2026-06-18days on market $170,000 Active 28 DOM
-
2026-06-17days on market $170,000 Active 27 DOM
-
2026-06-16days on market $170,000 Active 26 DOM
-
2026-06-15days on market $170,000 Active 25 DOM
-
2026-06-14days on market $170,000 Active 23 DOM
-
2026-06-13days on market $170,000 Active 22 DOM
-
2026-06-09days on market $170,000 Active 19 DOM
-
2026-06-08days on market $170,000 Active 18 DOM
-
2026-06-07days on market $170,000 Active 17 DOM
-
2026-06-03days on market $170,000 Active 13 DOM
-
2026-06-02days on market $170,000 Active 12 DOM
-
2026-06-01days on market $170,000 Active 11 DOM
-
2026-05-31days on market $170,000 Active 10 DOM
-
2026-05-30days on market $170,000 Active 9 DOM
-
2026-05-21$170,000 Active
-
2022-03-25soldstatus $140,000
-
2019-03-13soldstatus $65,000
-
2019-03-08soldstatus $65,000 679-char remark
Show marketing remark (678 chars)
Charming remodeled beautiful, turn key home in the heart of Crystal River! This home offers 2 bed, 1bath and an extra room that could be used as an office or third bedroom. So much work has gone into this remodeled home. .. New roof, A/C, windows, sub flooring, laminate wood floors throughout, tile in wet areas, ceiling fans, outlet covers, cabinets, granite counter tops, back slash, stainless steel appliances even the kitchen sink is new! Fresh paint inside and out, and a new front entrance deck. This home sits on . 24 of an acre of land and is located close to a everything Crystal River has to offer! Shopping, restaurants, Down Town, Kings Bay and the Gulf of Mexi. ..
-
2019-03-08soldstatus $65,000 678-char remark
Show marketing remark (678 chars)
Charming remodeled beautiful, turn key home in the heart of Crystal River! This home offers 2 bed, 1bath and an extra room that could be used as an office or third bedroom. So much work has gone into this remodeled home. .. New roof, A/C, windows, sub flooring, laminate wood floors throughout, tile in wet areas, ceiling fans, outlet covers, cabinets, granite counter tops, back slash, stainless steel appliances even the kitchen sink is new! Fresh paint inside and out, and a new front entrance deck. This home sits on . 24 of an acre of land and is located close to a everything Crystal River has to offer! Shopping, restaurants, Down Town, Kings Bay and the Gulf of Mexi. ..
-
2018-11-17$69,900 678-char remark
Show marketing remark (678 chars)
Charming remodeled beautiful, turn key home in the heart of Crystal River! This home offers 2 bed, 1bath and an extra room that could be used as an office or third bedroom. So much work has gone into this remodeled home. .. New roof, A/C, windows, sub flooring, laminate wood floors throughout, tile in wet areas, ceiling fans, outlet covers, cabinets, granite counter tops, back slash, stainless steel appliances even the kitchen sink is new! Fresh paint inside and out, and a new front entrance deck. This home sits on . 24 of an acre of land and is located close to a everything Crystal River has to offer! Shopping, restaurants, Down Town, Kings Bay and the Gulf of Mexi. ..
-
2018-11-16$69,900 679-char remark
Show marketing remark (679 chars)
Charming remodeled beautiful, turn key home in the heart of Crystal River! This home offers 2 bed, 1bath and an extra room that could be used as an office or third bedroom. So much work has gone into this remodeled home. .. New roof, A/C, windows, sub flooring, laminate wood floors throughout, tile in wet areas, ceiling fans, outlet covers, cabinets, granite counter tops, back slash, stainless steel appliances even the kitchen sink is new! Fresh paint inside and out, and a new front entrance deck. This home sits on . 24 of an acre of land and is located close to a everything Crystal River has to offer! Shopping, restaurants, Down Town, Kings Bay and the Gulf of Mexico!
-
2018-07-02soldstatus $36,000
-
2015-07-24soldstatus $35,000
-
2015-07-17soldstatus $35,000
-
2014-10-30$39,900
-
2009-11-23soldstatus $16,600
-
2009-09-28$19,900
-
2006-01-05historical
-
2005-08-23$175,000
ⓘ Source: listings_history table (triggers on properties + properties_extension) + one-shot
backfill from property_details.listing_events for pre-trigger history.
Tax reassessment forecast FL · Resets to sale price
- Current annual tax
- $2,589 · $216/mo
- Projected year-2 tax
- $2,589 · $216/mo
- Expected delta
- $0/yr ($0/mo · 0.0%)
ⓘ Screening estimate from a state-policy table — verify with the county assessor before closing.
Climate risk First Street
- Flood 10/10 Extreme FEMA zone AE · 99% chance over 30 yrs
- Wildfire 4/10 Moderate
- Heat 10/10 Extreme 7 d/yr ≥109°F today · 26 d/yr by 30 yrs out
- Wind 9/10 Extreme 99% chance of damaging wind over 30 yrs
- Air quality 1/10 Low 0 unhealthy d/yr today · 0 by 30 yrs out
Nearby sold comps map
Loading sold comps map…
Walkable amenities ~0.75 mi
Loading nearby amenities…
Taxation est. · year 1
- Rental income
- $21,500
- − Mortgage interest
- −$9,523
- − Property taxes
- −$2,589
- − Insurance
- −$5,968
- − Repairs & maintenance
- −$1,720
- − Management
- −$1,720
- − Depreciation
- −$4,945
- Taxable loss
- −$4,965
- Est. tax savings @ 24.0%
- +$1,192
- After-tax cash flow
- $-1,079/yr
For passive investors: Depreciation is non-cash, so a rental often shows a tax loss while cash-flowing — sheltering income. Rental losses are passive: they offset passive income freely, and up to $25,000/yr can offset ordinary (W-2) income if you actively participate and your MAGI is under $100k (phasing out to $0 by $150k); unused losses carry forward. On sale, claimed depreciation is recaptured at up to 25%, and gains may owe capital-gains tax (a 1031 exchange can defer both). Figures are a year-1 estimate at your 24.0% rate — not tax advice; consult a CPA.
Schools (NCES district)
- District
- Citrus
- NCES district ID
- 1200270
- Math proficiency
- 49% ▼ -10.00%
- Reading proficiency
- 50% ▼ -6.00%
- Median HH income
- $38,618
- Composite
- 41.28/100
- National rank
- #3519
- State rank
- #44 of 73 in FL
Livability — Crystal River
- Score
- 66/100
- State rank
- #603
- US rank
- #11564
Category grades
Schools grade is shown separately in the Schools card above.
Census & demographics
- Census place
- Crystal River, FL
- County
- Citrus County · 111,314 people
- City population
- 10,163
- Metro
- Homosassa Springs, FL
- Population (ZIP)
- 10,163
- Household income
- $50,779
- Rent vs Own
- Severe rent burden
- 264.0
Population outlook (Citrus County) Hauer SSP2
- Today (2025)
- 138,622 people
- By 2030
- 136,886 · -1.3%
- By 2040
- 132,009 · -4.8%
- By 2050
- 125,196 · -9.7%
- By 2075
- 108,570 · -21.7%
- By 2100
- 84,454 · -39.1%
Race, ethnicity, and origin ACS 2023
- Neighborhood character
- Predominantly White (88%)
- Race & ethnicity
- White 88% Two or more races 6% Hispanic / Latino 5% Asian 2%
- Common ancestry
- Lithuanian 3% Romanian 3% Slovak 2%
- Foreign-born
- 5% · Canada, Jamaica, South Korea
- Languages at home
- 96% English-only · Spanish 3%
Political lean MEDSL · Citrus
- 2024 margin
- Solid R (+45.9) · D 26.8% · R 72.6%
- 2008→2024 swing
- -29.8pp toward R · 2008: -16.1pp · 2024: -45.9pp
- All cycles
- 2024: R+45.9 2020: R+41.0 2016: R+39.7 2012: R+21.9 2008: R+16.1
Not yet ingested
- Civics
- —
Market trends
- HPI YoY
- ▼ -57.32%
- Current HPI
- 317.7637
- Rent YoY
- —
- Metro
- Homosassa Springs, FL
- State GDP YoY
- ▲ 3.28%
- F500 in state
- 36
Industry mix (Fortune 500 HQ in FL)
| Industry | F500 HQs | Revenue |
|---|---|---|
| Industrial Technology | 2 | $29B |
|
||
| Insurance | 2 | $17B |
|
||
| Retail | 1 | $60B |
|
||
| Technology Distribution | 1 | $58B |
|
||
| Homebuilding | 1 | $35B |
|
||
| Technology Manufacturing | 1 | $35B |
|
||
Price history
-2.9% since first listed15 events — show timeline
- 2026-05-21 Listed $170,000 RACC
- 2022-03-25 Sold (Public Records) $140,000 Public Records
- 2019-03-13 Sold (Public Records) $65,000 Public Records
- 2019-03-08 Sold (MLS) $65,000 Stellar MLS as Distributed by MLS Grid
- 2019-03-08 Sold (MLS) $65,000 RACC
- 2018-11-17 Listed $69,900 Stellar MLS as Distributed by MLS Grid
- 2018-11-16 Listed $69,900 RACC
- 2018-07-02 Sold (Public Records) $36,000 Public Records
- 2015-07-24 Sold (Public Records) $35,000 Public Records
- 2015-07-17 Sold (MLS) $35,000 RACC
- 2014-10-30 Listed $39,900 RACC
- 2009-11-23 Sold (MLS) $16,600 RACC
- 2009-09-28 Listed $19,900 RACC
- 2006-01-05 Listing Removed — Stellar MLS as Distributed by MLS Grid
- 2005-08-23 Listed $175,000 Stellar MLS as Distributed by MLS Grid
Property tax history
+16.6%/yrLatest (2025): $2,589 · -1.4% YoY. Source: county tax records.
Cash-flow waterfall
monthlySold comps — $/sqft
last 12 mo · ≤1 miLoading sold comps…