 🏗️ New Construction
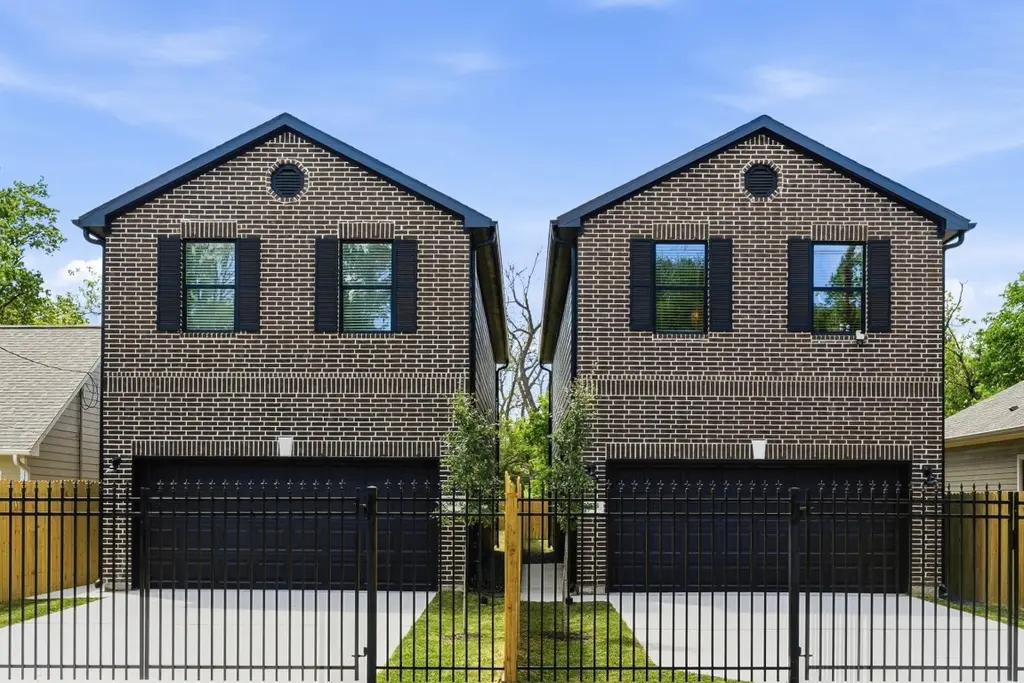
5803 Haight St Unit B · Houston, TX
Flood risk 5/10 · Moderate
- FEMA flood zone
- X (unshaded)
- Chance of flooding over 30 yrs
- 0.48%
- Est. flood insurance / yr
- $507 – $1,088
Fire risk 2/10 · Minimal
- Est. fire insurance / yr
- $1,222 – $2,270
Heat risk 9/10 · Severe
- Hot days now (above 110°F)
- 7 days/yr
- Hot days in 30 yrs
- 24 days/yr
Wind risk 9/10 · Severe
- Chance of severe wind over 30 yrs
- 99.0%
Air-quality risk 3/10 · Minor
- Unhealthy air days now
- 2 days/yr
- Unhealthy air days in 30 yrs
- 3 days/yr
Risk factors via First Street. Map © Google.
Why this score? — see what drove the D grade
The composite is a weighted blend of 9 inputs, each scored 0–100. Each bar is that input's sub-score; the figure is the points it added to the 100-point composite (weight × sub-score).
- Cash flow +10.3/30.0
- Appreciation +7.6/10.0
- ARV discount +7.5/15.0
- Livability +3.7/5.0
- DSCR +2.9/10.0
- Schools +2.7/10.0
- Condition / age +2.5/5.0
- Rent growth +2.1/5.0
- 1% rule +1.9/10.0
$274,000
🖨 Deal sheet (PDF) 📄 Offer letter ✓ Due diligence
Listing remarks
Move-in Ready! Welcome to 5803 Haight St Unit B — a brand-new townhome offering 3 beds, 2.5 baths, and modern design just minutes from the 610 Loop. Step inside to an open-concept layout with high ceilings, wood-style flooring, and a stunning kitchen featuring quartz counters, stainless steel appliances, and upgraded cabinetry. Upstairs, the spacious primary suite includes a dual-sink vanity and elegant finishes, with two additional bedrooms perfect for guests or a home office. Enjoy a fenced large backyard, 2-car garage, and no HOA — all at a competitive $274K price point. Located in a central area that’s seeing exciting new development, this home blends comfort, style, a
Key facts
- 3,249 sq ft lot
- 2 garage spots
- Built 2026
Property features AI
Finance
- Other: Builder: Tanava Construction LLC; Living area approximately 1,627; Lot dimensions approximately 130x25 (about 3,250 sq ft)
- Financial info: Lease not considered
Exterior
- Parking: Attached garage; 2 garage spaces
- Utilities: Public water; Public sewer
- Home design: Residential property; New construction (2026); East-facing; Slab foundation
- Construction: Brick and cement siding exterior; Built in 2026
- Exterior features: Fully fenced backyard; Back yard fencing; Asphalt road access; Composition roof
Interior
- Kitchen: Dishwasher; Free-standing range; Microwave; Disposal
- Bedrooms: Primary Bedroom (Second level, 18x15); Bedroom (Second level, 13x9); Bedroom (Second level, 11x9)
- Flooring: Carpet
- Bathrooms: 2 full bathrooms; 1 half bathroom; Primary bathroom (Second level, 11x8); Bathroom (First level, 7x4); Bathroom (Second level, 8x5)
- Heating & cooling: Central heating (gas); Central electric air conditioning
- Interior features: High ceilings; Kitchen island; Ceiling fan(s); Kitchen/dining combo; Low emissivity windows
- Laundry & utility: Gas dryer hookup
Neighborhood map
What this means for you Summary
Snapshot
- This is a 3-bed/2.5-bath land listed at $274k.
Deal economics
- At list price, monthly cash flow is $-152 ($-2k/yr) — negative.
- To cash-flow at today's rent, offer at most $247k (9.8% below list).
- To meet the 1% rule (rent ≥ 1% of price), the offer needs to be $188k (31.4% below list).
- Recommended offer: $188k (31.4% below list) — sets the bar for 1% rule.
- Cap rate 5.6% vs local median 3.2% in Houston — top-decile yield for the area; either an underpriced asset or a hidden risk that comps aren't pricing in. Stress-test before assuming the spread holds.
Location & tenants
- Location reads 74/100 on livability (#184 in TX, #4,771 nationally) — a middle-class / working-renter tenant base. Strengths: amenities A+, cost of living A+, housing A+; Watch: crime F.
- Houston ISD (urban): math 27% / reading 35% proficiency, ranked #593 of 826 in TX (top 72%) — families likely to look elsewhere, expect single-tenant / working-renter base with shorter leases; 71% free/reduced lunch — lower-income household profile, screen leases tightly.
- Zoned schools: Elmore El (math 12% / reading 14%, grade F, #4,152 of 4,322 statewide, top 96%, 532 students, 99% FRL); Key Middle (math 10% / reading 20%, grade F, #1,569 of 1,662 statewide, top 95%, 615 students, 100% FRL); Kashmere H S (math 14% / reading 22%, grade F, #1,445 of 1,632 statewide, top 89%, 725 students, 96% FRL) — zoned schools average 98% FRL vs 71% district-wide (27 pts higher); higher-poverty schools than district average — tighter screening recommended.
- Zoned-school proficiency averages 15% at this address vs 31% district-wide (-16 pts) — the specific schools serving this property underperform the Houston ISD average; the district grade overstates school quality for this exact location.
- Market conditions: Rents soft (-1.6%/yr); 355 active listings in the ZIP; 20 comparable units currently listed for rent nearby; rentals at typical pace (median 24d on market — plan ~3-4 weeks tenant-placement turnaround); lower-income renter base — watch delinquency; 29,883 units permitted in Harris County in 2024 (8,621 in 5+ unit buildings).
- At $1,879/mo this rent would consume 59% of the median local household income ($38k/yr) (locally 1177% of renters already pay >50% of income on rent) — very limited rent-growth headroom before tenants either downsize or default.
Forward outlook
- In year one you build about $16k of equity ($2k loan paydown + $14k appreciation (5.2% local appreciation)).
- Harris County population projected at +47% by 2050 — long-run rental-demand tailwind backs the buy-and-hold thesis.
- By year 3, paydown + projected appreciation supports a ~$40k cash-out refi (75% LTV) — recoverable capital for the next deal without selling this one.
Negotiation context
- Only 14 days on market — expect competitive offers; lowballing is unlikely to land.
Risks & watch-outs
- Climate carrying-cost: moderate flood risk; severe wind risk, 99% chance of damaging wind over 30y; extreme-heat days projected 7→24/yr by 2055 (HVAC capex compounding) — expect insurance premiums to compound above CPI over the hold.
Questions for the listing agent
- What do current leases actually rent for vs. the listed asking? Can we see a recent rent roll and the last 12 months of T-12 income?
- Is there a deadline driving the sale (1031 exchange, divorce, estate, relocation)? That informs how much negotiation room exists.
- Schools are D-rated, which usually means shorter tenancies and higher turnover. Who's the typical renter profile here, and what's been the actual vacancy rate?
- Crime grade is F in this area — have there been break-ins, vandalism, or insurance claims at this property in the last 3 years? What carrier currently insures it and at what premium?
- The area grade is low — what's the realistic commute time and amenity access for the typical tenant pool here? Any planned neighborhood developments (good or bad) we should know about?
- What's the average days-on-market for RENTAL listings here right now (not sales)? A rising rental-DOM trend means longer vacancies and softer asking-rent achievability than the comps imply.
- What's the recent tenant-quality profile in this submarket — average credit score on applications, eviction rate, late-payment / NSF rate, and stable-employment percentage? A property-management company in the area should have these aggregated.
- How much new for-sale + rental construction is in the pipeline within 1–3 miles? Heavy new supply typically softens prices + rents 12–24 months out; constrained supply supports both.
Investment metrics
- 1% rule
- 0.69% ✗
- Cap rate
- 5.63%
- Cash-on-cash
- -2.38%
- DSCR
- 0.89
- GRM
- 12.2
CMA / ARV
No comps found within radius.
Projected returns pro-forma
5.25% appreciation · 0.0% rent growth · sell at horizon
- IRR
- 10.5%
- Equity multiple
- 1.67×
- Total profit
- $51,676
- Equity at exit
- $159,366
- IRR
- 10.9%
- Equity multiple
- 3.00×
- Total profit
- $153,221
- Equity at exit
- $278,491
Cash invested: $76,720 (down + closing). Projections, not guarantees.
Landlord ↔ Tenant lean methodology
- Overall (STATE)
- 87 Strongly Landlord-Friendly
- State Texas
- 87 Strongly Landlord-Friendly · R+5
- County
- — inherits STATE
- City
- — inherits STATE
ZIP-level market 77028
- Home prices YoY
- 2.0%
- Rents YoY
- -1.6%
- Active inventory
- 355
- Price-to-rent
- 12.2×
Monthly cashflow live
- Estimated rent
- $1,879 high interval (Pro) →
- Mortgage (P&I)
- −$1,437
- Tax from tax record
- −$85 /mo · $1,026/yr
- Insurance
- −$114
- HOA
- −$0
- Vacancy / Maint / Mgmt
- −$395
- Net cashflow
- $-152
Break-even live
Sensitivity live
| Price | -10% $3 | -5% $-75 | +0% $-152 | +5% $-230 | +10% $-307 |
|---|---|---|---|---|---|
| Rent | -10% $-301 | -5% $-226 | +0% $-152 | +5% $-78 | +10% $-4 |
| Rate | -1.0pp $-14 | -0.5pp $-82 | base $-152 | +0.5pp $-223 | +1.0pp $-295 |
UW: 25.0% down · 7.5% · 30yr · 1.5% tax · 5.0% vac · 8.0% maint · 8.0% mgmt
Financing live
Cash to close
- Down payment
- $68,500
- Closing costs
- $8,220
- Reserves months
- —
- Total cash needed
- —
Loan-product check · same deal, 3 products live
Conventional
25% down · 7.5% · 30yr
- Down + closing
- —
- Monthly P&I
- —
- Monthly cashflow
- —
- DSCR
- —
- Eligible?
- —
Personal DTI + credit; lowest rate.
DSCR
20% down · 8.5% · 30yr
- Down + closing
- —
- Monthly P&I
- —
- Monthly cashflow
- —
- DSCR
- —
- Eligible?
- —
No personal income docs; deal must DSCR.
Hard money
10% down · 12.0% · 12mo
- Down + closing
- —
- Monthly P&I
- —
- Monthly cashflow
- —
- DSCR
- —
- Eligible?
- —
Short-term bridge; refi at stabilization.
Rent comps 20 comps
| Address | Beds | Baths | Sqft | Rent | $/sqft | DOM | Units | Dist |
|---|---|---|---|---|---|---|---|---|
| 5415 Bacher St Unit A Houston, TX | 3.0 | 2.5 | 1540 | $2,350 | $1.53 | 26d | 1 | 0.32mi |
| 5415 Bacher St Unit A Houston, TX | 3.0 | 2.5 | 1540 | $2,350 | $1.53 | 45d | 1 | 0.32mi |
| 8161 Tate St Houston, TX | 3.0 | 3.0 | 2184 | $1,850 | $0.85 | 45d | 1 | 0.33mi |
| 8119 Saint Louis St Houston, TX | 3.0 | 2.0 | 1090 | $1,349 | $1.24 | 45d | 1 | 0.37mi |
| 8117 Saint Louis St Houston, TX | 3.0 | 2.0 | 1090 | $1,335 | $1.22 | 24d | 1 | 0.37mi |
| 8135 Chateau St Houston, TX | 3.0 | 3.0 | 1610 | $1,645 | $1.02 | 13d | 1 | 0.41mi |
| 8158 Sunbury St Houston, TX | 3.0 | 2.5 | 1300 | $1,525 | $1.17 | 26d | 1 | 0.47mi |
| 5426 E Houston Rd Unit A Houston, TX | 3.0 | 2.5 | 1608 | $1,675 | $1.04 | 1d | 1 | 0.48mi |
| 7956 Bonaire St Unit B Houston, TX | 3.0 | 2.5 | 1498 | $2,150 | $1.44 | 45d | 1 | 0.48mi |
| 7956 Bonaire St Unit A Houston, TX | 3.0 | 2.5 | 1498 | $2,050 | $1.37 | 1d | 1 | 0.48mi |
| 7839 Sandy St Houston, TX | 3.0 | 2.0 | 1300 | $1,575 | $1.21 | 1d | 1 | 0.57mi |
| 5217 E Houston Rd Unit A Houston, TX | 3.0 | 2.5 | 1608 | $1,700 | $1.06 | 1d | 1 | 0.58mi |
| 7966 Henson St Unit B Houston, TX | 3.0 | 2.0 | 1608 | $1,410 | $0.88 | 45d | 1 | 0.66mi |
| 7947 Henson St Houston, TX | 3.0 | 2.0 | 1090 | $1,349 | $1.24 | 7d | 1 | 0.70mi |
| 7945 Henson St Houston, TX | 3.0 | 2.0 | 1300 | $1,665 | $1.28 | 1d | 1 | 0.70mi |
| 7830 Nashville St Houston, TX | 3.0 | 2.0 | 1175 | $1,800 | $1.53 | 9d | 1 | 0.85mi |
| 7973 Ritz St Houston, TX | 3.0 | 2.0 | 1076 | $2,250 | $2.09 | 9d | 1 | 0.88mi |
| 7426 Miley St Houston, TX | 4.0 | 2.0 | 2095 | $1,650 | $0.79 | 26d | 1 | 1.12mi |
| 7600 E Houston Rd Houston, TX | 1.0–3.0 | 1.0–2.0 | 1017 | $1,436 | $1.41 | 15d | 8 | 1.26mi |
| 8113 Denton St Houston, TX | 3.0 | 2.0 | 1150 | $1,750 | $1.52 | 45d | 1 | 1.47mi |
Listing history 3 events
-
2026-04-25status Pending
-
2026-04-14historical Active Under Contract
-
2026-04-10$274,000 Active
ⓘ Source: listings_history table (triggers on properties + properties_extension) + one-shot
backfill from property_details.listing_events for pre-trigger history.
Tax reassessment forecast TX · Resets to sale price
- Current annual tax
- $1,026 · $85/mo
- Projected year-2 tax
- $5,014 · $418/mo
- Expected delta
- +$3,989/yr (+$332/mo · 388.9%)
ⓘ Screening estimate from a state-policy table — verify with the county assessor before closing.
Climate risk First Street
- Flood 5/10 Major FEMA zone X (unshaded) · 48% chance over 30 yrs
- Wildfire 2/10 Low
- Heat 9/10 Extreme 7 d/yr ≥110°F today · 24 d/yr by 30 yrs out
- Wind 9/10 Extreme 99% chance of damaging wind over 30 yrs
- Air quality 3/10 Moderate 2 unhealthy d/yr today · 3 by 30 yrs out
Nearby sold comps map
Loading sold comps map…
Walkable amenities ~0.75 mi
Loading nearby amenities…
Taxation est. · year 1
- Rental income
- $22,548
- − Mortgage interest
- −$15,348
- − Property taxes
- −$1,026
- − Insurance
- −$1,370
- − Repairs & maintenance
- −$1,804
- − Management
- −$1,804
- − Depreciation
- −$7,971
- Taxable loss
- −$6,775
- Est. tax savings @ 24.0%
- +$1,626
- After-tax cash flow
- $-200/yr
For passive investors: Depreciation is non-cash, so a rental often shows a tax loss while cash-flowing — sheltering income. Rental losses are passive: they offset passive income freely, and up to $25,000/yr can offset ordinary (W-2) income if you actively participate and your MAGI is under $100k (phasing out to $0 by $150k); unused losses carry forward. On sale, claimed depreciation is recaptured at up to 25%, and gains may owe capital-gains tax (a 1031 exchange can defer both). Figures are a year-1 estimate at your 24.0% rate — not tax advice; consult a CPA.
Schools (NCES district)
- District
- Houston ISD
- NCES district ID
- 4823640
- Math proficiency
- 27% ▼ -18.00%
- Reading proficiency
- 35% ▼ -6.00%
- Median HH income
- $46,054
- Composite
- 26.63/100
- National rank
- #7173
- State rank
- #593 of 826 in TX
Livability — Houston
- Score
- 74/100
- State rank
- #184
- US rank
- #4771
Category grades
Schools grade is shown separately in the Schools card above.
Census & demographics
- Census place
- Houston, TX
- County
- Harris County · 4,702,590 people
- City population
- 3,226,434
- Metro
- Houston-The Woodlands-Sugar Land, TX
- Population (ZIP)
- 19,109
- Household income
- $38,357
- Rent vs Own
- Severe rent burden
- 1177.0
Population outlook (Harris County) Hauer SSP2
- Today (2025)
- 5,571,493 people
- By 2030
- 6,089,821 · +9.3%
- By 2040
- 7,142,806 · +28.2%
- By 2050
- 8,185,864 · +46.9%
- By 2075
- 10,574,329 · +89.8%
- By 2100
- 12,109,958 · +117.4%
Race, ethnicity, and origin ACS 2023
- Neighborhood character
- Majority Black (57%)
- Race & ethnicity
- Black 57% Hispanic / Latino 41% Two or more races 15% White 2%
- Hispanic origin (detail)
- Mexican 36%
- Foreign-born
- 13% · Canada
- Languages at home
- 61% English-only · Spanish 38%
Political lean MEDSL · Harris
- 2024 margin
- Lean D (+5.5) · D 52.0% · R 46.4% · Other 1.6%
- 2008→2024 swing
- +3.9pp toward D · 2008: 1.6pp · 2024: 5.5pp
- All cycles
- 2024: D+5.5 2020: D+13.3 2016: D+12.4 2012: D+0.1 2008: D+1.6
Not yet ingested
- Civics
- —
Market trends
- HPI YoY
- ▲ 5.25%
- Current HPI
- 267.7798
- Rent YoY
- ▼ -1.55%
- Metro
- Houston-The Woodlands-Sugar Land, TX
- State GDP YoY
- ▲ 3.95%
- F500 in state
- 110
Industry mix (Fortune 500 HQ in TX)
| Industry | F500 HQs | Revenue |
|---|---|---|
| Energy | 16 | $1,198B |
|
||
| Technology | 5 | $198B |
|
||
| Engineering / Construction | 4 | $72B |
|
||
| Energy Services | 3 | $60B |
|
||
| Utilities | 3 | $41B |
|
||
| Healthcare | 2 | $330B |
|
||
Price history
3 events — show timeline
- 2026-04-25 Pending — HARMLS
- 2026-04-14 Contingent — HARMLS
- 2026-04-10 Listed $274,000 HARMLS
Cash-flow waterfall
monthlySold comps — $/sqft
last 12 mo · ≤1 miLoading sold comps…