1500 W Esplanade Ave Unit 21G · Kenner, LA
Flood risk No data
- FEMA flood zone
- —
- Chance of flooding over 30 yrs
- —
- Est. flood insurance / yr
- —
Fire risk No data
- Est. fire insurance / yr
- —
Heat risk No data
- Hot days now (above threshold)
- —
- Hot days in 30 yrs
- —
Wind risk No data
- Chance of severe wind over 30 yrs
- —
Air-quality risk No data
- Unhealthy air days now
- —
- Unhealthy air days in 30 yrs
- —
Risk factors via First Street. Map © Google.
Why this score? — see what drove the C+ grade
The composite is a weighted blend of 9 inputs, each scored 0–100. Each bar is that input's sub-score; the figure is the points it added to the 100-point composite (weight × sub-score).
- Cash flow +19.1/30.0
- ARV discount +15.0/15.0
- 1% rule +10.0/10.0
- DSCR +6.0/10.0
- Livability +3.9/5.0
- Schools +2.5/10.0
- Condition / age +2.2/5.0
- Rent growth +1.5/5.0
- Appreciation +0.0/10.0
$103,800
🖨 Deal sheet 📄 Offer letter ✓ Due diligence
Listing remarks MLS
Opportunity awaits in this three bedroom, two bath condo. Take a drive by and see if this may be your next investment. * * * SPECIAL NOTES: (1) This is a CASH ONLY transaction. (2) Seller to pay Taxes, HOA, and Municipal/Utility Liens. (3) Please read the Auction disclaimers carefully before placing a bid or submitting an offer. * * * Buyer to verify special assessment, if any.
Key facts
- $672 HOA
- Parking
- Built 1985
Neighborhood map
What this means for you Summary
Snapshot
- This is a 3-bed/2.0-bath condo listed at $104k. Condition is rated fair.
Deal economics
- At list price, monthly cash flow is $111 ($1k/yr) — positive.
- The deal already cash-flows at list — no discount required.
- Meets the 1% rule at list price ($2k rent vs $104k).
- Recommended offer: $94k (9.0% below list) — sets the bar for market timing.
- Cap rate 7.6% vs local median 5.3% in Kenner — top-decile yield for the area; either an underpriced asset or a hidden risk that comps aren't pricing in. Stress-test before assuming the spread holds.
Location & tenants
- Location reads 78/100 on livability (#6 in LA, #2,414 nationally) — a middle-class / working-renter tenant base. Strengths: cost of living A+, housing A+, health & safety A+; Watch: amenities C-, employment C-, crime D.
- Jefferson Parish (suburban): math 24% / reading 34% proficiency, ranked #44 of 98 in LA (top 45%) — low school quality limits family demand, transient renter base, plan for 1-2y turnover; 70% free/reduced lunch — lower-income household profile, screen leases tightly.
- Market conditions: Rents falling (-4.2%/yr); 292 active listings in the ZIP; 40 comparable units currently listed for rent nearby; rentals at typical pace (median 24d on market — plan ~3-4 weeks tenant-placement turnaround); 48% of comp listings sitting > 30 days — soft ceiling on asking rent; 518 units permitted in Jefferson Parish in 2024 (43 in 5+ unit buildings).
- This rent runs 34% of the median local income ($67k/yr) — at the standard rent-burdened threshold; future hikes will face affordability resistance.
Forward outlook
- Local home prices are declining (-3.0%/yr); year-one equity from $718 of loan paydown is wiped out by about $3k of value loss. Plan a longer hold.
Negotiation context
- It's been on market 97 days — a 9% lower offer ($94k) is reasonable based on typical stale-listing flexibility.
- 4 sale attempts since 3y ago with the ask held roughly flat each time — persistent listings suggest the price (not the market) is what's stuck; bring a comps-based counter.
Risks & watch-outs
- Watch-outs: HOA is 35% of rent.
Questions for the listing agent
- It's been on market 97 days. Have you received any prior offers? Is the seller open to a 9% concession, seller financing, or rate buy-down credit?
- Have any recent inspections been done? Can we get a copy of the seller's disclosures and any deferred-maintenance estimates?
- What does the HOA fee cover, when was the last increase, and are there any pending special assessments or reserve-fund shortfalls?
- Any open or pending special assessments — roof, HVAC, plumbing, elevator, façade? What's the per-unit balance and payoff schedule, and is the seller paying it off at close or rolling it to the buyer?
- Why hasn't it sold? Are there any deal-killer items the seller is aware of (foundation, flood, title, zoning, code violations)?
- Is there a deadline driving the sale (1031 exchange, divorce, estate, relocation)? That informs how much negotiation room exists.
- Crime grade is D in this area — have there been break-ins, vandalism, or insurance claims at this property in the last 3 years? What carrier currently insures it and at what premium?
- What's the average days-on-market for RENTAL listings here right now (not sales)? A rising rental-DOM trend means longer vacancies and softer asking-rent achievability than the comps imply.
- What's the recent tenant-quality profile in this submarket — average credit score on applications, eviction rate, late-payment / NSF rate, and stable-employment percentage? A property-management company in the area should have these aggregated.
- How much new apartment / multifamily construction is in the pipeline within 1–3 miles? Heavy new supply (>2% of stock underway) typically softens rents 12–24 months out; light construction supports rent growth.
Investment metrics
- 1% rule
- 1.83% ✓
- Cap rate
- 7.58%
- Cash-on-cash
- 4.59%
- DSCR
- 1.20
- GRM
- 4.6
CMA / ARV
- ARV (median comp)
- $157,274
- List price
- $103,800
- Delta
- -34.00%
- Verdict
- UNDERPRICED
- Comps
- 20 within 1.0 mi
Projected returns pro-forma
-3.0% appreciation · 0.0% rent growth · sell at horizon
- IRR
- -15.1%
- Equity multiple
- 0.49×
- Total profit
- $-14,868
- Equity at exit
- $15,477
- IRR
- -21.2%
- Equity multiple
- 0.19×
- Total profit
- $-23,552
- Equity at exit
- $8,975
Cash invested: $29,064 (down + closing). Projections, not guarantees.
Landlord ↔ Tenant lean methodology
- Overall (STATE)
- 90 Strongly Landlord-Friendly
- State Louisiana
- 90 Strongly Landlord-Friendly · R+12
- County
- — inherits STATE
- City
- — inherits STATE
ZIP-level market 70065
- Rents YoY
- -4.2%
- Active inventory
- 292
- Price-to-rent
- 4.6×
Monthly cashflow live
- Estimated rent
- $1,899 high interval (Pro) →
- Mortgage (P&I)
- −$544
- Tax est. 1.5%
- −$130 /mo · $1,557/yr
- Insurance
- −$43
- HOA
- −$672
- Vacancy / Maint / Mgmt
- −$399
- Net cashflow
- $111
Break-even live
UW: 25.0% down · 7.5% · 30yr · 1.5% tax · 5.0% vac · 8.0% maint · 8.0% mgmt
Financing live
Cash to close
- Down payment
- $25,950
- Closing costs
- $3,114
- Reserves months
- —
- Total cash needed
- —
Loan-product check · same deal, 3 products live
Conventional
25% down · 7.5% · 30yr
- Down + closing
- —
- Monthly P&I
- —
- Monthly cashflow
- —
- DSCR
- —
- Eligible?
- —
Personal DTI + credit; lowest rate.
DSCR
20% down · 8.5% · 30yr
- Down + closing
- —
- Monthly P&I
- —
- Monthly cashflow
- —
- DSCR
- —
- Eligible?
- —
No personal income docs; deal must DSCR.
Hard money
10% down · 12.0% · 12mo
- Down + closing
- —
- Monthly P&I
- —
- Monthly cashflow
- —
- DSCR
- —
- Eligible?
- —
Short-term bridge; refi at stabilization.
Rent comps 40 comps
| Address | Beds | Baths | Sqft | Rent | $/sqft | DOM | Units | Dist |
|---|---|---|---|---|---|---|---|---|
| 1500 W Esplanade Ave Kenner, LA | 2.0–3.0 | 2.0 | 1587 | $2,000 | $1.26 | 43d | 1 | 0.09mi |
| 1500 W Esplanade Ave Unit 29D Kenner, LA | 3.0 | 2.0 | 1725 | $1,900 | $1.10 | 1d | 1 | 0.09mi |
| 1500 W Esplanade Ave Kenner, LA | 3.0 | 2.0 | 1725 | $1,750 | $1.01 | 2d | 2 | 0.09mi |
| 1400 W Esplanade Ave Kenner, LA | 2.0 | 1.0–2.5 | 801 | $1,370 | $1.71 | 43d | 1 | 0.12mi |
| 3611 Arizona Ave Kenner, LA | 4.0 | 2.0 | 1287 | $1,900 | $1.48 | 4d | 1 | 0.17mi |
| 3423 Delaware Ave Kenner, LA | 4.0 | 2.0 | 1215 | $1,800 | $1.48 | 4d | 1 | 0.40mi |
| 3345 Cannes Pl Kenner, LA | 3.0 | 2.0 | 1923 | $2,700 | $1.40 | 43d | 1 | 0.45mi |
| 3318 Cannes Pl Kenner, LA | 3.0 | 2.0 | 1700 | $2,100 | $1.24 | 43d | 1 | 0.47mi |
| 3308 Delaware Ave Unit C Kenner, LA | 2.0 | 1.5 | 1125 | $1,400 | $1.24 | 43d | 1 | 0.50mi |
| 3304 Delaware Ave Unit B Kenner, LA | 2.0 | 1.5 | 1100 | $1,295 | $1.18 | 4d | 1 | 0.51mi |
| 3136 Lexington Ave Kenner, LA | 4.0 | 3.0 | 1722 | $2,300 | $1.34 | 23d | 1 | 0.62mi |
| 1516 Mayfield St Kenner, LA | 3.0 | 2.0 | 1407 | $1,900 | $1.35 | 43d | 1 | 0.68mi |
| 1516 Mayfield St Kenner, LA | 3.0 | 2.0 | 1407 | $1,900 | $1.35 | 44d | 1 | 0.68mi |
| 3127 Marietta St Kenner, LA | 3.0 | 1.0 | 1600 | $1,600 | $1.00 | 43d | 1 | 0.68mi |
| 4018 Arkansas Ave Kenner, LA | 3.0 | 2.0 | 1200 | $1,800 | $1.50 | 3d | 1 | 0.70mi |
| 49 Antigua Dr Unit C Kenner, LA | 2.0 | 1.5 | 1150 | $1,450 | $1.26 | 43d | 1 | 0.75mi |
| 53 Antigua Dr Unit D Kenner, LA | 2.0 | 1.5 | 1325 | $1,500 | $1.13 | 23d | 1 | 0.76mi |
| 215 Avant Garde Cir Kenner, LA | 2.0 | 2.0 | 1200 | $1,500 | $1.25 | 2d | 1 | 0.77mi |
| 1617 Newport Pl #23 Kenner, LA | 2.0 | 1.5 | 1125 | $1,400 | $1.24 | 43d | 1 | 0.78mi |
| 1617 Newport Pl #23 Kenner, LA | 2.0 | 1.5 | 1125 | $1,395 | $1.24 | 4d | 1 | 0.78mi |
| 187 Avant Garde Cir #187 Kenner, LA | 2.0 | 1.5 | 1050 | $1,500 | $1.43 | 14d | 1 | 0.78mi |
| 1620 Newport Pl Kenner, LA | 3.0 | 2.0 | 1450 | $1,550 | $1.07 | 4d | 1 | 0.80mi |
| 1616 Newport Pl Unit A Kenner, LA | 3.0 | 2.0 | 1100 | $1,500 | $1.36 | 43d | 1 | 0.80mi |
| 61 Emile Ave Kenner, LA | 3.0 | 2.0 | 1450 | $1,900 | $1.31 | 44d | 1 | 0.81mi |
| 1600 Newport Pl #4 Kenner, LA | 3.0 | 2.0 | 1400 | $1,550 | $1.11 | 3d | 1 | 0.81mi |
| 1621 42nd St Kenner, LA | 3.0 | 2.0 | 1550 | $1,550 | $1.00 | 43d | 1 | 0.83mi |
| 4101 Delaware Ave Kenner, LA | 2.0 | 1.5 | 1100 | $1,499 | $1.36 | 43d | 1 | 0.84mi |
| 4101 Delaware Ave #6 Kenner, LA | 2.0 | 1.5 | 1050 | $1,350 | $1.29 | 23d | 1 | 0.84mi |
| 1625 42nd St Kenner, LA | 3.0 | 2.0 | 1550 | $1,550 | $1.00 | 43d | 1 | 0.84mi |
| 3245 Iowa Ave Kenner, LA | 4.0 | 2.0 | 1800 | $2,300 | $1.28 | 21d | 1 | 0.86mi |
| 1717 42nd St Unit D Kenner, LA | 3.0 | 2.0 | 1380 | $1,550 | $1.12 | 43d | 1 | 0.88mi |
| 4129 Chateau Blvd Unit C Kenner, LA | 2.0 | 1.5 | 1400 | $1,425 | $1.02 | 4d | 1 | 0.95mi |
| 2921 Indiana Ave Unit 3 Kenner, LA | 2.0 | 1.5 | 1300 | $1,395 | $1.07 | 3d | 1 | 1.01mi |
| 4204 Chateau Blvd Unit A Kenner, LA | 2.0 | 1.5 | 1100 | $1,300 | $1.18 | 43d | 1 | 1.02mi |
| 3608 E Louisiana State Dr Kenner, LA | 3.0 | 2.0 | 1800 | $2,275 | $1.26 | 1d | 1 | 1.02mi |
| 3101 Kansas Ave Kenner, LA | 3.0 | 2.0 | 1500 | $2,000 | $1.33 | 14d | 1 | 1.02mi |
| 4144 Georgia Ave Unit D Kenner, LA | 2.0 | 2.0 | 1050 | $1,450 | $1.38 | 23d | 1 | 1.03mi |
| 4145 Idaho Ave Unit D Kenner, LA | 2.0 | 2.5 | 1200 | $1,550 | $1.29 | 43d | 1 | 1.04mi |
| 4204 Asher Ct Apt D Kenner, LA | 2.0 | 1.5 | 1250 | $1,250 | $1.00 | 14d | 1 | 1.06mi |
| 3120 Phoenix St Unit D Kenner, LA | 2.0 | 1.5 | 1075 | $1,100 | $1.02 | 43d | 1 | 1.09mi |
HOA detail condo
- Monthly dues
- $672 · $8,064/yr
- ⚠ Special-assessment mentions
-
…Please read the Auction disclaimers carefully before placing a bid or submitting an offer. * * * Buyer to verify special assessment, if any.
Listing history 21 events
-
2026-06-18days on market $103,800 Active 97 DOM
-
2026-06-17days on market $103,800 Active 96 DOM
-
2026-06-16days on market $103,800 Active 95 DOM
-
2026-06-15days on market $103,800 Active 94 DOM
-
2026-06-13days on market $103,800 Active 92 DOM
-
2026-06-10days on market $103,800 Active 89 DOM
-
2026-06-09days on market $103,800 Active 88 DOM
-
2026-06-08days on market $103,800 Active 87 DOM
-
2026-06-07days on market $103,800 Active 86 DOM
-
2026-06-03days on market $103,800 Active 82 DOM
-
2026-06-02days on market $103,800 Active 81 DOM
-
2026-06-01days on market $103,800 Active 80 DOM
-
2026-05-31days on market $103,800 Active 79 DOM
-
2026-03-13$103,800 Active 385-char remark
Show marketing remark (375 chars)
Opportunity awaits in this three bedroom, two bath condo. Take a drive by and see if this may be your next investment. ***SPECIAL NOTES: (1) This is a CASH ONLY transaction. (2) Seller to pay Taxes, HOA, and Municipal/Utility Liens. (3) Please read the Auction disclaimers carefully before placing a bid or submitting an offer. *** Buyer to verify special assessment, if any.
-
2026-03-13$103,800 Active 375-char remark
Show marketing remark (375 chars)
Opportunity awaits in this three bedroom, two bath condo. Take a drive by and see if this may be your next investment. ***SPECIAL NOTES: (1) This is a CASH ONLY transaction. (2) Seller to pay Taxes, HOA, and Municipal/Utility Liens. (3) Please read the Auction disclaimers carefully before placing a bid or submitting an offer. *** Buyer to verify special assessment, if any.
-
2023-08-07soldstatus $156,000 Closed
-
2023-05-03historical Active Under Contract
-
2023-04-07price $153,900
-
2023-03-31price $156,900
-
2023-03-13$159,500 Active
-
2023-03-13$153,900
ⓘ Source: listings_history table (triggers on properties + properties_extension) + one-shot
backfill from property_details.listing_events for pre-trigger history.
Nearby sold comps map
Loading sold comps map…
Walkable amenities ~0.75 mi
Loading nearby amenities…
Taxation est. · year 1
- Rental income
- $22,791
- − Mortgage interest
- −$5,814
- − Property taxes
- −$1,557
- − Insurance
- −$519
- − Repairs & maintenance
- −$1,823
- − Management
- −$1,823
- − HOA
- −$8,064
- − Depreciation
- −$3,020
- Taxable income
- $171
- Est. tax owed @ 24.0%
- −$41
- After-tax cash flow
- $1,292/yr
For passive investors: Depreciation is non-cash, so a rental often shows a tax loss while cash-flowing — sheltering income. Rental losses are passive: they offset passive income freely, and up to $25,000/yr can offset ordinary (W-2) income if you actively participate and your MAGI is under $100k (phasing out to $0 by $150k); unused losses carry forward. On sale, claimed depreciation is recaptured at up to 25%, and gains may owe capital-gains tax (a 1031 exchange can defer both). Figures are a year-1 estimate at your 24.0% rate — not tax advice; consult a CPA.
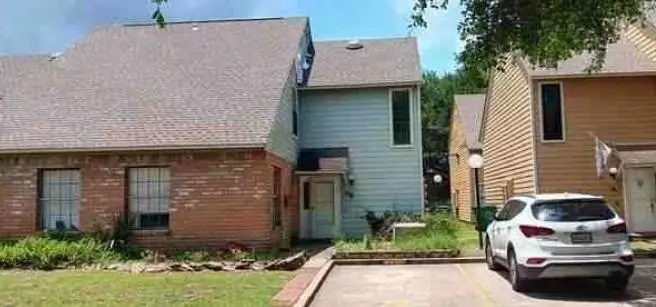
Condition & rehab AI · 6 photos
This three-bedroom, two-bath condo requires significant repairs and maintenance, particularly to the roof and exterior siding. Addressing these issues will substantially increase its value for resale or rental.
Repairs flagged
- Major roof — The roof has visible damage, indicating a major repair is needed.
- Major exterior siding — The siding is in poor condition, with peeling paint and discoloration.
- Major landscaping — The landscaping is overgrown and unkempt, requiring significant maintenance.
Value-add opportunities
- Both repair roof — A repaired roof will significantly increase the home's value, both for resale and rental.
- Both paint exterior siding — Fresh paint will improve the home's curb appeal and increase its value.
- Both trim and maintain landscaping — A well-maintained yard will enhance the home's curb appeal and attract potential buyers/tenants.
Renovation cost estimate screening
| Repair item | Severity | Est. cost |
|---|---|---|
| roof · The roof has visible damage, indicating a major repair is needed. | Major | $15,000–50,000 |
| exterior siding · The siding is in poor condition, with peeling paint and discoloration. | Major | $15,000–50,000 |
| landscaping · The landscaping is overgrown and unkempt, requiring significant maintenance. | Major | $15,000–50,000 |
| Total estimated repair cost · 3 items | $45,000–150,000 |
Value-add ROI direction
- Both repair roof — A repaired roof will significantly increase the home's value, both for resale and rental. ↑
- Both paint exterior siding — Fresh paint will improve the home's curb appeal and increase its value. ↑
- Both trim and maintain landscaping — A well-maintained yard will enhance the home's curb appeal and attract potential buyers/tenants. ↑
ⓘ Cost ranges are severity-bucket heuristics (US national rule-of-thumb). Get contractor quotes + a written scope before underwriting a rehab budget.
Schools (NCES district)
- District
- Jefferson Parish
- NCES district ID
- 2200840
- Math proficiency
- 24% ▼ -36.00%
- Reading proficiency
- 34% ▼ -30.00%
- Median HH income
- $48,421
- Composite
- 25.19/100
- National rank
- #7511
- State rank
- #44 of 98 in LA
Livability — Kenner
- Score
- 78/100
- State rank
- #6
- US rank
- #2414
Category grades
Schools grade is shown separately in the Schools card above.
Census & demographics
- Census place
- Kenner, LA
- County
- Jefferson Parish · 426,999 people
- City population
- 66,707
- Metro
- New Orleans-Metairie, LA
- Population (ZIP)
- 48,936
- Household income
- $67,285
- Rent vs Own
- Severe rent burden
- 1906.0
Population outlook (Jefferson County) Hauer SSP2
- Today (2025)
- 451,696 people
- By 2030
- 455,451 · +0.8%
- By 2040
- 458,308 · +1.5%
- By 2050
- 461,031 · +2.1%
- By 2075
- 476,351 · +5.5%
- By 2100
- 499,377 · +10.6%
Race, ethnicity, and origin ACS 2023
- Neighborhood character
- Diverse neighborhood (Simpson 0.69)
- Race & ethnicity
- White 47% Hispanic / Latino 27% Two or more races 15% Black 15% Asian 6%
- Hispanic origin (detail)
- Mexican 2% Puerto Rican 3% Cuban 2%
- Common ancestry
- Lithuanian 9% Slovak 1% Italian 1%
- Foreign-born
- 19% · Canada, China, Vietnam
- Languages at home
- 72% English-only · Spanish 21% Other Indo-European 3% Arabic 1%
Political lean MEDSL · Jefferson
- 2024 margin
- R (+12.9) · D 42.5% · R 55.5% · Other 2.1%
- 2008→2024 swing
- +13.6pp toward D · 2008: -26.6pp · 2024: -12.9pp
- All cycles
- 2024: R+12.9 2020: R+11.1 2016: R+14.8 2012: R+18.4 2008: R+26.6
Not yet ingested
- Civics
- —
Market trends
- HPI YoY
- ▼ -214.79%
- Current HPI
- 139.5115
- Rent YoY
- ▼ -4.19%
- Metro
- New Orleans-Metairie, LA
- State GDP YoY
- ▲ 3.29%
- F500 in state
- 10
Industry mix (Fortune 500 HQ in LA)
| Industry | F500 HQs | Revenue |
|---|---|---|
| Telecommunications | 2 | $23B |
|
||
| Utilities | 1 | $12B |
|
||
| Wholesale / Distribution | 1 | $5B |
|
||
| Advertising | 1 | $2B |
|
||
Price history
-34.9% since first listed8 events — show timeline
- 2026-03-13 Listed $103,800 AcadianaMLS
- 2026-03-13 Listed $103,800 GSREIN
- 2023-08-07 Sold (MLS) $156,000 GSREIN
- 2023-05-03 Contingent — GSREIN
- 2023-04-07 Price Changed $153,900 GSREIN
- 2023-03-31 Price Changed $156,900 GSREIN
- 2023-03-13 Listed $153,900 AcadianaMLS
- 2023-03-13 Listed $159,500 GSREIN
Cash-flow waterfall
monthlySold comps — $/sqft
last 12 mo · ≤1 miLoading sold comps…