 Fourplex
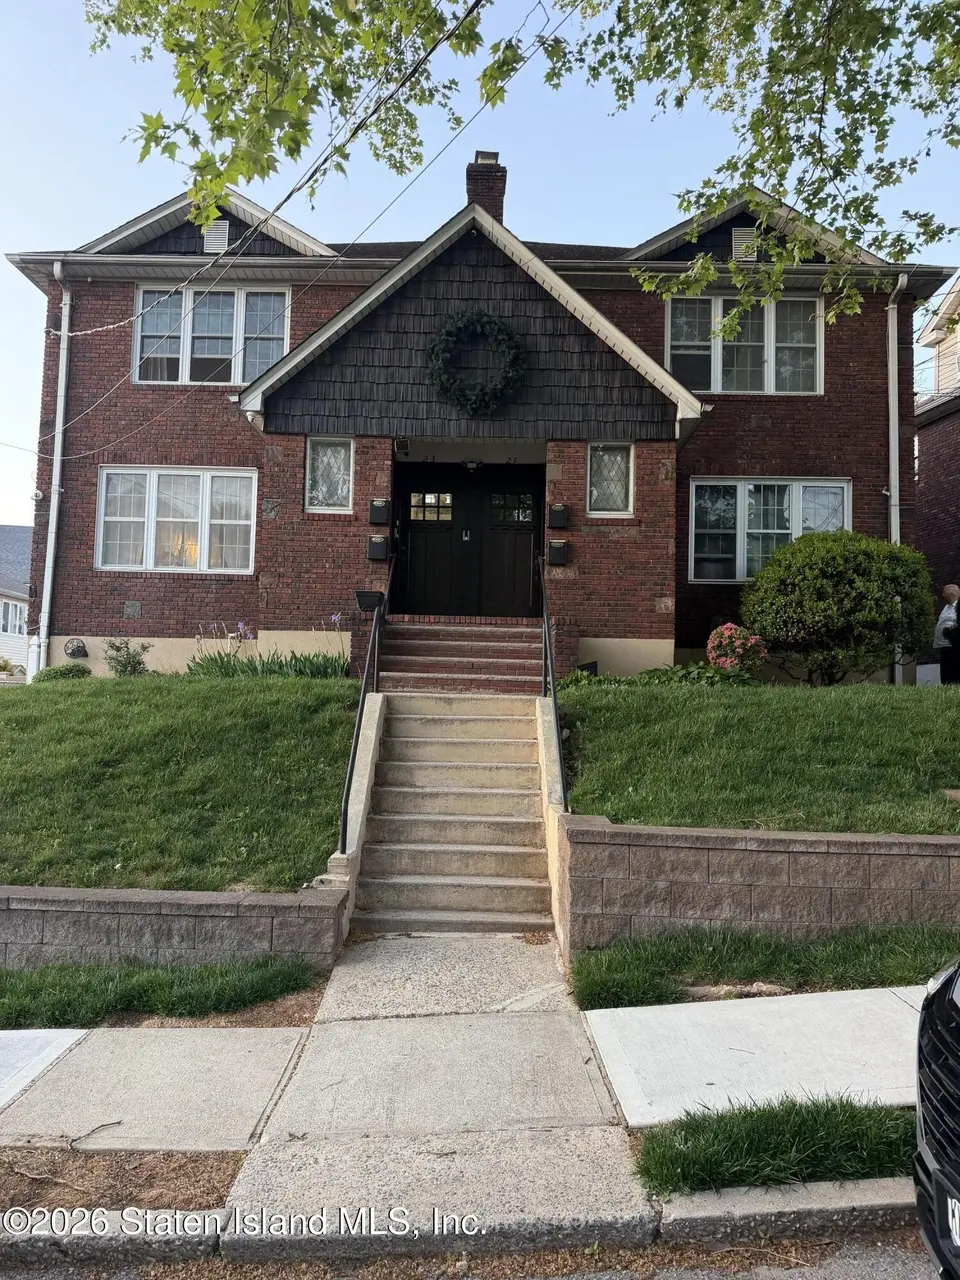
21-23 Holbernt Ct · New York, NY
Flood risk 1/10 · Minimal
- FEMA flood zone
- X (unshaded)
- Chance of flooding over 30 yrs
- 0.0%
- Est. flood insurance / yr
- $507 – $1,088
Fire risk 1/10 · Minimal
- Est. fire insurance / yr
- $691 – $1,283
Heat risk 7/10 · Major
- Hot days now (above 97°F)
- 7 days/yr
- Hot days in 30 yrs
- 15 days/yr
Wind risk 6/10 · Moderate
- Chance of severe wind over 30 yrs
- 27.0%
Air-quality risk 4/10 · Minor
- Unhealthy air days now
- 5 days/yr
- Unhealthy air days in 30 yrs
- 7 days/yr
Risk factors via First Street. Map © Google.
Why this score? — see what drove the C- grade
The composite is a weighted blend of 9 inputs, each scored 0–100. Each bar is that input's sub-score; the figure is the points it added to the 100-point composite (weight × sub-score).
- Cash flow +18.9/30.0
- ARV discount +7.5/15.0
- DSCR +5.9/10.0
- 1% rule +5.0/10.0
- Schools +5.0/10.0
- Livability +3.8/5.0
- Rent growth +2.5/5.0
- Condition / age +2.2/5.0
- Appreciation +0.0/10.0
$1,250,000
🖨 Deal sheet 📄 Offer letter ✓ Due diligence
Multi-family units
County records classify this as Multi-Family (2-4 Unit). Listing-text estimate: 4 units. confirmed
Listing remarks
RARE OPPORTUNITY TO OWN A DETACHED 4 FAMILY IN STATEN ISLAND. LOW TAXES IDEAL FOR INVESTORS. IT IS A QUIET DEAD END BLOCK. PROPERTY OFFERS 5 BEDROOMS, SQUARE FOOTAGE IS 3192 WITH A VERY LARGE BACKYARD WITH DRIVEWAY FOR 5-6 VEHICLES. BASEMENT INCLUDES LOVELY ROOM, OFFICE ETC. WALK OUT TO YARD. A MUST SEE WHEN LOOKING FOR A DETACHED MULTI-FAMILY.
Key facts
- Detached 4 family
- Quiet dead end block
- Large backyard
Tags
Property features AI
Finance
- Other: Total building area listed (3,192)
- Financial info: Four-unit multifamily building; Unit 1 approximate rent: $1,430/month; Unit 3 approximate rent: $1,530/month; Unit 4 approximate rent: $1,465/month
Exterior
- Parking: Off-street parking (no attached garage)
- Utilities: 220 Volt electric service
- Home design: Two-story building; Approximate year built
- Construction: Brick construction; Building in excellent condition; Storage available
- Exterior features: Brick exterior; Lot approximately 0.16 acres (53 x 129); Zoned R3A
Interior
- Bedrooms: Unit 1: 1 bedroom; Unit 2: 1 bedroom; Unit 3: 2 bedrooms; Unit 4: 1 bedroom
- Bathrooms: Four full bathrooms (total)
- Heating & cooling: Natural gas heating; Hot water heating; Cooling provided by units
- Interior features: Finished basement; Central air conditioning (unit-based); Laundry room; Storage space; Cable available
- Laundry & utility: On-site laundry
Neighborhood map
What this means for you Summary
Snapshot
- This is a 4 × 5-bed/4.0-bath units multifamily listed at $1.25M. Condition is rated fair.
Deal economics
- At list price, monthly cash flow is $1k ($15k/yr) — positive. Per door: $318/mo.
- The deal already cash-flows at list — no discount required.
- Meets the 1% rule at list price ($13k rent vs $1.25M).
- Recommended offer: $1.21M (3.0% below list) — sets the bar for market timing.
- Cap rate 7.5% vs local median 2.6% in New York — top-decile yield for the area; either an underpriced asset or a hidden risk that comps aren't pricing in. Stress-test before assuming the spread holds.
Location & tenants
- Location reads 75/100 on livability (#268 in NY, #4,188 nationally) — a middle-class / working-renter tenant base. Strengths: amenities A+, commute A+, health & safety A; Watch: crime F, cost of living F.
- Market conditions: 69 active listings in the ZIP; 480 units permitted in Richmond County in 2024 (22 in 5+ unit buildings).
Forward outlook
- Local home prices are declining (-3.0%/yr); year-one equity from $9k of loan paydown is wiped out by about $38k of value loss. Plan a longer hold.
- Richmond County population projected to shrink 5% by 2050 — rents likely to lag national; underwrite the cash flow, not the appreciation.
Negotiation context
- It's been on market 38 days — a 3% lower offer ($1.21M) is reasonable based on typical stale-listing flexibility.
- 4 sale attempts since 11y ago with the ask held roughly flat each time — persistent listings suggest the price (not the market) is what's stuck; bring a comps-based counter.
Risks & watch-outs
- Watch-outs: built in 1899 — expect roof / HVAC / electrical / plumbing capex.
- Climate carrying-cost: major wind risk, 27% chance of damaging wind over 30y; extreme-heat days projected 7→15/yr by 2055 (HVAC capex compounding) — expect insurance premiums to compound above CPI over the hold.
Questions for the listing agent
- It's been on market 38 days. Have you received any prior offers? Is the seller open to a 3% concession, seller financing, or rate buy-down credit?
- Can we see the unit-by-unit rent roll, current vacancy, and any below-market leases? What's the average tenancy length?
- What capital expenditures (roof, boiler, parking lot, exteriors) have been made in the last 5 years, and what's planned in the next 2?
- Have any recent inspections been done? Can we get a copy of the seller's disclosures and any deferred-maintenance estimates?
- Built in 1899 — when were the roof, HVAC, electrical panel, plumbing, and water heater last replaced?
- Is there a deadline driving the sale (1031 exchange, divorce, estate, relocation)? That informs how much negotiation room exists.
- Schools are B-rated — typically a magnet for longer-tenancy family renters. What's the average tenant stay here, and is there a school-zone premium baked into asking?
- Crime grade is F in this area — have there been break-ins, vandalism, or insurance claims at this property in the last 3 years? What carrier currently insures it and at what premium?
- What's the average days-on-market for RENTAL listings here right now (not sales)? A rising rental-DOM trend means longer vacancies and softer asking-rent achievability than the comps imply.
- What's the recent tenant-quality profile in this submarket — average credit score on applications, eviction rate, late-payment / NSF rate, and stable-employment percentage? A property-management company in the area should have these aggregated.
- How much new apartment / multifamily construction is in the pipeline within 1–3 miles? Heavy new supply (>2% of stock underway) typically softens rents 12–24 months out; light construction supports rent growth.
Investment metrics
- 1% rule
- 1.00% ✓
- Cap rate
- 7.51%
- Cash-on-cash
- 4.36%
- DSCR
- 1.19
- GRM
- 8.3
CMA / ARV
No comps found within radius.
Projected returns pro-forma
-3.0% appreciation · 3.0% rent growth · sell at horizon
- IRR
- -9.5%
- Equity multiple
- 0.65×
- Total profit
- $-121,446
- Equity at exit
- $186,379
- IRR
- -0.0%
- Equity multiple
- 1.00×
- Total profit
- $-788
- Equity at exit
- $108,077
Cash invested: $350,000 (down + closing). Projections, not guarantees.
Landlord ↔ Tenant lean methodology
- Overall (CITY)
- 0 Strongly Tenant-Friendly
- State New York
- 15 Strongly Tenant-Friendly · D+10
- County
- — inherits STATE
- City New York
- 0 Strongly Tenant-Friendly · D+34
ZIP-level market 10302
- Home prices YoY
- -31.0%
- Active inventory
- 69
- Price-to-rent
- 33.2×
Monthly cashflow live
- Estimated rent
- $12,543 medium interval (Pro) →
- Mortgage (P&I)
- −$6,555
- Tax est. 1.5%
- −$1,562 /mo · $18,750/yr
- Insurance
- −$521
- HOA
- −$0
- Vacancy / Maint / Mgmt
- −$2,634
- Net cashflow
- $1,271
Break-even live
Sensitivity live
| Price | -10% $2,134 | -5% $1,702 | +0% $1,271 | +5% $839 | +10% $407 |
|---|---|---|---|---|---|
| Rent | -10% $280 | -5% $775 | +0% $1,271 | +5% $1,766 | +10% $2,261 |
| Rate | -1.0pp $1,900 | -0.5pp $1,588 | base $1,271 | +0.5pp $947 | +1.0pp $617 |
4-unit breakdown (identical units grouped — click to expand)
| Units | Beds | Baths | Est. rent |
|---|---|---|---|
| 4× units | 5 | 4 | $12,544 |
| #1 | 5 | 4 | $3,136 |
| #2 | 5 | 4 | $3,136 |
| #3 | 5 | 4 | $3,136 |
| #4 | 5 | 4 | $3,136 |
| Total (4 units) | $12,543 | ||
UW: 25.0% down · 7.5% · 30yr · 1.5% tax · 5.0% vac · 8.0% maint · 8.0% mgmt
Financing live
Cash to close
- Down payment
- $312,500
- Closing costs
- $37,500
- Reserves months
- —
- Total cash needed
- —
Loan-product check · same deal, 3 products live
Conventional
25% down · 7.5% · 30yr
- Down + closing
- —
- Monthly P&I
- —
- Monthly cashflow
- —
- DSCR
- —
- Eligible?
- —
Personal DTI + credit; lowest rate.
DSCR
20% down · 8.5% · 30yr
- Down + closing
- —
- Monthly P&I
- —
- Monthly cashflow
- —
- DSCR
- —
- Eligible?
- —
No personal income docs; deal must DSCR.
Hard money
10% down · 12.0% · 12mo
- Down + closing
- —
- Monthly P&I
- —
- Monthly cashflow
- —
- DSCR
- —
- Eligible?
- —
Short-term bridge; refi at stabilization.
Listing history 15 events
-
2026-06-13statusdays on market $1,250,000 Pending 38 DOM
-
2026-06-10days on market $1,250,000 Active 35 DOM
-
2026-06-08days on market $1,250,000 Active 34 DOM
-
2026-06-08days on market $1,250,000 Active 33 DOM
-
2026-06-04days on market $1,250,000 Active 30 DOM
-
2026-06-03days on market $1,250,000 Active 29 DOM
-
2026-06-01days on market $1,250,000 Active 27 DOM
-
2026-05-31days on market $1,250,000 Active 26 DOM
-
2026-05-04$1,250,000 Active
-
2023-10-15historical
-
2023-09-27$1,150,000 Active
-
2022-09-14historical
-
2022-07-16$1,350,000 Active
-
2015-05-20historical
-
2015-05-13$620,000 Active
ⓘ Source: listings_history table (triggers on properties + properties_extension) + one-shot
backfill from property_details.listing_events for pre-trigger history.
Climate risk First Street
- Flood 1/10 Low FEMA zone X (unshaded) · 0% chance over 30 yrs
- Wildfire 1/10 Low
- Heat 7/10 Severe 7 d/yr ≥97°F today · 15 d/yr by 30 yrs out
- Wind 6/10 Major 27% chance of damaging wind over 30 yrs
- Air quality 4/10 Moderate 5 unhealthy d/yr today · 7 by 30 yrs out
Nearby sold comps map
Loading sold comps map…
Walkable amenities ~0.75 mi
Loading nearby amenities…
Taxation est. · year 1
- Rental income
- $150,516
- − Mortgage interest
- −$70,019
- − Property taxes
- −$18,750
- − Insurance
- −$6,250
- − Repairs & maintenance
- −$12,041
- − Management
- −$12,041
- − Depreciation
- −$36,364
- Taxable loss
- −$4,950
- Est. tax savings @ 24.0%
- +$1,188
- After-tax cash flow
- $16,434/yr
For passive investors: Depreciation is non-cash, so a rental often shows a tax loss while cash-flowing — sheltering income. Rental losses are passive: they offset passive income freely, and up to $25,000/yr can offset ordinary (W-2) income if you actively participate and your MAGI is under $100k (phasing out to $0 by $150k); unused losses carry forward. On sale, claimed depreciation is recaptured at up to 25%, and gains may owe capital-gains tax (a 1031 exchange can defer both). Figures are a year-1 estimate at your 24.0% rate — not tax advice; consult a CPA.
Condition & rehab AI · 4 photos
A moderate rehab opportunity with average condition, requiring exterior paint and landscaping improvements to enhance value.
Repairs flagged
- Minor Exterior paint — Peeling paint on exterior
- Minor Landscaping — Overgrown grass and shrubs
Value-add opportunities
- Both Paint exterior — Enhances curb appeal and value
- Both Landscaping — Improves curb appeal and value
- Both HVAC maintenance — Ensures comfort and energy efficiency
- Both Interior painting — Enhances interior appearance and value
Renovation cost estimate screening
| Repair item | Severity | Est. cost |
|---|---|---|
| Exterior paint · Peeling paint on exterior | Minor | $500–3,000 |
| Landscaping · Overgrown grass and shrubs | Minor | $500–3,000 |
| Total estimated repair cost · 2 items | $1,000–6,000 |
Value-add ROI direction
- Both Paint exterior — Enhances curb appeal and value ↑
- Both Landscaping — Improves curb appeal and value ↑
- Both HVAC maintenance — Ensures comfort and energy efficiency ↑
- Both Interior painting — Enhances interior appearance and value ↑
ⓘ Cost ranges are severity-bucket heuristics (US national rule-of-thumb). Get contractor quotes + a written scope before underwriting a rehab budget.
Schools (NCES district)
No district data.
Livability — New York
- Score
- 75/100
- State rank
- #268
- US rank
- #4188
Category grades
Schools grade is shown separately in the Schools card above.
Census & demographics
- Census place
- New York, NY
- City population
- 7,731,280
- Population (ZIP)
- 19,693
Population outlook (Richmond County) Hauer SSP2
- Today (2025)
- 482,784 people
- By 2030
- 481,831 · -0.2%
- By 2040
- 473,159 · -2.0%
- By 2050
- 457,242 · -5.3%
- By 2075
- 408,029 · -15.5%
- By 2100
- 341,459 · -29.3%
Race, ethnicity, and origin ACS 2023
- Neighborhood character
- Diverse neighborhood (Simpson 0.69)
- Race & ethnicity
- Hispanic / Latino 43% White 27% Black 21% Two or more races 15% Asian 6% Native American 2%
- Hispanic origin (detail)
- Mexican 23% Puerto Rican 11% Dominican 4%
- Common ancestry
- Lithuanian 1% Romanian 1% Portuguese 1%
- Foreign-born
- 28% · Canada, China, Jamaica
- Languages at home
- 58% English-only · Spanish 29% Other Indo-European 3% Arabic 2%
Political lean MEDSL · Richmond
- 2024 margin
- Strong R (+29.8) · D 35.1% · R 64.9%
- 2008→2024 swing
- -25.7pp toward R · 2008: -4.0pp · 2024: -29.8pp
- All cycles
- 2024: R+29.8 2020: R+14.9 2016: R+16.8 2012: D+0.8 2008: R+4.0
Not yet ingested
- Civics
- —
Market trends
- HPI YoY
- ▼ -153.26%
- Current HPI
- 340.4458
- Rent YoY
- —
- Metro
- —
- State GDP YoY
- ▲ 2.60%
- F500 in state
- 92
Industry mix (Fortune 500 HQ in NY)
| Industry | F500 HQs | Revenue |
|---|---|---|
| Financial Services | 10 | $950B |
|
||
| Consumer Goods | 9 | $162B |
|
||
| Insurance | 4 | $225B |
|
||
| Telecommunications | 2 | $144B |
|
||
| Pharmaceuticals | 2 | $112B |
|
||
| Media / Entertainment | 2 | $69B |
|
||
Price history
+101.6% since first listed7 events — show timeline
- 2026-05-04 Listed $1,250,000 SIBORMLS
- 2023-10-15 Listing Removed — SIBORMLS
- 2023-09-27 Listed $1,150,000 SIBORMLS
- 2022-09-14 Listing Removed — SIBORMLS
- 2022-07-16 Listed $1,350,000 SIBORMLS
- 2015-05-20 Listing Removed — SIBORMLS
- 2015-05-13 Listed $620,000 SIBORMLS
Cash-flow waterfall
monthlySold comps — $/sqft
last 12 mo · ≤1 miLoading sold comps…