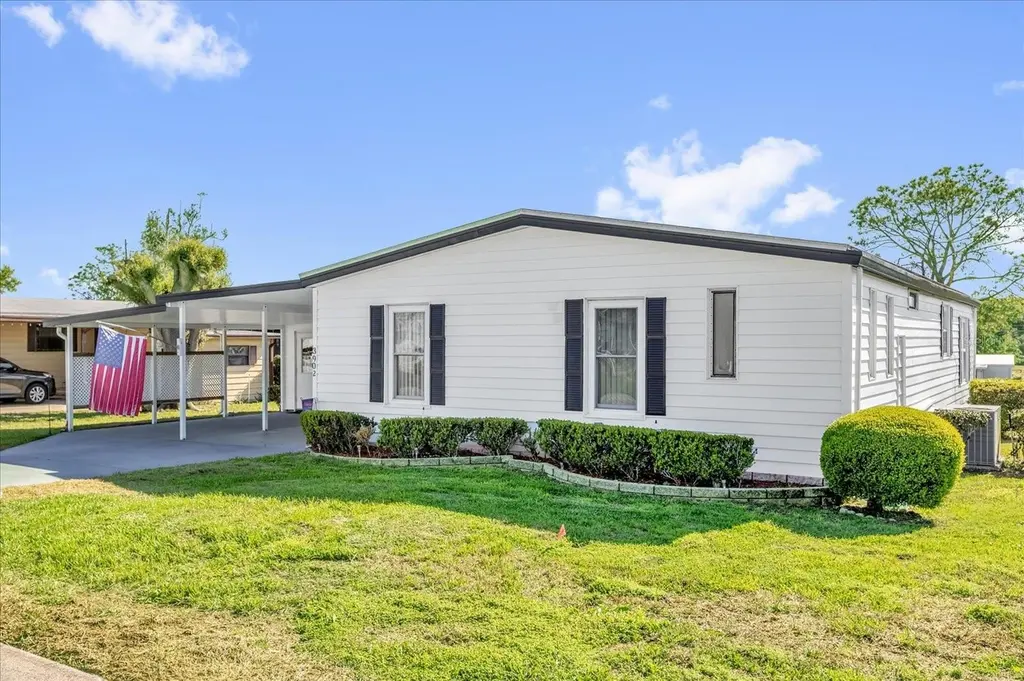
3902 Parway Rd #1339 · Zellwood, FL
Flood risk 1/10 · Minimal
- FEMA flood zone
- X (unshaded)
- Chance of flooding over 30 yrs
- 0.0%
- Est. flood insurance / yr
- $507 – $1,088
Fire risk 5/10 · Moderate
- Est. fire insurance / yr
- $947 – $1,759
Heat risk 8/10 · Major
- Hot days now (above 108°F)
- 7 days/yr
- Hot days in 30 yrs
- 22 days/yr
Wind risk 9/10 · Severe
- Chance of severe wind over 30 yrs
- 99.0%
Air-quality risk 1/10 · Minimal
- Unhealthy air days now
- 0 days/yr
- Unhealthy air days in 30 yrs
- 0 days/yr
Risk factors via First Street. Map © Google.
Why this score? — see what drove the A- grade
The composite is a weighted blend of 9 inputs, each scored 0–100. Each bar is that input's sub-score; the figure is the points it added to the 100-point composite (weight × sub-score).
- Cash flow +30.0/30.0
- ARV discount +13.4/15.0
- 1% rule +10.0/10.0
- DSCR +10.0/10.0
- Appreciation +6.3/10.0
- Schools +4.1/10.0
- Livability +3.8/5.0
- Rent growth +2.5/5.0
- Condition / age +2.5/5.0
$164,000
🖨 Deal sheet 📄 Offer letter ✓ Due diligence
Listing remarks
PRICE REDUCTION. Gorgeous 2/2 On 18th Green/Fairway. SPECTACULAR VIEWS from 27x18 Living Room and 12x17 Florida Room. Spacious floorplan ready for your personal touches. 2016 Membrane roof on Main Home plus 2021 Carport/Porch re-roof, 2014 A/C well-maintained. Newer windows in Living/Dining Area and vinyl all-season windows in the Florida Room. Desirable Double Carport and Golf Cart Garage/Storage. Tons of cabinet space in the Kitchen and Inside Laundry. Located in Prestigious 55 Plus Zellwood Station Golfing Community. More amenities and activities than you can fit into your busy lifestyle. Close to shopping, restaurants, airports, beaches, places of worship, theme parks. 4 Pools, Pickleba
Key facts
- Golf cart garage
- Double carport
- Florida room
Tags
Property features AI
Finance
- Other: Third-party listing; Living area and building area reported from public records
- Financial info: Total monthly fees $415 (total annual fees $4,980); Lease restrictions apply
- HOA & community: Has HOA (monthly fee $415); Association approval required; Association includes 24-hour guard, cable TV, common area taxes, pool, electricity, escrow reserves, internet, management, recreational facilities, security, trash; Community features: clubhouse, community mailbox, deed restrictions, fitness center, golf, pool, tennis courts, pickleball, shuffleboard, spa/hot tub, trails, gated, vehicle restrictions, buyer approval required, special community restrictions; Senior community; Pets not allowed; Association name: Peggy Pinkerton
Exterior
- Parking: Carport with 2 spaces
- Security: Gated community
- Utilities: Public sewer; Water: none specified; High-speed internet / broadband available; Cable available and connected; Electricity available and connected; Fiber optics available; Sewer available and connected; Water available and connected; Underground utilities
- Home design: Manufactured home (Double wide); Palm Harbor make; One story; Faces northeast; Completed condition; Pillar/post/pier foundation
- Construction: Vinyl siding; Membrane roof; Built on pillar/post/pier foundation; Year built information not provided
- Exterior features: Covered, enclosed side porch; Sliding doors; Storage; Workshop; On golf course; Paved lot; Asphalt road
Interior
- Kitchen: Cooktop; Dishwasher; Disposal; Microwave; Refrigerator; Electric water heater
- Bedrooms: 2 bedrooms
- Flooring: Carpet; Ceramic tile
- Bathrooms: 2 full bathrooms
- Heating & cooling: Central heating (electric); Central air conditioning
- Interior features: Built-in features; Cathedral ceilings; Ceiling fans; Eat-in kitchen; High ceilings; Living room/dining room combo; Thermostat; Vaulted ceilings; Walk-in closets; Window treatments; Blinds
- Laundry & utility: Laundry room; Dryer
Neighborhood map
What this means for you Summary
Snapshot
- This is a 2-bed/2.0-bath manufactured listed at $164k.
Deal economics
- At list price, monthly cash flow is $631 ($8k/yr) — positive.
- The deal already cash-flows at list — no discount required.
- Meets the 1% rule at list price ($3k rent vs $164k).
- Recommended offer: $154k (6.0% below list) — sets the bar for market timing.
Location & tenants
- Location reads 75/100 on livability (#248 in FL, #3,918 nationally) — a middle-class / working-renter tenant base. Strengths: crime A+, cost of living A+, housing A+; Watch: schools D+, amenities F, commute D-.
- Orange (suburban): math 46% / reading 51% proficiency, ranked #43 of 73 in FL (top 59%) — families likely to look elsewhere, expect single-tenant / working-renter base with shorter leases.
- Market conditions: 103 active listings in the ZIP; 3 comparable units currently listed for rent nearby; rentals at typical pace (median 22d on market — plan ~3-4 weeks tenant-placement turnaround); 8,053 units permitted in Orange County in 2024 (3,133 in 5+ unit buildings).
Forward outlook
- In year one you build about $5k of equity ($1k loan paydown + $4k appreciation (2.5% local appreciation)).
- Orange County population projected at +52% by 2050 — long-run rental-demand tailwind backs the buy-and-hold thesis.
- At projected returns (2.5% appreciation + 3.0% rent growth), your $46k cash investment doubles in ~4 years — after that, you're playing with house money.
- By year 7, paydown + projected appreciation supports a ~$33k cash-out refi (75% LTV) — recoverable capital for the next deal without selling this one.
Negotiation context
- It's been on market 86 days — a 6% lower offer ($154k) is reasonable based on typical stale-listing flexibility.
- Current owner paid $21k; list at $164k implies a 688% gain — meaningful room to come down on a strong offer.
Risks & watch-outs
- Climate carrying-cost: severe wind risk, 99% chance of damaging wind over 30y; moderate wildfire risk; extreme-heat days projected 7→22/yr by 2055 (HVAC capex compounding) — expect insurance premiums to compound above CPI over the hold.
Questions for the listing agent
- It's been on market 86 days. Have you received any prior offers? Is the seller open to a 6% concession, seller financing, or rate buy-down credit?
- What does the HOA fee cover, when was the last increase, and are there any pending special assessments or reserve-fund shortfalls?
- Why hasn't it sold? Are there any deal-killer items the seller is aware of (foundation, flood, title, zoning, code violations)?
- Is there a deadline driving the sale (1031 exchange, divorce, estate, relocation)? That informs how much negotiation room exists.
- Schools are D-rated, which usually means shorter tenancies and higher turnover. Who's the typical renter profile here, and what's been the actual vacancy rate?
- What's the average days-on-market for RENTAL listings here right now (not sales)? A rising rental-DOM trend means longer vacancies and softer asking-rent achievability than the comps imply.
- What's the recent tenant-quality profile in this submarket — average credit score on applications, eviction rate, late-payment / NSF rate, and stable-employment percentage? A property-management company in the area should have these aggregated.
- How much new for-sale + rental construction is in the pipeline within 1–3 miles? Heavy new supply typically softens prices + rents 12–24 months out; constrained supply supports both.
Investment metrics
- 1% rule
- 1.55% ✓
- Cap rate
- 10.91%
- Cash-on-cash
- 16.50%
- DSCR
- 1.73
- GRM
- 5.4
CMA / ARV
- ARV (on-the-fly)
- $188,639
- Comps found
- 4
Show comp detail 4 sales within ~0.75 mi
| Address | Dist | Beds/Ba | Sqft | Sold | Price | $/sf | Match |
|---|---|---|---|---|---|---|---|
| 3644 Parway Rd #1149 | 0.24mi | 2/2.0 | 1,538 (-1%) | 1mo | $235,000 | $153 | 86 |
| 3749 Cohen Dr #720 | 0.44mi | 2/2.0 | 1,602 (+3%) | 13mo | $147,000 | $92 | 64 |
| 3500 Blossom Cir #1497 | 0.70mi | 2/2.0 | 1,656 (+6%) | 1mo | $112,500 | $68 | 56 |
| 3955 Cohen Dr #737 | 0.46mi | 2/2.0 | 1,771 (+14%) | 4mo | $215,000 | $121 | 52 |
Match score weights: distance 35% · size 25% · config 20% · recency 20%. Top-matched comps best support the ARV.
Projected returns pro-forma
2.5% appreciation · 3.0% rent growth · sell at horizon
- IRR
- 22.0%
- Equity multiple
- 2.22×
- Total profit
- $55,885
- Equity at exit
- $69,192
- IRR
- 23.5%
- Equity multiple
- 4.23×
- Total profit
- $148,289
- Equity at exit
- $103,223
Cash invested: $45,920 (down + closing). Projections, not guarantees.
Landlord ↔ Tenant lean methodology
- Overall (STATE)
- 87 Strongly Landlord-Friendly
- State Florida
- 87 Strongly Landlord-Friendly · R+3
- County
- — inherits STATE
- City
- — inherits STATE
ZIP-level market 32798
- Home prices YoY
- 1.0%
- Active inventory
- 103
- Price-to-rent
- 5.4×
Monthly cashflow live
- Estimated rent
- $2,540 medium interval (Pro) →
- Mortgage (P&I)
- −$860
- Tax from tax record
- −$32 /mo · $378/yr
- Insurance
- −$68
- HOA
- −$415
- Vacancy / Maint / Mgmt
- −$533
- Net cashflow
- $631
Break-even live
UW: 25.0% down · 7.5% · 30yr · 1.5% tax · 5.0% vac · 8.0% maint · 8.0% mgmt
Financing live
Cash to close
- Down payment
- $41,000
- Closing costs
- $4,920
- Reserves months
- —
- Total cash needed
- —
Loan-product check · same deal, 3 products live
Conventional
25% down · 7.5% · 30yr
- Down + closing
- —
- Monthly P&I
- —
- Monthly cashflow
- —
- DSCR
- —
- Eligible?
- —
Personal DTI + credit; lowest rate.
DSCR
20% down · 8.5% · 30yr
- Down + closing
- —
- Monthly P&I
- —
- Monthly cashflow
- —
- DSCR
- —
- Eligible?
- —
No personal income docs; deal must DSCR.
Hard money
10% down · 12.0% · 12mo
- Down + closing
- —
- Monthly P&I
- —
- Monthly cashflow
- —
- DSCR
- —
- Eligible?
- —
Short-term bridge; refi at stabilization.
Rent comps 3 comps
| Address | Beds | Baths | Sqft | Rent | $/sqft | DOM | Units | Dist |
|---|---|---|---|---|---|---|---|---|
| 3875 Denali Dr Apopka, FL | 3.0 | 2.5 | 1734 | $2,450 | $1.41 | 21d | 1 | 1.23mi |
| 3941 Cuyahoga Valley Ct Apopka, FL | 3.0 | 2.5 | 2138 | $2,650 | $1.24 | 21d | 1 | 1.29mi |
| 3979 Capital Reef Way Apopka, FL | 3.0 | 2.5 | 2128 | $2,545 | $1.20 | 14d | 1 | 1.35mi |
HOA detail
- Monthly dues
- $415 · $4,980/yr
- Likely covers
- pool
Listing history 17 events
-
2026-06-18days on market $164,000 Active 86 DOM
-
2026-06-17days on market $164,000 Active 85 DOM
-
2026-06-16days on market $164,000 Active 84 DOM
-
2026-06-15days on market $164,000 Active 83 DOM
-
2026-06-13days on market $164,000 Active 81 DOM
-
2026-06-13days on market $164,000 Active 80 DOM
-
2026-06-09days on market $164,000 Active 77 DOM
-
2026-06-08days on market $164,000 Active 76 DOM
-
2026-06-07days on market $164,000 Active 75 DOM
-
2026-06-04days on market $164,000 Active 72 DOM
-
2026-06-03days on market $164,000 Active 71 DOM
-
2026-06-02days on market $164,000 Active 70 DOM
-
2026-06-02days on market $164,000 Active 69 DOM
-
2026-05-31days on market $164,000 Active 68 DOM
-
2026-05-06price $164,000
-
2026-03-24$174,900 Active
-
1993-11-10soldstatus $20,800
ⓘ Source: listings_history table (triggers on properties + properties_extension) + one-shot
backfill from property_details.listing_events for pre-trigger history.
Tax reassessment forecast FL · Resets to sale price
- Current annual tax
- $378 · $32/mo
- Projected year-2 tax
- $1,361 · $113/mo
- Expected delta
- +$983/yr (+$82/mo · 259.9%)
ⓘ Screening estimate from a state-policy table — verify with the county assessor before closing.
Climate risk First Street
- Flood 1/10 Low FEMA zone X (unshaded) · 0% chance over 30 yrs
- Wildfire 5/10 Major
- Heat 8/10 Severe 7 d/yr ≥108°F today · 22 d/yr by 30 yrs out
- Wind 9/10 Extreme 99% chance of damaging wind over 30 yrs
- Air quality 1/10 Low 0 unhealthy d/yr today · 0 by 30 yrs out
Nearby sold comps map
Loading sold comps map…
Walkable amenities ~0.75 mi
Loading nearby amenities…
Taxation est. · year 1
- Rental income
- $30,476
- − Mortgage interest
- −$9,187
- − Property taxes
- −$378
- − Insurance
- −$820
- − Repairs & maintenance
- −$2,438
- − Management
- −$2,438
- − HOA
- −$4,980
- − Depreciation
- −$4,771
- Taxable income
- $5,464
- Est. tax owed @ 24.0%
- −$1,311
- After-tax cash flow
- $6,266/yr
For passive investors: Depreciation is non-cash, so a rental often shows a tax loss while cash-flowing — sheltering income. Rental losses are passive: they offset passive income freely, and up to $25,000/yr can offset ordinary (W-2) income if you actively participate and your MAGI is under $100k (phasing out to $0 by $150k); unused losses carry forward. On sale, claimed depreciation is recaptured at up to 25%, and gains may owe capital-gains tax (a 1031 exchange can defer both). Figures are a year-1 estimate at your 24.0% rate — not tax advice; consult a CPA.
Schools (NCES district)
- District
- Orange
- NCES district ID
- 1201440
- Math proficiency
- 46% ▼ -9.00%
- Reading proficiency
- 51% ▼ -2.00%
- Median HH income
- $49,350
- Composite
- 41.47/100
- National rank
- #3461
- State rank
- #43 of 73 in FL
Livability — Zellwood
- Score
- 75/100
- State rank
- #248
- US rank
- #3918
Category grades
Schools grade is shown separately in the Schools card above.
Census & demographics
- Census place
- Zellwood, FL
- City population
- 2,159
- Population (ZIP)
- 2,159
Population outlook (Orange County) Hauer SSP2
- Today (2025)
- 1,618,226 people
- By 2030
- 1,787,404 · +10.5%
- By 2040
- 2,125,621 · +31.4%
- By 2050
- 2,454,016 · +51.6%
- By 2075
- 3,173,711 · +96.1%
- By 2100
- 3,607,781 · +122.9%
Race, ethnicity, and origin ACS 2023
- Neighborhood character
- Predominantly White (86%)
- Race & ethnicity
- White 86% Hispanic / Latino 10% Two or more races 8%
- Hispanic origin (detail)
- Puerto Rican 10%
- Common ancestry
- Iranian 5% Lithuanian 5% Romanian 2%
- Foreign-born
- 5%
- Languages at home
- 89% English-only · Spanish 9% German/W. Germanic 3%
Political lean MEDSL · Orange
- 2024 margin
- D (+13.6) · D 56.1% · R 42.5% · Other 1.3%
- 2008→2024 swing
- -5.0pp toward R · 2008: 18.6pp · 2024: 13.6pp
- All cycles
- 2024: D+13.6 2020: D+23.1 2016: D+24.6 2012: D+18.2 2008: D+18.6
Not yet ingested
- Civics
- —
Market trends
- HPI YoY
- ▲ 2.50%
- Current HPI
- 254.7681
- Rent YoY
- —
- Metro
- —
- State GDP YoY
- ▲ 3.28%
- F500 in state
- 36
Industry mix (Fortune 500 HQ in FL)
| Industry | F500 HQs | Revenue |
|---|---|---|
| Industrial Technology | 2 | $29B |
|
||
| Insurance | 2 | $17B |
|
||
| Retail | 1 | $60B |
|
||
| Technology Distribution | 1 | $58B |
|
||
| Homebuilding | 1 | $35B |
|
||
| Technology Manufacturing | 1 | $35B |
|
||
Price history
+688.5% since first listed3 events — show timeline
- 2026-05-06 Price Changed $164,000 Stellar MLS as Distributed by MLS Grid
- 2026-03-24 Listed $174,900 Stellar MLS as Distributed by MLS Grid
- 1993-11-10 Sold (Public Records) $20,800 Public Records
Property tax history
-0.5%/yrLatest (2025): $378 · +6.1% YoY. Source: county tax records.
Cash-flow waterfall
monthlySold comps — $/sqft
last 12 mo · ≤1 miLoading sold comps…