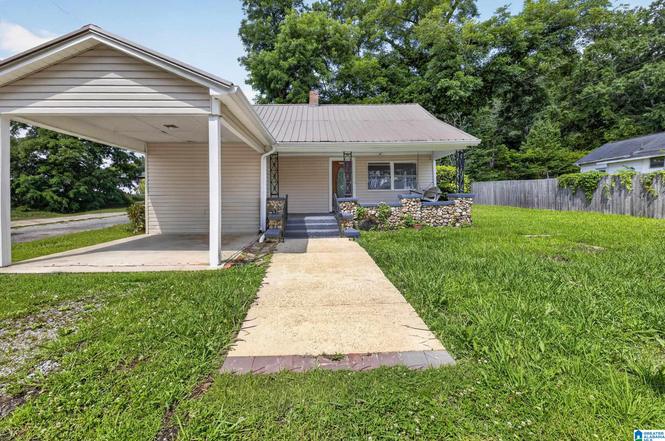
11 16th St N · Pell City, AL
Flood risk 1/10 · Minimal
- FEMA flood zone
- X (unshaded)
- Chance of flooding over 30 yrs
- 0.0%
- Est. flood insurance / yr
- $507 – $1,088
Fire risk 5/10 · Moderate
- Est. fire insurance / yr
- $916 – $1,700
Heat risk 7/10 · Major
- Hot days now (above 107°F)
- 7 days/yr
- Hot days in 30 yrs
- 21 days/yr
Wind risk 6/10 · Moderate
- Chance of severe wind over 30 yrs
- 27.0%
Air-quality risk 3/10 · Minor
- Unhealthy air days now
- 1 days/yr
- Unhealthy air days in 30 yrs
- 4 days/yr
Risk factors via First Street. Map © Google.
Why this score? — see what drove the C- grade
The composite is a weighted blend of 9 inputs, each scored 0–100. Each bar is that input's sub-score; the figure is the points it added to the 100-point composite (weight × sub-score).
- Cash flow +21.2/30.0
- ARV discount +7.4/15.0
- DSCR +6.7/10.0
- 1% rule +4.3/10.0
- Livability +3.5/5.0
- Schools +2.6/10.0
- Rent growth +2.5/5.0
- Condition / age +2.5/5.0
- Appreciation +0.0/10.0
$135,000
🖨 Deal sheet 📄 Offer letter ✓ Due diligence
Listing remarks
Don't miss out on this 2 bedroom, 2 bathroom property. Here you will find a spacious living space with a fenced in yard. Conveniently located to downtown Pell City and I-20. Call today to schedule your private showing.
Key facts
- Fenced in yard
- Built 1940
- Listed 7 days
Tags
Property features AI
Finance
- HOA & community: No association/HOA fees
Exterior
- Parking: Driveway parking; Off-street parking
- Utilities: Public water; Connected sewer; Gas water heater; Ceiling fans (energy/green feature); Internet availability unknown
- Home design: Existing single-family residence; All primary living spaces on main level
- Construction: Vinyl siding exterior; Crawl space foundation
- Exterior features: Fenced yard; Some trees on the lot; Open deck
Interior
- Kitchen: Laminate countertops; Built-in dishwasher; Electric oven; Electric stove; Eating area
- Bedrooms: Two bedrooms on the main level
- Flooring: Hardwood-look laminate flooring; Tile flooring
- Bathrooms: Two full bathrooms; Garden tub in bathroom; Tub/shower combination in bathroom
- Heating & cooling: Central heating; Central air conditioning
- Interior features: 9-foot (or higher) ceilings; Some window treatments to remain; No additional built-in interior features listed
- Laundry & utility: Main-level laundry room; Washer hookup; Electric dryer hookup
Neighborhood map
What this means for you Summary
Snapshot
- This is a 2-bed/1.5-bath single-family listed at $135k.
Deal economics
- At list price, monthly cash flow is $194 ($2k/yr) — positive.
- The deal already cash-flows at list — no discount required.
- To meet the 1% rule (rent ≥ 1% of price), the offer needs to be $125k (7.3% below list).
- Recommended offer: $125k (7.3% below list) — sets the bar for 1% rule.
- Cap rate 8.0% vs local median 2.4% in Pell City — top-decile yield for the area; either an underpriced asset or a hidden risk that comps aren't pricing in. Stress-test before assuming the spread holds.
Location & tenants
- Location reads 69/100 on livability (#50 in AL) — a middle-class / working-renter tenant base. Strengths: cost of living A+, housing A+, health & safety A+; Watch: crime C-, employment D+, amenities F.
- Pell City (town): math 17% / reading 44% proficiency, ranked #67 of 129 in AL (top 52%) — families likely to look elsewhere, expect single-tenant / working-renter base with shorter leases.
- Zoned schools: Iola Roberts Elementary School (math 17% / reading 47%, grade F, #331 of 627 statewide, top 57%, 388 students, 78% FRL); Pell City High School (math 17% / reading 21%, grade F, #181 of 305 statewide, top 60%, 1,171 students, 55% FRL) — zoned schools average 67% FRL vs 47% district-wide (19 pts higher); higher-poverty schools than district average — tighter screening recommended.
- Market conditions: 63 active listings in the ZIP; 9 comparable units currently listed for rent nearby; rentals leasing fast (median 12d on market — plan ~1-2 weeks tenant-placement turnaround); 557 units permitted in St. Clair County in 2024 (0 in 5+ unit buildings).
Forward outlook
- Local home prices are declining (-3.0%/yr); year-one equity from $933 of loan paydown is wiped out by about $4k of value loss. Plan a longer hold.
- St. Clair County population projected at +11% by 2050 — modest demand growth; plan on rents tracking national, not racing it.
Negotiation context
- Only 7 days on market — expect competitive offers; lowballing is unlikely to land.
- 2 sale attempts since 5y ago with the ask held roughly flat each time — persistent listings suggest the price (not the market) is what's stuck; bring a comps-based counter.
- Current owner paid $42k; list at $135k implies a 218% gain — meaningful room to come down on a strong offer.
Risks & watch-outs
- Watch-outs: built in 1940 — expect roof / HVAC / electrical / plumbing capex.
- Climate carrying-cost: major wind risk, 27% chance of damaging wind over 30y; moderate wildfire risk; extreme-heat days projected 7→21/yr by 2055 (HVAC capex compounding) — expect insurance premiums to compound above CPI over the hold.
Questions for the listing agent
- Built in 1940 — when were the roof, HVAC, electrical panel, plumbing, and water heater last replaced?
- Is there a deadline driving the sale (1031 exchange, divorce, estate, relocation)? That informs how much negotiation room exists.
- What's the average days-on-market for RENTAL listings here right now (not sales)? A rising rental-DOM trend means longer vacancies and softer asking-rent achievability than the comps imply.
- What's the recent tenant-quality profile in this submarket — average credit score on applications, eviction rate, late-payment / NSF rate, and stable-employment percentage? A property-management company in the area should have these aggregated.
- How much new for-sale + rental construction is in the pipeline within 1–3 miles? Heavy new supply typically softens prices + rents 12–24 months out; constrained supply supports both.
Investment metrics
- 1% rule
- 0.93% ✗
- Cap rate
- 8.02%
- Cash-on-cash
- 6.17%
- DSCR
- 1.27
- GRM
- 9.0
CMA / ARV
- ARV (on-the-fly)
- $134,724
- Comps found
- 7
Show comp detail 7 sales within ~0.75 mi
| Address | Dist | Beds/Ba | Sqft | Sold | Price | $/sf | Match |
|---|---|---|---|---|---|---|---|
| 1010 1st Pl S | 0.39mi | 3/2.0 (+1) | 1,254 (+2%) | 1mo | $195,600 | $156 | 71 |
| 119 17th St N | 0.10mi | 2/2.0 | 1,334 (+8%) | 23mo | $149,900 | $112 | 61 |
| 705 17th St S | 0.52mi | 2/1.0 | 1,148 (-7%) | 1mo | $125,000 | $109 | 61 |
| 2414 4th Ave N | 0.64mi | 2/1.0 | 1,252 (+1%) | 8mo | $69,000 | $55 | 60 |
| 2020 2nd Ave S | 0.37mi | 2/1.0 | 1,132 (-8%) | 12mo | $80,000 | $71 | 57 |
| 110 S 11th St | 0.39mi | 3/1.5 (+1) | 1,161 (-6%) | 15mo | $95,000 | $82 | 54 |
| 706 20th St N | 0.73mi | 3/2.0 (+1) | 1,080 (-13%) | 12mo | $196,000 | $181 | 28 |
Match score weights: distance 35% · size 25% · config 20% · recency 20%. Top-matched comps best support the ARV.
Projected returns pro-forma
-3.0% appreciation · 3.0% rent growth · sell at horizon
- IRR
- -6.8%
- Equity multiple
- 0.75×
- Total profit
- $-9,559
- Equity at exit
- $20,129
- IRR
- 2.7%
- Equity multiple
- 1.19×
- Total profit
- $7,351
- Equity at exit
- $11,672
Cash invested: $37,800 (down + closing). Projections, not guarantees.
Landlord ↔ Tenant lean methodology
- Overall (STATE)
- 90 Strongly Landlord-Friendly
- State Alabama
- 90 Strongly Landlord-Friendly · R+15
- County
- — inherits STATE
- City
- — inherits STATE
ZIP-level market 35125
- Home prices YoY
- -22.0%
- Active inventory
- 63
- Price-to-rent
- 9.0×
Monthly cashflow live
- Estimated rent
- $1,252 high interval (Pro) →
- Mortgage (P&I)
- −$708
- Tax from tax record
- −$30 /mo · $362/yr
- Insurance
- −$56
- HOA
- −$0
- Vacancy / Maint / Mgmt
- −$263
- Net cashflow
- $194
Break-even live
UW: 25.0% down · 7.5% · 30yr · 1.5% tax · 5.0% vac · 8.0% maint · 8.0% mgmt
Financing live
Cash to close
- Down payment
- $33,750
- Closing costs
- $4,050
- Reserves months
- —
- Total cash needed
- —
Loan-product check · same deal, 3 products live
Conventional
25% down · 7.5% · 30yr
- Down + closing
- —
- Monthly P&I
- —
- Monthly cashflow
- —
- DSCR
- —
- Eligible?
- —
Personal DTI + credit; lowest rate.
DSCR
20% down · 8.5% · 30yr
- Down + closing
- —
- Monthly P&I
- —
- Monthly cashflow
- —
- DSCR
- —
- Eligible?
- —
No personal income docs; deal must DSCR.
Hard money
10% down · 12.0% · 12mo
- Down + closing
- —
- Monthly P&I
- —
- Monthly cashflow
- —
- DSCR
- —
- Eligible?
- —
Short-term bridge; refi at stabilization.
Rent comps 9 comps
| Address | Beds | Baths | Sqft | Rent | $/sqft | DOM | Units | Dist |
|---|---|---|---|---|---|---|---|---|
| 1917 2nd Ave N Pell City, AL | 2.0 | 1.5 | 1400 | $1,350 | $0.96 | 11d | 1 | 0.29mi |
| 1919 2nd Ave N Pell City, AL | 2.0 | 1.5 | 1400 | $1,350 | $0.96 | 11d | 1 | 0.29mi |
| 2000 3rd Ave S Pell City, AL | 2.0 | 1.0 | 1158 | $1,190 | $1.03 | 23d | 1 | 0.39mi |
| 713 21st St N Unit A Pell City, AL | 2.0 | 2.0 | 1200 | $985 | $0.82 | 2d | 1 | 0.73mi |
| 1103 23rd St N Pell City, AL | 1.0–3.0 | 1.0–3.0 | 990 | $1,310 | $1.32 | 1d | 11 | 0.99mi |
| 570 Woodland Crest Rd Pell City, AL | 3.0 | 2.0 | 1200 | $1,566 | $1.30 | 19d | 1 | 1.01mi |
| 311 7th Ct N Pell City, AL | 2.0 | 2.0 | 960 | $1,155 | $1.20 | 23d | 1 | 1.12mi |
| 312 7th Ct N Pell City, AL | 1.0 | 1.0 | 837 | $974 | $1.16 | 23d | 1 | 1.14mi |
| 1000 Comer Ave Pell City, AL | 2.0 | 1.0 | 835 | $795 | $0.95 | 1d | 1 | 1.41mi |
Listing history 6 events
-
2026-06-18days on market $135,000 Active 7 DOM
-
2026-06-17days on market $135,000 Active 6 DOM
-
2026-06-16days on market $135,000 Active 5 DOM
-
2026-06-15days on market $135,000 Active 4 DOM
-
2026-06-13remarks 218-char remark
-
2026-06-13$135,000 Active 2 DOM
ⓘ Source: listings_history table (triggers on properties + properties_extension) + one-shot
backfill from property_details.listing_events for pre-trigger history.
Tax reassessment forecast AL · Resets to sale price
- Current annual tax
- $362 · $30/mo
- Projected year-2 tax
- $554 · $46/mo
- Expected delta
- +$191/yr (+$16/mo · 52.7%)
ⓘ Screening estimate from a state-policy table — verify with the county assessor before closing.
Climate risk First Street
- Flood 1/10 Low FEMA zone X (unshaded) · 0% chance over 30 yrs
- Wildfire 5/10 Major
- Heat 7/10 Severe 7 d/yr ≥107°F today · 21 d/yr by 30 yrs out
- Wind 6/10 Major 27% chance of damaging wind over 30 yrs
- Air quality 3/10 Moderate 1 unhealthy d/yr today · 4 by 30 yrs out
Nearby sold comps map
Loading sold comps map…
Walkable amenities ~0.75 mi
Loading nearby amenities…
Taxation est. · year 1
- Rental income
- $15,020
- − Mortgage interest
- −$7,562
- − Property taxes
- −$362
- − Insurance
- −$675
- − Repairs & maintenance
- −$1,202
- − Management
- −$1,202
- − Depreciation
- −$3,927
- Taxable income
- $90
- Est. tax owed @ 24.0%
- −$22
- After-tax cash flow
- $2,311/yr
For passive investors: Depreciation is non-cash, so a rental often shows a tax loss while cash-flowing — sheltering income. Rental losses are passive: they offset passive income freely, and up to $25,000/yr can offset ordinary (W-2) income if you actively participate and your MAGI is under $100k (phasing out to $0 by $150k); unused losses carry forward. On sale, claimed depreciation is recaptured at up to 25%, and gains may owe capital-gains tax (a 1031 exchange can defer both). Figures are a year-1 estimate at your 24.0% rate — not tax advice; consult a CPA.
Schools (NCES district)
- District
- Pell City
- NCES district ID
- 0102650
- Math proficiency
- 17% ▼ -30.00%
- Reading proficiency
- 44% ▼ -4.00%
- Median HH income
- $45,051
- Composite
- 26.04/100
- National rank
- #7303
- State rank
- #67 of 129 in AL
Livability — Pell City
- Score
- 69/100
- State rank
- #50
- US rank
- #8246
Category grades
Schools grade is shown separately in the Schools card above.
Census & demographics
- Census place
- Pell City, AL
- City population
- 10,546
- Population (ZIP)
- 10,969
Population outlook (St. Clair County) Hauer SSP2
- Today (2025)
- 94,158 people
- By 2030
- 97,008 · +3.0%
- By 2040
- 101,615 · +7.9%
- By 2050
- 104,537 · +11.0%
- By 2075
- 109,350 · +16.1%
- By 2100
- 106,785 · +13.4%
Race, ethnicity, and origin ACS 2023
- Neighborhood character
- Predominantly White (82%)
- Race & ethnicity
- White 82% Black 9% Two or more races 5% Hispanic / Latino 3% Pacific Islander 1% Asian 1%
- Common ancestry
- Serbian 1% Italian 1% Slovak 1%
- Foreign-born
- 3% · Canada
- Languages at home
- 96% English-only · Spanish 2%
Political lean MEDSL · St. Clair
- 2024 margin
- Solid R (+64.1) · D 17.6% · R 81.7%
- 2008→2024 swing
- -0.9pp no change · 2008: -63.2pp · 2024: -64.1pp
- All cycles
- 2024: R+64.1 2020: R+64.0 2016: R+68.6 2012: R+66.1 2008: R+63.2
Not yet ingested
- Civics
- —
Market trends
- HPI YoY
- ▼ -51.53%
- Current HPI
- 182.9461
- Rent YoY
- —
- Metro
- —
- State GDP YoY
- ▲ 2.94%
- F500 in state
- 4
Industry mix (Fortune 500 HQ in AL)
| Industry | F500 HQs | Revenue |
|---|---|---|
| Financial Services | 1 | $8B |
|
||
| Healthcare | 1 | $5B |
|
||
Price history
+93.1% since first listed6 events — show timeline
- 2026-06-10 Listed $135,000 Greater Alabama MLS
- 2024-10-23 Price Changed $154,900 Greater Alabama MLS
- 2023-04-29 Price Changed $154,000 Greater Alabama MLS
- 2021-12-21 Sold (MLS) $42,500 WAMLS
- 2021-11-22 Listed $47,700 WAMLS
- 2020-03-11 Price Changed $69,900 Greater Alabama MLS
Property tax history
-6.4%/yrLatest (2025): $362 · -50.1% YoY. Source: county tax records.
Cash-flow waterfall
monthlySold comps — $/sqft
last 12 mo · ≤1 miLoading sold comps…