20134 State Route 22 · North Pownal, VT
Flood risk 1/10 · Minimal
- FEMA flood zone
- X
- Chance of flooding over 30 yrs
- 0.0%
- Est. flood insurance / yr
- $473 – $860
Fire risk 4/10 · Minor
- Est. fire insurance / yr
- $691 – $1,283
Heat risk 3/10 · Minor
- Hot days now (above 90°F)
- 7 days/yr
- Hot days in 30 yrs
- 17 days/yr
Wind risk 3/10 · Minor
- Chance of severe wind over 30 yrs
- 6.0%
Air-quality risk 2/10 · Minimal
- Unhealthy air days now
- 1 days/yr
- Unhealthy air days in 30 yrs
- 1 days/yr
Risk factors via First Street. Map © Google.
Why this score? — see what drove the D grade
The composite is a weighted blend of 9 inputs, each scored 0–100. Each bar is that input's sub-score; the figure is the points it added to the 100-point composite (weight × sub-score).
- ARV discount +14.5/15.0
- Appreciation +10.0/10.0
- Cash flow +4.7/30.0
- Schools +4.4/10.0
- Rent growth +2.5/5.0
- Livability +2.5/5.0
- Condition / age +2.5/5.0
- 1% rule +1.0/10.0
- DSCR +0.0/10.0
$319,500
🖨 Deal sheet (PDF) 📄 Offer letter ✓ Due diligence
Listing remarks
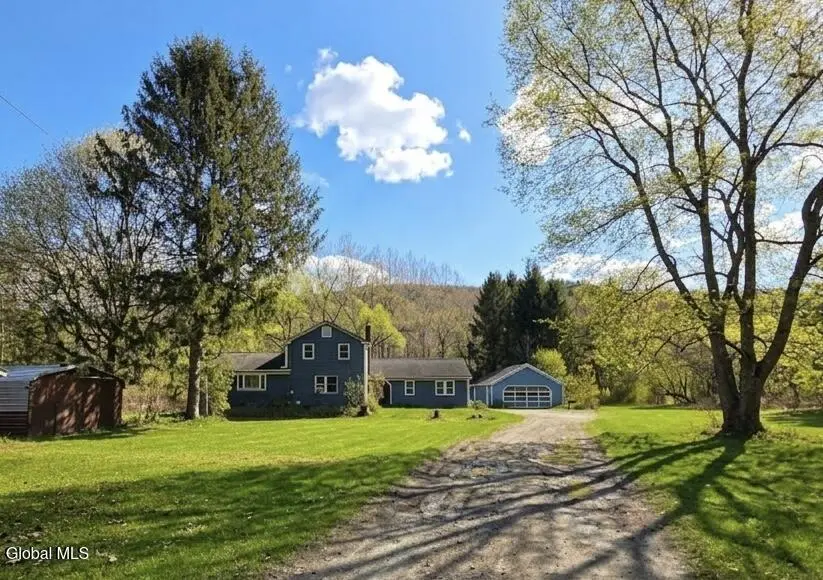
Tucked away on more than 2 private acres and set well back from the road, this versatile farmhouse ad property offers space, privacy, and exceptional flexibility. Large level lawns, beautiful mature trees, and a peaceful setting create the perfect backdrop for country living. The main residence features 3 bedrooms and 2 baths, including a dramatic primary bedroom with a beamed vaulted ceiling and sliding doors that open to the large rear deck. A covered breezeway connects the home to a separate 1-bedroom apartment offering a large living room, kitchen, dining area, bedroom, and full bath. Well-suited for extended family, guests, home office use, or potential Airbnb income, the apartment add
Key facts
- Private acres
- Covered breezeway
- Separate apartment
Tags
Property features AI
Finance
- Other: Property directions: Just off of Rt. 22 in Petersburgh, NY; Air purifier included
Exterior
- Parking: Detached garage; Two garage spaces; Off-street parking, driveway; Total parking spaces for about 15 vehicles
- Security: Smoke detectors; Carbon monoxide detectors
- Utilities: Septic tank; Cable available
- Home design: Single-family residence; Riverfront property on the Little Hoosic River; Secluded, level, wooded and landscaped lot (approximately 2.77 acres)
- Construction: Vinyl siding with drywall interior; Concrete perimeter foundation; Shingle/asphalt roof; Living area approximately 2,700
- Exterior features: Rear porch; Wrap-around porch; Deck; Barn; Exterior lighting; Sheds and barns on the property; Garages (detached)
Interior
- Kitchen: Eat-in kitchen on the first level; Additional kitchen in the in-law/AirBnB suite; Dishwasher; Microwave; Oven; Range; Refrigerator; Water purifier
- Bedrooms: Primary bedroom on the first level with vaulted ceiling; Two additional bedrooms on the second level; An extra bedroom in an in-law/AirBnB suite on the first level
- Flooring: Tile; Vinyl; Hardwood
- Bathrooms: Three full bathrooms (two on the first level, one on the second level); Full bathroom in the in-law/AirBnB suite
- Heating & cooling: Baseboard hot water heating (propane); Window cooling units
- Interior features: High speed internet; Ceiling paddle fans; Vaulted ceilings; Central vacuum; Screens and blinds
- Laundry & utility: Washer and dryer; Laundry located in the basement; Electric water heater; Water softener
Neighborhood map
What this means for you Summary
Snapshot
- This is a 4-bed/3.0-bath single-family listed at $320k.
Deal economics
- At list price, monthly cash flow is $-794 ($-10k/yr) — negative.
- To cash-flow at today's rent, offer at most $179k (43.9% below list).
- To meet the 1% rule (rent ≥ 1% of price), the offer needs to be $190k (40.5% below list).
- Recommended offer: $179k (43.9% below list) — sets the bar for cash-flow.
Location & tenants
- Location reads: area grade D — affects rentability + tenant quality, not the cash-flow math above.
- Hoosick Falls Central School District (rural): math 52% / reading 46% proficiency, ranked #469 of 755 in NY (top 62%) — families likely to look elsewhere, expect single-tenant / working-renter base with shorter leases.
- Zoned schools: Hoosick Falls Elementary School (math 54% / reading 64%, grade B-, #745 of 2,108 statewide, top 39%, 398 students, 53% FRL); Hoosick Falls Middle School (325 students, 54% FRL); Hoosick Falls High School (math 87% / reading 82%, grade A, #379 of 1,100 statewide, top 36%, 329 students, 51% FRL) — zoned schools average 53% FRL vs 35% district-wide (17 pts higher); higher-poverty schools than district average — tighter screening recommended.
- Zoned-school proficiency averages 72% at this address vs 49% district-wide (+23 pts) — the actual schools serving this property are materially stronger than the Hoosick Falls Central School District average implies; a family-tenant draw the district grade alone would hide.
- Market conditions: 405 units permitted in Rensselaer County in 2024 (224 in 5+ unit buildings).
Forward outlook
- In year one you build about $34k of equity ($2k loan paydown + $32k appreciation (10.0% local appreciation)).
- Rensselaer County population projected to shrink 6% by 2050 — rents likely to lag national; underwrite the cash flow, not the appreciation.
- By year 2, paydown + projected appreciation supports a ~$55k cash-out refi (75% LTV) — recoverable capital for the next deal without selling this one.
Negotiation context
- Only 11 days on market — expect competitive offers; lowballing is unlikely to land.
- 9 sale attempts since 16y ago with the ask held roughly flat each time — persistent listings suggest the price (not the market) is what's stuck; bring a comps-based counter.
- Current owner paid $175k; list at $320k implies a 83% gain — meaningful room to come down on a strong offer.
Questions for the listing agent
- What do current leases actually rent for vs. the listed asking? Can we see a recent rent roll and the last 12 months of T-12 income?
- Built in 1976 — when were the roof, HVAC, electrical panel, plumbing, and water heater last replaced?
- Is there a deadline driving the sale (1031 exchange, divorce, estate, relocation)? That informs how much negotiation room exists.
- The area grade is low — what's the realistic commute time and amenity access for the typical tenant pool here? Any planned neighborhood developments (good or bad) we should know about?
- What's the average days-on-market for RENTAL listings here right now (not sales)? A rising rental-DOM trend means longer vacancies and softer asking-rent achievability than the comps imply.
- What's the recent tenant-quality profile in this submarket — average credit score on applications, eviction rate, late-payment / NSF rate, and stable-employment percentage? A property-management company in the area should have these aggregated.
- How much new for-sale + rental construction is in the pipeline within 1–3 miles? Heavy new supply typically softens prices + rents 12–24 months out; constrained supply supports both.
Investment metrics
- 1% rule
- 0.60% ✗
- Cap rate
- 3.31%
- Cash-on-cash
- -10.64%
- DSCR
- 0.53
- GRM
- 14.0
CMA / ARV
- ARV (median comp)
- $378,785
- List price
- $319,500
- Delta
- -7.60%
- Verdict
- FAIR
- Comps
- 2 within 2.0 mi
Projected returns pro-forma
10.0% appreciation · 3.0% rent growth · sell at horizon
- IRR
- 16.8%
- Equity multiple
- 2.38×
- Total profit
- $123,548
- Equity at exit
- $287,831
- IRR
- 16.0%
- Equity multiple
- 5.51×
- Total profit
- $403,739
- Equity at exit
- $620,718
Cash invested: $89,460 (down + closing). Projections, not guarantees.
Landlord ↔ Tenant lean methodology
- Overall (STATE)
- 41 Moderately Tenant-Leaning
- State Vermont
- 41 Moderately Tenant-Leaning · D+15
- County
- — inherits STATE
- City
- — inherits STATE
ZIP-level market 12138
- Home prices YoY
- 9.0%
- Price-to-rent
- 14.0×
Monthly cashflow live
- Estimated rent
- $1,902 medium interval (Pro) →
- Mortgage (P&I)
- −$1,675
- Tax from tax record
- −$487 /mo · $5,847/yr
- Insurance
- −$133
- HOA
- −$0
- Vacancy / Maint / Mgmt
- −$399
- Net cashflow
- $-794
Break-even live
Sensitivity live
| Price | -10% $-613 | -5% $-703 | +0% $-794 | +5% $-884 | +10% $-974 |
|---|---|---|---|---|---|
| Rent | -10% $-944 | -5% $-869 | +0% $-794 | +5% $-718 | +10% $-643 |
| Rate | -1.0pp $-633 | -0.5pp $-712 | base $-794 | +0.5pp $-876 | +1.0pp $-961 |
UW: 25.0% down · 7.5% · 30yr · 1.5% tax · 5.0% vac · 8.0% maint · 8.0% mgmt
Financing live
Cash to close
- Down payment
- $79,875
- Closing costs
- $9,585
- Reserves months
- —
- Total cash needed
- —
Loan-product check · same deal, 3 products live
Conventional
25% down · 7.5% · 30yr
- Down + closing
- —
- Monthly P&I
- —
- Monthly cashflow
- —
- DSCR
- —
- Eligible?
- —
Personal DTI + credit; lowest rate.
DSCR
20% down · 8.5% · 30yr
- Down + closing
- —
- Monthly P&I
- —
- Monthly cashflow
- —
- DSCR
- —
- Eligible?
- —
No personal income docs; deal must DSCR.
Hard money
10% down · 12.0% · 12mo
- Down + closing
- —
- Monthly P&I
- —
- Monthly cashflow
- —
- DSCR
- —
- Eligible?
- —
Short-term bridge; refi at stabilization.
Listing history 30 events
-
2026-06-22days on market $319,500 Active 11 DOM
-
2026-06-21days on market $319,500 Active 10 DOM
-
2026-06-19days on market $319,500 Active 8 DOM
-
2026-06-18days on market $319,500 Active 7 DOM
-
2026-06-17days on market $319,500 Active 6 DOM
-
2026-06-16days on market $319,500 Active 5 DOM
-
2026-06-15days on market $319,500 Active 4 DOM
-
2026-06-14days on market $319,500 Active 2 DOM
-
2026-06-12pricedays on market $319,500 Active 1 DOM
-
2026-06-01days on market $350,000 Active 45 DOM
-
2026-05-31days on market $350,000 Active 44 DOM
-
2026-05-31days on market $350,000 Active 43 DOM
-
2026-05-04price $359,000 746-char remark
-
2026-04-18$369,000 Active 746-char remark
-
2024-05-22historical
-
2024-05-17$310,000 Active
-
2014-10-08soldstatus $175,000
-
2014-09-11soldstatus $175,000
-
2014-07-03historical
-
2014-04-11$180,000
-
2014-03-01historical
-
2013-07-29$219,900
-
2013-07-13historical
-
2012-08-08historical
-
2012-07-29$229,000
-
2012-03-28$239,900
-
2012-03-05historical
-
2011-03-04$239,900
-
2011-02-02historical
-
2010-02-01$250,000
ⓘ Source: listings_history table (triggers on properties + properties_extension) + one-shot
backfill from property_details.listing_events for pre-trigger history.
Tax reassessment forecast VT · Partial reset (capped growth)
- Current annual tax
- $5,847 · $487/mo
- Projected year-2 tax
- $5,959 · $497/mo
- Expected delta
- +$112/yr (+$9/mo · 1.9%)
ⓘ Screening estimate from a state-policy table — verify with the county assessor before closing.
Climate risk First Street
- Flood 1/10 Low FEMA zone X · 0% chance over 30 yrs
- Wildfire 4/10 Moderate
- Heat 3/10 Moderate 7 d/yr ≥90°F today · 17 d/yr by 30 yrs out
- Wind 3/10 Moderate 6% chance of damaging wind over 30 yrs
- Air quality 2/10 Low 1 unhealthy d/yr today · 1 by 30 yrs out
Nearby sold comps map
Loading sold comps map…
Walkable amenities ~0.75 mi
Loading nearby amenities…
Taxation est. · year 1
- Rental income
- $22,820
- − Mortgage interest
- −$17,897
- − Property taxes
- −$5,847
- − Insurance
- −$1,598
- − Repairs & maintenance
- −$1,826
- − Management
- −$1,826
- − Depreciation
- −$9,295
- Taxable loss
- −$15,467
- Est. tax savings @ 24.0%
- +$3,712
- After-tax cash flow
- $-5,811/yr
For passive investors: Depreciation is non-cash, so a rental often shows a tax loss while cash-flowing — sheltering income. Rental losses are passive: they offset passive income freely, and up to $25,000/yr can offset ordinary (W-2) income if you actively participate and your MAGI is under $100k (phasing out to $0 by $150k); unused losses carry forward. On sale, claimed depreciation is recaptured at up to 25%, and gains may owe capital-gains tax (a 1031 exchange can defer both). Figures are a year-1 estimate at your 24.0% rate — not tax advice; consult a CPA.
Schools (NCES district)
- District
- Hoosick Falls Central School District
- NCES district ID
- 3614760
- Math proficiency
- 52% ▲ 5.00%
- Reading proficiency
- 46% ▬ 0.00%
- Median HH income
- $54,349
- Composite
- 44.44/100
- National rank
- #6093
- State rank
- #469 of 755 in NY
Livability — North Pownal
No livability data for this city. (Only ~50 U.S. cities are tracked.)
Census & demographics
- Population (ZIP)
- 2,826
Population outlook (Rensselaer County) Hauer SSP2
- Today (2025)
- 162,400 people
- By 2030
- 161,746 · -0.4%
- By 2040
- 158,095 · -2.7%
- By 2050
- 152,966 · -5.8%
- By 2075
- 140,767 · -13.3%
- By 2100
- 124,727 · -23.2%
Race, ethnicity, and origin ACS 2023
- Neighborhood character
- Predominantly White (90%)
- Race & ethnicity
- White 90% Two or more races 6% Hispanic / Latino 5%
- Common ancestry
- Lithuanian 7% Iranian 3% Romanian 3%
- Foreign-born
- 2% · Canada
- Languages at home
- 98% English-only · Spanish 1%
Political lean MEDSL · Rensselaer
- 2024 margin
- Toss-up / Even · D 50.7% · R 49.3%
- 2008→2024 swing
- -8.0pp toward R · 2008: 9.3pp · 2024: 1.4pp
- All cycles
- 2024: D+1.4 2020: D+5.6 2016: R+2.9 2012: D+11.8 2008: D+9.3
Not yet ingested
- Civics
- —
Market trends
- HPI YoY
- ▲ 26.77%
- Current HPI
- 324.5137
- Rent YoY
- —
- Metro
- —
- State GDP YoY
- —
- F500 in state
- 0
Price history
+27.8% since first listed21 events — show timeline
- 2026-06-11 Listed $319,500 Global MLS
- 2026-06-01 Listing Removed — Global MLS
- 2026-05-28 Price Changed $350,000 Global MLS
- 2026-05-04 Price Changed $359,000 Global MLS
- 2026-04-18 Listed $369,000 Global MLS
- 2024-05-22 Listing Removed — Global MLS
- 2024-05-17 Listed $310,000 Global MLS
- 2014-10-08 Sold (Public Records) $175,000 Public Records
- 2014-09-11 Sold (MLS) $175,000 Global MLS
- 2014-07-03 Listing Removed — Global MLS
- 2014-04-11 Listed $180,000 Global MLS
- 2014-03-01 Listing Removed — Global MLS
- 2013-07-29 Listed $219,900 Global MLS
- 2013-07-13 Listing Removed — Global MLS
- 2012-08-08 Listing Removed — Global MLS
- 2012-07-29 Listed $229,000 Global MLS
- 2012-03-28 Listed $239,900 Global MLS
- 2012-03-05 Listing Removed — Global MLS
- 2011-03-04 Listed $239,900 Global MLS
- 2011-02-02 Listing Removed — Global MLS
- 2010-02-01 Listed $250,000 Global MLS
Property tax history
+1.4%/yrLatest (2025): $5,847 · +10.4% YoY. Source: county tax records.
Cash-flow waterfall
monthlySold comps — $/sqft
last 12 mo · ≤1 miLoading sold comps…