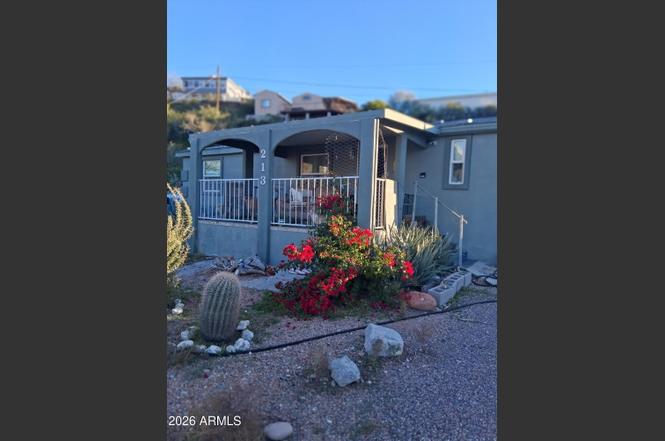
213 W Morris Dr · Queen Valley, AZ
Flood risk 1/10 · Minimal
- FEMA flood zone
- X (unshaded)
- Chance of flooding over 30 yrs
- 0.0%
- Est. flood insurance / yr
- $507 – $1,088
Fire risk 7/10 · Major
- Est. fire insurance / yr
- $610 – $1,132
Heat risk 8/10 · Major
- Hot days now (above 108°F)
- 6 days/yr
- Hot days in 30 yrs
- 17 days/yr
Wind risk 1/10 · Minimal
- Chance of severe wind over 30 yrs
- —
Air-quality risk 2/10 · Minimal
- Unhealthy air days now
- 1 days/yr
- Unhealthy air days in 30 yrs
- 1 days/yr
Risk factors via First Street. Map © Google.
Why this score? — see what drove the D grade
The composite is a weighted blend of 9 inputs, each scored 0–100. Each bar is that input's sub-score; the figure is the points it added to the 100-point composite (weight × sub-score).
- Cash flow +16.2/30.0
- ARV discount +7.4/15.0
- DSCR +5.0/10.0
- 1% rule +3.2/10.0
- Livability +2.6/5.0
- Rent growth +2.5/5.0
- Condition / age +2.5/5.0
- Schools +1.5/10.0
- Appreciation +0.0/10.0
$225,000
🖨 Deal sheet (PDF) 📄 Offer letter ✓ Due diligence
Listing remarks
Finance eligible 3-bed, 1.5-bath manufactured home in Queen Valley, AZ! Amazing mountain views from your porch in this desert retreat. Near top-rated golfing, scenic hiking trails, and endless outdoor adventures. Open floor plan, and a spacious lot with room to relax. Garage and room in the driveway for an RV! Whether you're looking for a full-time residence or a vacation getaway, Come enjoy the beauty of Arizona. Don't miss this opportunity, COME SEE IT TODAY!
Key facts
- Open floor plan
- Scenic hiking trails
- Top-rated golfing
Tags
Property features AI
Finance
- Other: Lot size approximately 8,113 (assessor)
- HOA & community: No association fees; Community pool; Heated community spa; Coin-operated laundry
Exterior
- Parking: Covered parking for 3 vehicles; 2-car garage; 1-car carport
- Utilities: City water; Public sewer
- Home design: Manufactured/mobile home; Fee simple ownership; Mountain views
- Construction: Stucco and wood frame construction; Composition roof
- Exterior features: Storage; Desert front yard; Natural desert in back; Gravel/stone front; County-maintained road access
Interior
- Kitchen: Refrigerator; Dishwasher; Kitchen island; Pantry; Granite counters
- Bedrooms: Up to 4 bedrooms
- Flooring: Carpet; Laminate; Vinyl; Tile
- Bathrooms: 2 full bathrooms
- Heating & cooling: Electric heating; Central air; Ceiling fans
- Interior features: Granite counters; Vaulted ceilings; Kitchen island; Pantry; Furnished (see remarks); Solar screens
- Laundry & utility: Coin-operated laundry available in community
Neighborhood map
What this means for you Summary
Snapshot
- This is a 3-bed/2.0-bath manufactured listed at $225k.
Deal economics
- At list price, monthly cash flow is $121 ($1k/yr) — positive.
- The deal already cash-flows at list — no discount required.
- To meet the 1% rule (rent ≥ 1% of price), the offer needs to be $184k (18.3% below list).
- Recommended offer: $184k (18.3% below list) — sets the bar for 1% rule.
- Cap rate 6.9% vs local median 5.6% in Queen Valley — meaningfully above typical; check what's discounted (condition, days-on-market, listing class) to confirm the premium yield is real.
Location & tenants
- Location reads 51/100 on livability (#322 in AZ) — a working-class tenant base; expect higher turnover. Strengths: cost of living A+, housing A+, crime A; Watch: amenities F, commute F, employment F.
- Apache Junction Unified District (4443) (suburban): math 15% / reading 20% proficiency, ranked #195 of 249 in AZ (top 78%) — low school quality limits family demand, transient renter base, plan for 1-2y turnover.
- Zoned schools: Peralta Trail Elementary School (math 17% / reading 26%, grade F, #717 of 1,109 statewide, top 65%, 286 students, 74% FRL); Cactus Canyon Junior High (math 14% / reading 19%, grade F, #151 of 218 statewide, top 70%, 702 students, 50% FRL); Apache Junction High School (math 12% / reading 17%, grade F, #267 of 381 statewide, top 72%, 999 students, 48% FRL) — zoned schools at 57% FRL track the district average.
- Market conditions: 430 active listings in the ZIP; solid renter incomes; 9,504 units permitted in Pinal County in 2024 (776 in 5+ unit buildings).
Forward outlook
- Local home prices are declining (-3.0%/yr); year-one equity from $2k of loan paydown is wiped out by about $7k of value loss. Plan a longer hold.
Negotiation context
- It's been on market 158 days — a 12% lower offer ($198k) is reasonable based on typical stale-listing flexibility.
- 14 sale attempts since 26y ago with the ask held roughly flat each time — persistent listings suggest the price (not the market) is what's stuck; bring a comps-based counter.
- Current owner paid $173k; 30% above their basis — modest negotiation headroom, anchor on the comps not their cost.
Risks & watch-outs
- Climate carrying-cost: major wildfire risk; extreme-heat days projected 6→17/yr by 2055 (HVAC capex compounding) — expect insurance premiums to compound above CPI over the hold.
Questions for the listing agent
- It's been on market 158 days. Have you received any prior offers? Is the seller open to a 18% concession, seller financing, or rate buy-down credit?
- Why hasn't it sold? Are there any deal-killer items the seller is aware of (foundation, flood, title, zoning, code violations)?
- Is there a deadline driving the sale (1031 exchange, divorce, estate, relocation)? That informs how much negotiation room exists.
- Schools are D-rated, which usually means shorter tenancies and higher turnover. Who's the typical renter profile here, and what's been the actual vacancy rate?
- The area grade is low — what's the realistic commute time and amenity access for the typical tenant pool here? Any planned neighborhood developments (good or bad) we should know about?
- What's the average days-on-market for RENTAL listings here right now (not sales)? A rising rental-DOM trend means longer vacancies and softer asking-rent achievability than the comps imply.
- What's the recent tenant-quality profile in this submarket — average credit score on applications, eviction rate, late-payment / NSF rate, and stable-employment percentage? A property-management company in the area should have these aggregated.
- How much new for-sale + rental construction is in the pipeline within 1–3 miles? Heavy new supply typically softens prices + rents 12–24 months out; constrained supply supports both.
Investment metrics
- 1% rule
- 0.82% ✗
- Cap rate
- 6.94%
- Cash-on-cash
- 2.31%
- DSCR
- 1.10
- GRM
- 10.2
CMA / ARV
- ARV (on-the-fly)
- $224,640
- Comps found
- 6
Show comp detail 6 sales within ~0.75 mi
| Address | Dist | Beds/Ba | Sqft | Sold | Price | $/sf | Match |
|---|---|---|---|---|---|---|---|
| 130 E Donna Dr | 0.41mi | 2/2.0 (-1) | 911 (-5%) | 3mo | $154,000 | $169 | 64 |
| 331 E Diane Dr | 0.44mi | 2/1.5 (-1) | 897 (-7%) | 5mo | $210,000 | $234 | 58 |
| 297 S Alta Vista Dr | 0.13mi | 2/1.0 (-1) | 833 (-13%) | 7mo | $188,000 | $226 | 57 |
| 507 E Phyllis Pl | 0.51mi | 2/1.0 (-1) | 961 (+0%) | 22mo | $299,999 | $312 | 48 |
| 230 E Madeline Dr | 0.33mi | 2/2.0 (-1) | 1,057 (+10%) | 24mo | $289,000 | $273 | 43 |
| 355 N Buckhorn Ct | 0.65mi | 3/1.5 | 1,057 (+10%) | 18mo | $242,000 | $229 | 36 |
Match score weights: distance 35% · size 25% · config 20% · recency 20%. Top-matched comps best support the ARV.
Projected returns pro-forma
-3.0% appreciation · 3.0% rent growth · sell at horizon
- IRR
- -12.7%
- Equity multiple
- 0.54×
- Total profit
- $-28,837
- Equity at exit
- $33,548
- IRR
- -3.7%
- Equity multiple
- 0.75×
- Total profit
- $-15,600
- Equity at exit
- $19,454
Cash invested: $63,000 (down + closing). Projections, not guarantees.
Landlord ↔ Tenant lean methodology
- Overall (STATE)
- 87 Strongly Landlord-Friendly
- State Arizona
- 87 Strongly Landlord-Friendly · R+3
- County
- — inherits STATE
- City
- — inherits STATE
ZIP-level market 85118
- Home prices YoY
- -32.4%
- Active inventory
- 430
- Price-to-rent
- 10.2×
Monthly cashflow live
- Estimated rent
- $1,839 medium interval (Pro) →
- Mortgage (P&I)
- −$1,180
- Tax from tax record
- −$58 /mo · $692/yr
- Insurance
- −$94
- HOA
- −$0
- Vacancy / Maint / Mgmt
- −$386
- Net cashflow
- $121
Break-even live
Sensitivity live
| Price | -10% $249 | -5% $185 | +0% $121 | +5% $58 | +10% $-6 |
|---|---|---|---|---|---|
| Rent | -10% $-24 | -5% $49 | +0% $121 | +5% $194 | +10% $267 |
| Rate | -1.0pp $235 | -0.5pp $179 | base $121 | +0.5pp $63 | +1.0pp $4 |
UW: 25.0% down · 7.5% · 30yr · 1.5% tax · 5.0% vac · 8.0% maint · 8.0% mgmt
Financing live
Cash to close
- Down payment
- $56,250
- Closing costs
- $6,750
- Reserves months
- —
- Total cash needed
- —
Loan-product check · same deal, 3 products live
Conventional
25% down · 7.5% · 30yr
- Down + closing
- —
- Monthly P&I
- —
- Monthly cashflow
- —
- DSCR
- —
- Eligible?
- —
Personal DTI + credit; lowest rate.
DSCR
20% down · 8.5% · 30yr
- Down + closing
- —
- Monthly P&I
- —
- Monthly cashflow
- —
- DSCR
- —
- Eligible?
- —
No personal income docs; deal must DSCR.
Hard money
10% down · 12.0% · 12mo
- Down + closing
- —
- Monthly P&I
- —
- Monthly cashflow
- —
- DSCR
- —
- Eligible?
- —
Short-term bridge; refi at stabilization.
Listing history 50 events
-
2026-06-21days on market $225,000 Active 158 DOM
-
2026-06-18days on market $225,000 Active 155 DOM
-
2026-06-17days on market $225,000 Active 154 DOM
-
2026-06-16days on market $225,000 Active 153 DOM
-
2026-06-15days on market $225,000 Active 152 DOM
-
2026-06-13days on market $225,000 Active 150 DOM
-
2026-06-09days on market $225,000 Active 146 DOM
-
2026-06-08days on market $225,000 Active 145 DOM
-
2026-06-07days on market $225,000 Active 144 DOM
-
2026-06-04days on market $225,000 Active 141 DOM
-
2026-06-03days on market $225,000 Active 140 DOM
-
2026-06-02days on market $225,000 Active 139 DOM
-
2026-06-01days on market $225,000 Active 138 DOM
-
2026-05-31days on market $225,000 Active 137 DOM
-
2026-01-14$225,000 Active
-
2025-12-17historical
-
2025-11-12price $234,500
-
2025-09-18price $239,500
-
2025-07-18price $239,900
-
2025-07-09$240,000 Active
-
2025-07-01historical
-
2025-05-01status Active
-
2025-05-01historical
-
2025-02-23$240,000 Active
-
2024-04-26soldstatus $173,000 Closed
-
2024-04-26soldstatus $173,000
-
2024-04-05status Pending
-
2024-03-22historical Under Contract Accepting Backups
-
2024-03-22soldstatus $173,000 Closed
-
2024-03-06price $180,000
-
2024-03-05status Active
-
2024-02-29status Pending
-
2024-02-21price $235,000
-
2023-12-18$250,000 Active
-
2014-06-30soldstatus $59,000 Closed
-
2014-06-30soldstatus $59,000
-
2014-04-30status Pending
-
2014-04-27$67,000 Active
-
2014-04-26soldstatus $59,000 Closed
-
2014-04-03status Pending
-
2014-02-23price $67,000
-
2013-07-01$69,000 Active
-
2013-05-23historical
-
2013-05-21status Active
-
2013-05-20historical
-
2012-12-30price $69,000
-
2012-05-21$79,900 Active
-
2012-05-18historical
-
2012-04-04$89,900 Active
-
2003-07-01historical
ⓘ Source: listings_history table (triggers on properties + properties_extension) + one-shot
backfill from property_details.listing_events for pre-trigger history.
Tax reassessment forecast AZ · Resets to sale price
- Current annual tax
- $692 · $58/mo
- Projected year-2 tax
- $1,485 · $124/mo
- Expected delta
- +$793/yr (+$66/mo · 114.7%)
ⓘ Screening estimate from a state-policy table — verify with the county assessor before closing.
Climate risk First Street
- Flood 1/10 Low FEMA zone X (unshaded) · 0% chance over 30 yrs
- Wildfire 7/10 Severe
- Heat 8/10 Severe 6 d/yr ≥108°F today · 17 d/yr by 30 yrs out
- Wind 1/10 Low
- Air quality 2/10 Low 1 unhealthy d/yr today · 1 by 30 yrs out
Nearby sold comps map
Loading sold comps map…
Walkable amenities ~0.75 mi
Loading nearby amenities…
Taxation est. · year 1
- Rental income
- $22,066
- − Mortgage interest
- −$12,603
- − Property taxes
- −$692
- − Insurance
- −$1,125
- − Repairs & maintenance
- −$1,765
- − Management
- −$1,765
- − Depreciation
- −$6,545
- Taxable loss
- −$2,430
- Est. tax savings @ 24.0%
- +$583
- After-tax cash flow
- $2,040/yr
For passive investors: Depreciation is non-cash, so a rental often shows a tax loss while cash-flowing — sheltering income. Rental losses are passive: they offset passive income freely, and up to $25,000/yr can offset ordinary (W-2) income if you actively participate and your MAGI is under $100k (phasing out to $0 by $150k); unused losses carry forward. On sale, claimed depreciation is recaptured at up to 25%, and gains may owe capital-gains tax (a 1031 exchange can defer both). Figures are a year-1 estimate at your 24.0% rate — not tax advice; consult a CPA.
Schools (NCES district)
- District
- Apache Junction Unified District (4443)
- NCES district ID
- 0400790
- Math proficiency
- 15% ▼ -17.00%
- Reading proficiency
- 20% ▼ -13.00%
- Median HH income
- $44,930
- Composite
- 15.34/100
- National rank
- #9325
- State rank
- #195 of 249 in AZ
Livability — Queen Valley
- Score
- 51/100
- State rank
- #322
- US rank
- #25478
Category grades
Schools grade is shown separately in the Schools card above.
Census & demographics
- Census place
- Queen Valley, AZ
- County
- Pinal County · 399,947 people
- Metro
- Phoenix-Mesa-Chandler, AZ
- Population (ZIP)
- 14,932
- Household income
- $86,393
- Rent vs Own
- Severe rent burden
- 160.0
Population outlook (Pinal County) Hauer SSP2
- Today (2025)
- 437,574 people
- By 2030
- 446,903 · +2.1%
- By 2040
- 452,589 · +3.4%
- By 2050
- 444,126 · +1.5%
- By 2075
- 430,300 · -1.7%
- By 2100
- 393,536 · -10.1%
Race, ethnicity, and origin ACS 2023
- Neighborhood character
- Predominantly White (86%)
- Race & ethnicity
- White 86% Hispanic / Latino 8% Two or more races 6%
- Hispanic origin (detail)
- Mexican 7%
- Common ancestry
- Portuguese 7% Romanian 4% Slovak 4%
- Foreign-born
- 5% · Canada
- Languages at home
- 96% English-only · Spanish 3%
Political lean MEDSL · Pinal
- 2024 margin
- Strong R (+22.1) · D 38.5% · R 60.6%
- 2008→2024 swing
- -7.6pp toward R · 2008: -14.5pp · 2024: -22.1pp
- All cycles
- 2024: R+22.1 2020: R+17.3 2016: R+19.3 2012: R+17.1 2008: R+14.5
Not yet ingested
- Civics
- —
Market trends
- HPI YoY
- ▼ -122.27%
- Current HPI
- 255.6958
- Rent YoY
- —
- Metro
- Phoenix-Mesa-Chandler, AZ
- State GDP YoY
- ▲ 4.54%
- F500 in state
- 20
Industry mix (Fortune 500 HQ in AZ)
| Industry | F500 HQs | Revenue |
|---|---|---|
| Technology | 2 | $13B |
|
||
| Mining / Metals | 1 | $23B |
|
||
| Environmental Services | 1 | $16B |
|
||
| Metals / Steel | 1 | $14B |
|
||
| Technology Distribution | 1 | $9B |
|
||
| Homebuilding | 1 | $8B |
|
||
Price history
+1400.0% since first listed42 events — show timeline
- 2026-01-14 Listed $225,000 ARMLS
- 2025-12-17 Listing Removed — ARMLS
- 2025-11-12 Price Changed $234,500 ARMLS
- 2025-09-18 Price Changed $239,500 ARMLS
- 2025-07-18 Price Changed $239,900 ARMLS
- 2025-07-09 Listed $240,000 ARMLS
- 2025-07-01 Listing Removed — ARMLS
- 2025-05-01 Relisted — ARMLS
- 2025-05-01 Listing Removed — ARMLS
- 2025-02-23 Listed $240,000 ARMLS
- 2024-04-26 Sold (Public Records) $173,000 Public Records
- 2024-04-26 Sold (MLS) $173,000 ARMLS
- 2024-04-05 Pending — ARMLS
- 2024-03-22 Contingent — ARMLS
- 2024-03-22 Sold (MLS) $173,000 ARMLS
- 2024-03-06 Price Changed $180,000 ARMLS
- 2024-03-05 Relisted — ARMLS
- 2024-02-29 Pending — ARMLS
- 2024-02-21 Price Changed $235,000 ARMLS
- 2023-12-18 Listed $250,000 ARMLS
- 2014-06-30 Sold (Public Records) $59,000 Public Records
- 2014-06-30 Sold (MLS) $59,000 ARMLS
- 2014-04-30 Pending — ARMLS
- 2014-04-27 Listed $67,000 ARMLS
- 2014-04-26 Sold (MLS) $59,000 ARMLS
- 2014-04-03 Pending — ARMLS
- 2014-02-23 Price Changed $67,000 ARMLS
- 2013-07-01 Listed $69,000 ARMLS
- 2013-05-23 Listing Removed — ARMLS
- 2013-05-21 Relisted — ARMLS
- 2013-05-20 Listing Removed — ARMLS
- 2012-12-30 Price Changed $69,000 ARMLS
- 2012-05-21 Listed $79,900 ARMLS
- 2012-05-18 Listing Removed — ARMLS
- 2012-04-04 Listed $89,900 ARMLS
- 2003-07-01 Listing Removed — ARMLS
- 2002-10-22 Listed $74,900 ARMLS
- 2001-10-18 Listing Removed — ARMLS
- 2001-10-08 Listed $75,000 ARMLS
- 2001-09-30 Listing Removed — ARMLS
- 2000-06-09 Listed $79,900 ARMLS
- 1988-03-29 Sold (Public Records) $15,000 Public Records
Property tax history
+5.6%/yrLatest (2025): $692 · +5.0% YoY. Source: county tax records.
Cash-flow waterfall
monthlySold comps — $/sqft
last 12 mo · ≤1 miLoading sold comps…