 🏷️ Likely Rental
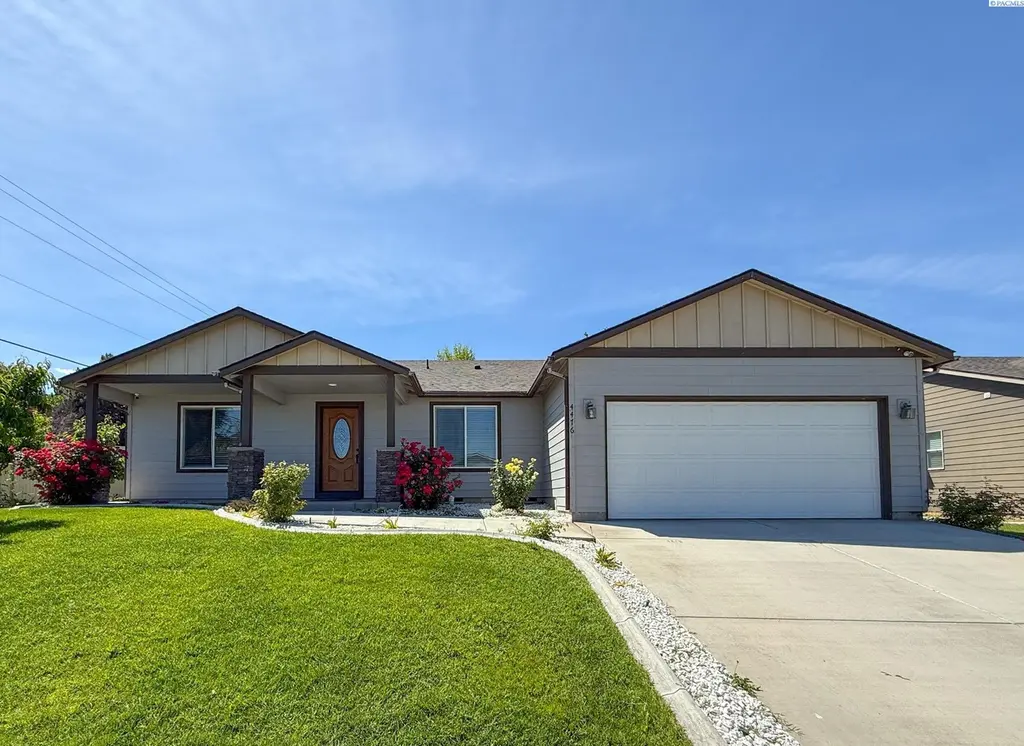
4476 S Palouse Pl · Kennewick, WA
Flood risk 1/10 · Minimal
- FEMA flood zone
- X
- Chance of flooding over 30 yrs
- 0.0%
- Est. flood insurance / yr
- $507 – $1,088
Fire risk 4/10 · Minor
- Est. fire insurance / yr
- $604 – $1,122
Heat risk 5/10 · Moderate
- Hot days now (above 98°F)
- 7 days/yr
- Hot days in 30 yrs
- 15 days/yr
Wind risk 1/10 · Minimal
- Chance of severe wind over 30 yrs
- —
Air-quality risk 8/10 · Major
- Unhealthy air days now
- 15 days/yr
- Unhealthy air days in 30 yrs
- 16 days/yr
Risk factors via First Street. Map © Google.
Why this score? — see what drove the D+ grade
The composite is a weighted blend of 9 inputs, each scored 0–100. Each bar is that input's sub-score; the figure is the points it added to the 100-point composite (weight × sub-score).
- Cash flow +15.0/30.0
- ARV discount +7.5/15.0
- 1% rule +5.0/10.0
- DSCR +5.0/10.0
- Schools +4.6/10.0
- Livability +3.9/5.0
- Rent growth +2.5/5.0
- Condition / age +2.5/5.0
- Appreciation +0.0/10.0
$2,295
🖨 Deal sheet 📄 Offer letter ✓ Due diligence
Listing remarks MLS
Gorgeous one-story rambler! Open floor plan concept with a large, vaulted living area creates a spacious feel. Split bedroom design means you have a private, quiet master bedroom. 4th bedroom/den/office included. Large dining area with 10' ceilings. Will be fully landscaped by the end of construction. There's still plenty of time to pick out some custom options! 12-18 We added a corner, soaker, garden tub to the master suite!
Key facts
- Dual vanities
- Soaking tub
- Gas fireplace
Tags
Property features AI
Exterior
- Parking: 2 total parking spaces; 2 covered parking spaces; 2-car garage
- Home design: Single-family residence; Site-built on owned lot; One level / single-story; New construction
- Construction: Built as new construction
- Exterior features: Lot is approximately 0.21 acres; Subdivision: ROYAL ANN PH1; Zoned for single-family residential
Interior
- Bathrooms: 2 full bathrooms
- Interior features: No basement
Neighborhood map
What this means for you Summary
Snapshot
- This is a 4-bed/2.0-bath single-family listed at $2k.
Deal economics
- At list price, monthly cash flow is $2k ($26k/yr) — positive.
- The deal already cash-flows at list — no discount required.
- Meets the 1% rule at list price ($3k rent vs $2k).
- Cap rate 1153.2% vs local median 3.3% in Kennewick — top-decile yield for the area; either an underpriced asset or a hidden risk that comps aren't pricing in. Stress-test before assuming the spread holds.
Location & tenants
- Location reads 78/100 on livability (#131 in WA, #2,599 nationally) — a middle-class / working-renter tenant base. Strengths: commute A+, housing A+, health & safety A; Watch: schools D+, amenities D+, crime F.
- Kennewick School District (urban): math 43% / reading 58% proficiency, ranked #141 of 291 in WA (top 48%) — acceptable for families but not a draw, mixed tenant base, ~2y average lease.
- Market conditions: 246 active listings in the ZIP; 3 comparable units currently listed for rent nearby; rentals lingering (median 44d on market — plan ~5-8 weeks vacancy on turnover, expect pricing pressure); 67% of comp listings sitting > 30 days — soft ceiling on asking rent; solid renter incomes; 1,532 units permitted in Benton County in 2024 (389 in 5+ unit buildings).
- This rent runs 34% of the median local income ($99k/yr) — at the standard rent-burdened threshold; future hikes will face affordability resistance.
Forward outlook
- Local home prices are declining (-3.0%/yr); year-one equity from $16 of loan paydown is wiped out by about $69 of value loss. Plan a longer hold.
- Benton County population projected at +32% by 2050 — long-run rental-demand tailwind backs the buy-and-hold thesis.
- At projected returns (-3.0% appreciation + 3.0% rent growth), your $643 cash investment doubles in ~1 year — after that, you're playing with house money.
Negotiation context
- Only 12 days on market — expect competitive offers; lowballing is unlikely to land.
- 2 sale attempts since 11y ago with the ask held roughly flat each time — persistent listings suggest the price (not the market) is what's stuck; bring a comps-based counter.
Risks & watch-outs
- Climate carrying-cost: extreme-heat days projected 7→15/yr by 2055 (HVAC capex compounding) — expect insurance premiums to compound above CPI over the hold.
Questions for the listing agent
- Is there a deadline driving the sale (1031 exchange, divorce, estate, relocation)? That informs how much negotiation room exists.
- Schools are D-rated, which usually means shorter tenancies and higher turnover. Who's the typical renter profile here, and what's been the actual vacancy rate?
- Crime grade is F in this area — have there been break-ins, vandalism, or insurance claims at this property in the last 3 years? What carrier currently insures it and at what premium?
- The area grade is low — what's the realistic commute time and amenity access for the typical tenant pool here? Any planned neighborhood developments (good or bad) we should know about?
- What's the average days-on-market for RENTAL listings here right now (not sales)? A rising rental-DOM trend means longer vacancies and softer asking-rent achievability than the comps imply.
- What's the recent tenant-quality profile in this submarket — average credit score on applications, eviction rate, late-payment / NSF rate, and stable-employment percentage? A property-management company in the area should have these aggregated.
- How much new for-sale + rental construction is in the pipeline within 1–3 miles? Heavy new supply typically softens prices + rents 12–24 months out; constrained supply supports both.
Investment metrics
- 1% rule
- 121.85% ✓
- Cap rate
- 1153.18%
- Cash-on-cash
- 4096.04%
- DSCR
- 183.25
- GRM
- 0.1
CMA / ARV
- ARV (on-the-fly)
- $448,960
- Comps found
- 12
Show comp detail 12 sales within ~0.75 mi
| Address | Dist | Beds/Ba | Sqft | Sold | Price | $/sf | Match |
|---|---|---|---|---|---|---|---|
| 4612 S Quincy Pl | 0.16mi | 3/2.0 (-1) | 1,805 (-2%) | 2mo | $241,000 | $134 | 82 |
| 4617 S Quincy Pl | 0.15mi | 4/2.5 | 1,934 (+5%) | 3mo | $457,000 | $236 | 80 |
| 3906 S Quincy St | 0.25mi | 3/2.0 (-1) | 1,726 (-6%) | 5mo | $435,000 | $252 | 69 |
| 1716 W 40th Ave | 0.26mi | 4/2.0 | 1,678 (-9%) | 6mo | $410,000 | $244 | 68 |
| 3710 S Sharron St | 0.44mi | 3/2.0 (-1) | 1,770 (-4%) | 2mo | $405,000 | $229 | 66 |
| 4806 S Kent St | 0.44mi | 3/3.0 (-1) | 1,888 (+3%) | 4mo | $450,000 | $238 | 63 |
| 1519 W 33rd Pl | 0.63mi | 3/2.0 (-1) | 1,770 (-4%) | 5mo | $465,000 | $263 | 55 |
| 2629 W 44th Pl | 0.74mi | 3/2.0 (-1) | 1,904 (+4%) | 1mo | $529,900 | $278 | 54 |
| 4007 S Mayfield St | 0.33mi | 3/1.5 (-1) | 1,584 (-14%) | 4mo | $370,000 | $234 | 51 |
| 909 W 34th Ave | 0.73mi | 4/2.5 | 1,925 (+5%) | 6mo | $443,000 | $230 | 51 |
| 2604 W 44th Pl | 0.71mi | 3/2.0 (-1) | 2,052 (+12%) | 0mo | $539,900 | $263 | 42 |
| 2306 W 37th Ave | 0.73mi | 3/2.0 (-1) | 1,598 (-13%) | 4mo | $390,000 | $244 | 35 |
Match score weights: distance 35% · size 25% · config 20% · recency 20%. Top-matched comps best support the ARV.
Projected returns pro-forma
-3.0% appreciation · 3.0% rent growth · sell at horizon
- IRR
- —
- Equity multiple
- 217.89×
- Total profit
- $139,371
- Equity at exit
- $342
- IRR
- —
- Equity multiple
- 470.06×
- Total profit
- $301,420
- Equity at exit
- $198
Cash invested: $643 (down + closing). Projections, not guarantees.
Landlord ↔ Tenant lean methodology
- Overall (STATE)
- 28 Tenant-Leaning
- State Washington
- 28 Tenant-Leaning · D+8
- County
- — inherits STATE
- City
- — inherits STATE
ZIP-level market 99337
- Active inventory
- 246
- Price-to-rent
- 0.1×
Monthly cashflow live
- Estimated rent
- $2,797 medium interval (Pro) →
- Mortgage (P&I)
- −$12
- Tax est. 1.5%
- −$3 /mo · $34/yr
- Insurance
- −$1
- HOA
- −$0
- Vacancy / Maint / Mgmt
- −$587
- Net cashflow
- $2,193
Break-even live
UW: 25.0% down · 7.5% · 30yr · 1.5% tax · 5.0% vac · 8.0% maint · 8.0% mgmt
Financing live
Cash to close
- Down payment
- $574
- Closing costs
- $69
- Reserves months
- —
- Total cash needed
- —
Loan-product check · same deal, 3 products live
Conventional
25% down · 7.5% · 30yr
- Down + closing
- —
- Monthly P&I
- —
- Monthly cashflow
- —
- DSCR
- —
- Eligible?
- —
Personal DTI + credit; lowest rate.
DSCR
20% down · 8.5% · 30yr
- Down + closing
- —
- Monthly P&I
- —
- Monthly cashflow
- —
- DSCR
- —
- Eligible?
- —
No personal income docs; deal must DSCR.
Hard money
10% down · 12.0% · 12mo
- Down + closing
- —
- Monthly P&I
- —
- Monthly cashflow
- —
- DSCR
- —
- Eligible?
- —
Short-term bridge; refi at stabilization.
Rent comps 3 comps
| Address | Beds | Baths | Sqft | Rent | $/sqft | DOM | Units | Dist |
|---|---|---|---|---|---|---|---|---|
| 4201 S Vancouver St Kennewick, WA | 5.0 | 2.0 | 2149 | $3,500 | $1.63 | 43d | 1 | 0.42mi |
| 3704 S Vancouver St Kennewick, WA | 3.0 | 2.0 | 1794 | $2,195 | $1.22 | 43d | 1 | 0.60mi |
| 1701 W 30th Ave Kennewick, WA | 3.0 | 2.0 | 1500 | $2,195 | $1.46 | 13d | 1 | 0.85mi |
Listing history 9 events
-
2026-06-03days on market $2,295 Active 12 DOM
-
2026-06-02days on market $2,295 Active 11 DOM
-
2026-06-01days on market $2,295 Active 10 DOM
-
2026-05-31days on market $2,295 Active 9 DOM
-
2026-05-30days on market $2,295 Active 8 DOM
-
2026-05-22$2,295 Active
-
2016-03-01soldstatus $220,630 430-char remark
Show marketing remark (430 chars)
Gorgeous one-story rambler! Open floor plan concept with a large, vaulted living area creates a spacious feel. Split bedroom design means you have a private, quiet master bedroom. 4th bedroom/den/office included. Large dining area with 10' ceilings. Will be fully landscaped by the end of construction. There's still plenty of time to pick out some custom options! 12-18 We added a corner, soaker, garden tub to the master suite!
-
2015-12-11$217,100 430-char remark
Show marketing remark (430 chars)
Gorgeous one-story rambler! Open floor plan concept with a large, vaulted living area creates a spacious feel. Split bedroom design means you have a private, quiet master bedroom. 4th bedroom/den/office included. Large dining area with 10' ceilings. Will be fully landscaped by the end of construction. There's still plenty of time to pick out some custom options! 12-18 We added a corner, soaker, garden tub to the master suite!
-
2014-08-29soldstatus $266,100
ⓘ Source: listings_history table (triggers on properties + properties_extension) + one-shot
backfill from property_details.listing_events for pre-trigger history.
Climate risk First Street
- Flood 1/10 Low FEMA zone X · 0% chance over 30 yrs
- Wildfire 4/10 Moderate
- Heat 5/10 Major 7 d/yr ≥98°F today · 15 d/yr by 30 yrs out
- Wind 1/10 Low
- Air quality 8/10 Severe 15 unhealthy d/yr today · 16 by 30 yrs out
Nearby sold comps map
Loading sold comps map…
Walkable amenities ~0.75 mi
Loading nearby amenities…
Taxation est. · year 1
- Rental income
- $33,559
- − Mortgage interest
- −$129
- − Property taxes
- −$34
- − Insurance
- −$11
- − Repairs & maintenance
- −$2,685
- − Management
- −$2,685
- − Depreciation
- −$67
- Taxable income
- $27,948
- Est. tax owed @ 24.0%
- −$6,708
- After-tax cash flow
- $19,614/yr
For passive investors: Depreciation is non-cash, so a rental often shows a tax loss while cash-flowing — sheltering income. Rental losses are passive: they offset passive income freely, and up to $25,000/yr can offset ordinary (W-2) income if you actively participate and your MAGI is under $100k (phasing out to $0 by $150k); unused losses carry forward. On sale, claimed depreciation is recaptured at up to 25%, and gains may owe capital-gains tax (a 1031 exchange can defer both). Figures are a year-1 estimate at your 24.0% rate — not tax advice; consult a CPA.
Schools (NCES district)
- District
- Kennewick School District
- NCES district ID
- 5303930
- Math proficiency
- 43% ▼ -1.00%
- Reading proficiency
- 58% ▬ 0.00%
- Median HH income
- $54,191
- Composite
- 45.56/100
- National rank
- #5667
- State rank
- #141 of 291 in WA
Livability — Kennewick
- Score
- 78/100
- State rank
- #131
- US rank
- #2599
Category grades
Schools grade is shown separately in the Schools card above.
Census & demographics
- Census place
- Kennewick, WA
- County
- Benton County · 186,895 people
- City population
- 104,655
- Metro
- Kennewick-Richland, WA
- Population (ZIP)
- 33,287
- Household income
- $98,848
- Rent vs Own
- Severe rent burden
- 430.0
Population outlook (Benton County) Hauer SSP2
- Today (2025)
- 219,421 people
- By 2030
- 233,813 · +6.6%
- By 2040
- 262,134 · +19.5%
- By 2050
- 290,100 · +32.2%
- By 2075
- 363,525 · +65.7%
- By 2100
- 418,667 · +90.8%
Race, ethnicity, and origin ACS 2023
- Neighborhood character
- Predominantly White (67%)
- Race & ethnicity
- White 67% Hispanic / Latino 26% Two or more races 13% Asian 1% Black 1%
- Hispanic origin (detail)
- Mexican 24%
- Common ancestry
- Lithuanian 4% Portuguese 3% Iranian 2%
- Foreign-born
- 12% · Canada, Vietnam
- Languages at home
- 76% English-only · Spanish 20% Russian/Polish/Slavic 2%
Political lean MEDSL · Benton
- 2024 margin
- Strong R (+21.9) · D 37.7% · R 59.6% · Other 2.7%
- 2008→2024 swing
- +4.2pp toward D · 2008: -26.1pp · 2024: -21.9pp
- All cycles
- 2024: R+21.9 2020: R+21.0 2016: R+26.6 2012: R+27.0 2008: R+26.1
Not yet ingested
- Civics
- —
Market trends
- HPI YoY
- ▼ -260.38%
- Current HPI
- 245.5375
- Rent YoY
- —
- Metro
- Kennewick-Richland, WA
- State GDP YoY
- ▲ 4.65%
- F500 in state
- 22
Industry mix (Fortune 500 HQ in WA)
| Industry | F500 HQs | Revenue |
|---|---|---|
| Retail | 2 | $269B |
|
||
| Technology / Retail | 1 | $638B |
|
||
| Technology | 1 | $245B |
|
||
| Telecommunications | 1 | $38B |
|
||
| Food / Beverage | 1 | $36B |
|
||
| Automotive / Trucks | 1 | $34B |
|
||
Price history
-99.1% since first listed4 events — show timeline
- 2026-05-22 Listed $2,295 PACMLS
- 2016-03-01 Sold (MLS) $220,630 PACMLS
- 2015-12-11 Listed $217,100 PACMLS
- 2014-08-29 Sold (Public Records) $266,100 Public Records
Property tax history
+17.5%/yrLatest (2026): $2,676 · -21.1% YoY. Source: county tax records.
Cash-flow waterfall
monthlySold comps — $/sqft
last 12 mo · ≤1 miLoading sold comps…