 🏷️ Likely Rental
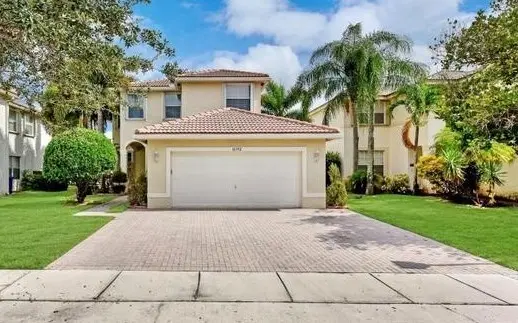
16392 SW 29th St · Miramar, FL
Flood risk 1/10 · Minimal
- FEMA flood zone
- X (shaded)
- Chance of flooding over 30 yrs
- 0.0%
- Est. flood insurance / yr
- $507 – $1,088
Fire risk 1/10 · Minimal
- Est. fire insurance / yr
- $947 – $1,759
Heat risk 9/10 · Severe
- Hot days now (above 106°F)
- 7 days/yr
- Hot days in 30 yrs
- 26 days/yr
Wind risk 10/10 · Severe
- Chance of severe wind over 30 yrs
- 99.0%
Air-quality risk 2/10 · Minimal
- Unhealthy air days now
- 1 days/yr
- Unhealthy air days in 30 yrs
- 2 days/yr
Risk factors via First Street. Map © Google.
Why this score? — see what drove the D+ grade
The composite is a weighted blend of 9 inputs, each scored 0–100. Each bar is that input's sub-score; the figure is the points it added to the 100-point composite (weight × sub-score).
- Cash flow +15.0/30.0
- ARV discount +7.5/15.0
- 1% rule +5.0/10.0
- DSCR +5.0/10.0
- Schools +4.1/10.0
- Appreciation +4.0/10.0
- Livability +4.0/5.0
- Rent growth +2.5/5.0
- Condition / age +2.5/5.0
$5,000
🖨 Deal sheet 📄 Offer letter ✓ Due diligence
Listing remarks MLS
Lakefront 5 Bed / 3 Bath home located inside the private and guard-gated community of Silver Isles. This spectacular two-story home boasts a generous layout with high-volume ceilings, tile/wood floors, and a renovated eat-in kitchen, complete with New Appliances, granite countertops, a center island, plus a separate breakfast area. The home offers a spacious first-floor bedroom, Accordion shutters throughout, as well as an oversized primary second-floor bedroom with two walk-in closets. Best of all, this fully-fenced home has a big backyard with direct lakefront views. Community amenities include a clubhouse, resort-style pool area, playgrounds, picnic area, 24-hour security, and more!
Key facts
- 2 garage spots
- Built 2002
- Listed 7 days
Property features AI
Exterior
- Parking: Two-car garage
- Home design: Residential property
- Exterior features: Zoned RS6
Interior
- Bathrooms: Three full bathrooms
- Interior features: From Interstate 75, take Exit 7 onto Miramar Parkway and head west, then turn left onto SW 164th Ave and right onto SW 29th St; continue ahead and the property will be on the right-hand side.
Neighborhood map
What this means for you Summary
Snapshot
- This is a 4-bed/3.0-bath single-family listed at $5k.
Deal economics
- At list price, monthly cash flow is $4k ($45k/yr) — positive.
- The deal already cash-flows at list — no discount required.
- Meets the 1% rule at list price ($5k rent vs $5k).
- Cap rate 906.9% vs local median 3.3% in Miramar — top-decile yield for the area; either an underpriced asset or a hidden risk that comps aren't pricing in. Stress-test before assuming the spread holds.
Location & tenants
- Location reads 80/100 on livability (#111 in FL, #1,721 nationally) — a professional / high-income tenant draw. Strengths: housing A+, health & safety A+, crime A; Watch: commute D+, cost of living D+, amenities D.
- Broward (suburban): math 42% / reading 53% proficiency, ranked #46 of 73 in FL (top 63%) — families likely to look elsewhere, expect single-tenant / working-renter base with shorter leases.
- Market conditions: Rents soft (-0.2%/yr); 543 active listings in the ZIP; 35 comparable units currently listed for rent nearby; rentals at typical pace (median 21d on market — plan ~3-4 weeks tenant-placement turnaround); solid renter incomes; 2,111 units permitted in Broward County in 2024 (1,265 in 5+ unit buildings).
- At $4,794/mo this rent would consume 75% of the median local household income ($77k/yr) (locally 1728% of renters already pay >50% of income on rent) — very limited rent-growth headroom before tenants either downsize or default.
Forward outlook
- Local home prices are declining (-2.0%/yr); year-one equity from $35 of loan paydown is wiped out by about $101 of value loss. Plan a longer hold.
- Broward County population projected at +34% by 2050 — long-run rental-demand tailwind backs the buy-and-hold thesis.
- At projected returns (-2.0% appreciation + 0.0% rent growth), your $1k cash investment doubles in ~1 year — after that, you're playing with house money.
Negotiation context
- Only 7 days on market — expect competitive offers; lowballing is unlikely to land.
- 5 sale attempts since 11y ago with the ask held roughly flat each time — persistent listings suggest the price (not the market) is what's stuck; bring a comps-based counter.
Risks & watch-outs
- Climate carrying-cost: severe wind risk, 99% chance of damaging wind over 30y; extreme-heat days projected 7→26/yr by 2055 (HVAC capex compounding) — expect insurance premiums to compound above CPI over the hold.
Questions for the listing agent
- Is there a deadline driving the sale (1031 exchange, divorce, estate, relocation)? That informs how much negotiation room exists.
- Schools are B-rated — typically a magnet for longer-tenancy family renters. What's the average tenant stay here, and is there a school-zone premium baked into asking?
- The area grade is low — what's the realistic commute time and amenity access for the typical tenant pool here? Any planned neighborhood developments (good or bad) we should know about?
- This sits on a lake — are riparian / water-frontage rights deeded with the parcel? Any dock permits, shoreline easements, or HOA water-use restrictions?
- What's the documented flood / surge / shoreline-erosion history here (FEMA AND non-FEMA — e.g., storm surge, creek backup, septic-field saturation)?
- Any water-quality or seasonal algae-bloom issues that affect tenant satisfaction or short-term-rental demand?
- What's the average days-on-market for RENTAL listings here right now (not sales)? A rising rental-DOM trend means longer vacancies and softer asking-rent achievability than the comps imply.
- What's the recent tenant-quality profile in this submarket — average credit score on applications, eviction rate, late-payment / NSF rate, and stable-employment percentage? A property-management company in the area should have these aggregated.
- How much new for-sale + rental construction is in the pipeline within 1–3 miles? Heavy new supply typically softens prices + rents 12–24 months out; constrained supply supports both.
Investment metrics
- 1% rule
- 95.88% ✓
- Cap rate
- 906.90%
- Cash-on-cash
- 3216.46%
- DSCR
- 144.11
- GRM
- 0.1
CMA / ARV
- ARV (on-the-fly)
- $796,374
- Comps found
- 8
Show comp detail 8 sales within ~0.75 mi
| Address | Dist | Beds/Ba | Sqft | Sold | Price | $/sf | Match |
|---|---|---|---|---|---|---|---|
| 16390 SW 28th Ct | 0.05mi | 4/2.5 | 2,491 (-6%) | 9mo | $655,000 | $263 | 79 |
| 16178 SW 27th St | 0.22mi | 4/2.5 | 2,491 (-6%) | 1mo | $765,000 | $307 | 78 |
| 16340 SW 26th St | 0.27mi | 4/2.5 | 2,383 (-10%) | 2mo | $798,880 | $335 | 68 |
| 15856 SW 26th St | 0.40mi | 4/3.0 | 2,707 (+3%) | 16mo | $700,000 | $259 | 64 |
| 3645 SW 162nd Ave | 0.54mi | 4/2.5 | 2,481 (-6%) | 1mo | $750,000 | $302 | 62 |
| 16285 SW 19th St | 0.61mi | 4/4.0 | 2,707 (+3%) | 6mo | $710,000 | $262 | 58 |
| 16331 SW 23rd St | 0.41mi | 4/2.5 | 2,383 (-10%) | 10mo | $730,000 | $306 | 54 |
| 2061 SW 157th Ave | 0.64mi | 5/3.0 (+1) | 2,637 (0%) | 17mo | $735,000 | $279 | 51 |
Match score weights: distance 35% · size 25% · config 20% · recency 20%. Top-matched comps best support the ARV.
Projected returns pro-forma
-2.01% appreciation · 0.0% rent growth · sell at horizon
- IRR
- —
- Equity multiple
- 161.30×
- Total profit
- $224,424
- Equity at exit
- $968
- IRR
- —
- Equity multiple
- 321.97×
- Total profit
- $449,363
- Equity at exit
- $825
Cash invested: $1,400 (down + closing). Projections, not guarantees.
Landlord ↔ Tenant lean methodology
- Overall (STATE)
- 87 Strongly Landlord-Friendly
- State Florida
- 87 Strongly Landlord-Friendly · R+3
- County
- — inherits STATE
- City
- — inherits STATE
ZIP-level market 33027
- Home prices YoY
- -0.6%
- Rents YoY
- -0.2%
- Active inventory
- 543
- Price-to-rent
- 0.1×
Monthly cashflow live
- Estimated rent
- $4,794 high interval (Pro) →
- Mortgage (P&I)
- −$26
- Tax est. 1.5%
- −$6 /mo · $75/yr
- Insurance
- −$2
- HOA
- −$0
- Vacancy / Maint / Mgmt
- −$1,007
- Net cashflow
- $3,753
Break-even live
UW: 25.0% down · 7.5% · 30yr · 1.5% tax · 5.0% vac · 8.0% maint · 8.0% mgmt
Financing live
Cash to close
- Down payment
- $1,250
- Closing costs
- $150
- Reserves months
- —
- Total cash needed
- —
Loan-product check · same deal, 3 products live
Conventional
25% down · 7.5% · 30yr
- Down + closing
- —
- Monthly P&I
- —
- Monthly cashflow
- —
- DSCR
- —
- Eligible?
- —
Personal DTI + credit; lowest rate.
DSCR
20% down · 8.5% · 30yr
- Down + closing
- —
- Monthly P&I
- —
- Monthly cashflow
- —
- DSCR
- —
- Eligible?
- —
No personal income docs; deal must DSCR.
Hard money
10% down · 12.0% · 12mo
- Down + closing
- —
- Monthly P&I
- —
- Monthly cashflow
- —
- DSCR
- —
- Eligible?
- —
Short-term bridge; refi at stabilization.
Rent comps 35 comps
| Address | Beds | Baths | Sqft | Rent | $/sqft | DOM | Units | Dist |
|---|---|---|---|---|---|---|---|---|
| 2950 SW 163rd Ave Miramar, FL | 4.0 | 2.5 | 2491 | $5,000 | $2.01 | 22d | 1 | 0.05mi |
| 2755 SW 165th Ave Miramar, FL | 4.0 | 2.5 | 2501 | $4,800 | $1.92 | 20d | 1 | 0.21mi |
| 2755 SW 165th Ave Miramar, FL | 4.0 | 2.5 | 2501 | $4,800 | $1.92 | 24d | 1 | 0.21mi |
| 16500 SW 37th St #16500 Miramar, FL | 4.0 | 3.5 | 2688 | $4,900 | $1.82 | 24d | 1 | 0.61mi |
| 1892 SW 162nd Ave Miramar, FL | 4.0 | 3.0 | 2129 | $4,200 | $1.97 | 5d | 1 | 0.64mi |
| 1892 SW 162nd Ave Miramar, FL | 4.0 | 3.0 | 2129 | $4,200 | $1.97 | 12d | 1 | 0.64mi |
| 3802 SW 165th Ter Miramar, FL | 4.0 | 3.5 | 2693 | $5,000 | $1.86 | 15d | 1 | 0.68mi |
| 3529 SW 169th Ter #3529 Miramar, FL | 4.0 | 2.0 | 1869 | $3,900 | $2.09 | 24d | 1 | 0.69mi |
| 3529 SW 169th Ter #3529 Miramar, FL | 4.0 | 2.0 | 1869 | $3,900 | $2.09 | 7d | 1 | 0.69mi |
| 15957 SW 16th St Unit N/A Pembroke Pines, FL | 4.0 | 3.0 | 2718 | $5,290 | $1.95 | 3d | 1 | 0.85mi |
| 17047 SW 38th Ct Miramar, FL | 4.0 | 2.5 | 1869 | $3,800 | $2.03 | 24d | 1 | 0.86mi |
| 17116 SW 39th Ct Miramar, FL | 3.0 | 2.5 | 1761 | $3,900 | $2.21 | 24d | 1 | 0.98mi |
| 15857 SW 16th St Pembroke Pines, FL | 3.0 | 2.5 | 1903 | $3,850 | $2.02 | 24d | 1 | 0.99mi |
| 14841 SW 20th St Miramar, FL | 5.0 | 3.0 | 2637 | $4,400 | $1.67 | 24d | 1 | 1.00mi |
| 17353 SW 22nd St Unit 17353 Miramar, FL | 3.0 | 2.5 | 1854 | $3,800 | $2.05 | 24d | 1 | 1.05mi |
| 17353 SW 22nd St Miramar, FL | 3.0 | 2.5 | 1854 | $4,700 | $2.54 | 15d | 1 | 1.05mi |
| 4904 SW 166th Ave Miramar, FL | 4.0 | 3.0 | 3077 | $29,900 | $9.72 | 24d | 1 | 1.05mi |
| 16801 SW 49th Ct Miramar, FL | 4.0 | 3.0 | 2624 | $4,500 | $1.71 | 24d | 1 | 1.11mi |
| 17367 SW 20th Ct Miramar, FL | 5.0 | 3.5 | 2607 | $4,500 | $1.73 | 3d | 1 | 1.15mi |
| 16835 SW 49th Ct Miramar, FL | 3.0 | 3.0 | 2391 | $3,850 | $1.61 | 24d | 1 | 1.17mi |
| 4335 SW 174th Ave Miramar, FL | 4.0 | 3.0 | 2704 | $7,500 | $2.77 | 24d | 1 | 1.26mi |
| 4435 SW 174th Ave Miramar, FL | 4.0 | 3.0 | 2704 | $5,500 | $2.03 | 12d | 1 | 1.31mi |
| 5002 SW 155th Ave Unit 5002 Miramar, FL | 4.0 | 2.5 | 2180 | $4,250 | $1.95 | 24d | 1 | 1.31mi |
| 2167 SW 176th Ter Miramar, FL | 5.0 | 4.0 | 3408 | $9,500 | $2.79 | 12d | 1 | 1.38mi |
| 5030 SW 155th Ter Miramar, FL | 4.0 | 2.5 | 2189 | $5,000 | $2.28 | 24d | 1 | 1.40mi |
| 17768 SW 28th St #1 Miramar, FL | 3.0 | 2.5 | 1862 | $3,725 | $2.00 | 24d | 1 | 1.40mi |
| 17394 SW 46th St Miramar, FL | 5.0 | 5.0 | 3633 | $6,500 | $1.79 | 10d | 1 | 1.41mi |
| 17410 SW 46th St Miramar, FL | 5.0 | 4.5 | 3381 | $7,100 | $2.10 | 1d | 1 | 1.42mi |
| 17430 SW 46th St Miramar, FL | 4.0 | 4.0 | 2873 | $5,900 | $2.05 | 2d | 1 | 1.42mi |
| 17374 SW 47th Ct Miramar, FL | 5.0 | 3.0 | 3612 | $6,000 | $1.66 | 16d | 1 | 1.44mi |
| 1012 SW 156th Ave Pembroke Pines, FL | 5.0 | 3.5 | 3363 | $6,500 | $1.93 | 24d | 1 | 1.45mi |
| 17958 SW 36th St Miramar, FL | 4.0 | 2.5 | 3579 | $5,495 | $1.54 | 3d | 1 | 1.48mi |
| 17958 SW 36th St Miramar, FL | 4.0 | 2.5 | 3579 | $5,495 | $1.54 | 4d | 1 | 1.48mi |
| 17376 SW 48th St Miramar, FL | 5.0 | 3.0 | 3486 | $6,500 | $1.86 | 1d | 1 | 1.49mi |
| 18061 SW 33rd St Miramar, FL | 4.0 | 3.0 | 1815 | $5,800 | $3.20 | 7d | 1 | 1.49mi |
Listing history 6 events
-
2026-06-09days on market $5,000 Active 7 DOM
-
2026-06-08days on market $5,000 Active 6 DOM
-
2026-06-07days on market $5,000 Active 5 DOM
-
2026-06-04days on market $5,000 Active 2 DOM
-
2026-06-02remarks 314-char remark
-
2026-06-02$5,000 Active 1 DOM
ⓘ Source: listings_history table (triggers on properties + properties_extension) + one-shot
backfill from property_details.listing_events for pre-trigger history.
Climate risk First Street
- Flood 1/10 Low FEMA zone X (shaded) · 0% chance over 30 yrs
- Wildfire 1/10 Low
- Heat 9/10 Extreme 7 d/yr ≥106°F today · 26 d/yr by 30 yrs out
- Wind 10/10 Extreme 99% chance of damaging wind over 30 yrs
- Air quality 2/10 Low 1 unhealthy d/yr today · 2 by 30 yrs out
Nearby sold comps map
Loading sold comps map…
Walkable amenities ~0.75 mi
Loading nearby amenities…
Taxation est. · year 1
- Rental income
- $57,525
- − Mortgage interest
- −$280
- − Property taxes
- −$75
- − Insurance
- −$25
- − Repairs & maintenance
- −$4,602
- − Management
- −$4,602
- − Depreciation
- −$145
- Taxable income
- $47,796
- Est. tax owed @ 24.0%
- −$11,471
- After-tax cash flow
- $33,559/yr
For passive investors: Depreciation is non-cash, so a rental often shows a tax loss while cash-flowing — sheltering income. Rental losses are passive: they offset passive income freely, and up to $25,000/yr can offset ordinary (W-2) income if you actively participate and your MAGI is under $100k (phasing out to $0 by $150k); unused losses carry forward. On sale, claimed depreciation is recaptured at up to 25%, and gains may owe capital-gains tax (a 1031 exchange can defer both). Figures are a year-1 estimate at your 24.0% rate — not tax advice; consult a CPA.
Schools (NCES district)
- District
- Broward
- NCES district ID
- 1200180
- Math proficiency
- 42% ▼ -18.00%
- Reading proficiency
- 53% ▼ -5.00%
- Median HH income
- $52,139
- Composite
- 40.88/100
- National rank
- #3621
- State rank
- #46 of 73 in FL
Livability — Miramar
- Score
- 80/100
- State rank
- #111
- US rank
- #1721
Category grades
Schools grade is shown separately in the Schools card above.
Census & demographics
- Census place
- Miramar, FL
- County
- Broward County · 1,963,430 people
- City population
- 214,427
- Metro
- Miami-Fort Lauderdale-Pompano Beach, FL
- Population (ZIP)
- 65,116
- Household income
- $76,561
- Rent vs Own
- Severe rent burden
- 1728.0
Population outlook (Broward County) Hauer SSP2
- Today (2025)
- 2,207,033 people
- By 2030
- 2,360,704 · +7.0%
- By 2040
- 2,661,208 · +20.6%
- By 2050
- 2,946,698 · +33.5%
- By 2075
- 3,602,273 · +63.2%
- By 2100
- 3,970,984 · +79.9%
Race, ethnicity, and origin ACS 2023
- Neighborhood character
- Diverse neighborhood (Simpson 0.65)
- Race & ethnicity
- Hispanic / Latino 52% Two or more races 23% Black 22% White 16% Asian 6%
- Hispanic origin (detail)
- Puerto Rican 6% Cuban 19% Dominican 3%
- Common ancestry
- Hispanic 6% Romanian 1% Scotch-Irish 1%
- Foreign-born
- 47% · Canada, Jamaica, Vietnam
- Languages at home
- 40% English-only · Spanish 47% French/Haitian/Cajun 5% Other Indo-European 2%
Political lean MEDSL · Broward
- 2024 margin
- D (+17.0) · D 58.0% · R 41.0%
- 2008→2024 swing
- -17.8pp toward R · 2008: 34.7pp · 2024: 17.0pp
- All cycles
- 2024: D+17.0 2020: D+29.8 2016: D+35.0 2012: D+34.9 2008: D+34.7
Not yet ingested
- Civics
- —
Market trends
- HPI YoY
- ▼ -2.01%
- Current HPI
- 359.5973
- Rent YoY
- ▼ -0.20%
- Metro
- Miami-Fort Lauderdale-Pompano Beach, FL
- State GDP YoY
- ▲ 3.28%
- F500 in state
- 36
Industry mix (Fortune 500 HQ in FL)
| Industry | F500 HQs | Revenue |
|---|---|---|
| Industrial Technology | 2 | $29B |
|
||
| Insurance | 2 | $17B |
|
||
| Retail | 1 | $60B |
|
||
| Technology Distribution | 1 | $58B |
|
||
| Homebuilding | 1 | $35B |
|
||
| Technology Manufacturing | 1 | $35B |
|
||
Price history
-99.9% since first listed21 events — show timeline
- 2026-06-02 Listed $5,000 NFMLS
- 2023-05-10 Sold (Public Records) $750,000 Public Records
- 2023-05-10 Sold (MLS) $750,000 MARMLS
- 2023-03-30 Contingent — MARMLS
- 2023-03-16 Price Changed $750,000 MARMLS
- 2023-03-07 Price Changed $780,000 MARMLS
- 2023-02-26 Listed $800,000 MARMLS
- 2020-11-23 Sold (Public Records) $510,000 Public Records
- 2020-11-23 Sold (MLS) $510,000 MARMLS
- 2020-10-27 Pending — MARMLS
- 2020-10-26 Contingent — MARMLS
- 2020-10-09 Price Changed $515,000 MARMLS
- 2020-09-26 Relisted — MARMLS
- 2020-09-26 Contingent — MARMLS
- 2020-09-16 Listed $530,000 MARMLS
- 2015-10-02 Sold (Public Records) $419,000 Public Records
- 2015-09-28 Sold (MLS) $419,000 MARMLS
- 2015-08-13 Pending — MARMLS
- 2015-07-10 Listed $419,000 MARMLS
- 2003-03-04 Sold (Public Records) $310,000 Public Records
- 1996-12-31 Sold (Public Records) $5,100,000 Public Records
Property tax history
+8.1%/yrLatest (2025): $13,015 · +3.0% YoY. Source: county tax records.
Cash-flow waterfall
monthlySold comps — $/sqft
last 12 mo · ≤1 miLoading sold comps…