14509 Bonellis Pass · Elgin, TX
Flood risk No data
- FEMA flood zone
- —
- Chance of flooding over 30 yrs
- —
- Est. flood insurance / yr
- —
Fire risk No data
- Est. fire insurance / yr
- —
Heat risk No data
- Hot days now (above threshold)
- —
- Hot days in 30 yrs
- —
Wind risk No data
- Chance of severe wind over 30 yrs
- —
Air-quality risk No data
- Unhealthy air days now
- —
- Unhealthy air days in 30 yrs
- —
Risk factors via First Street. Map © Google.
Why this score? — see what drove the D+ grade
The composite is a weighted blend of 9 inputs, each scored 0–100. Each bar is that input's sub-score; the figure is the points it added to the 100-point composite (weight × sub-score).
- Cash flow +11.1/30.0
- Appreciation +10.0/10.0
- ARV discount +7.5/15.0
- Livability +3.7/5.0
- Rent growth +3.3/5.0
- DSCR +3.2/10.0
- Condition / age +2.5/5.0
- 1% rule +2.2/10.0
- Schools +2.0/10.0
$275,490
🖨 Deal sheet (PDF) 📄 Offer letter ✓ Due diligence
Listing remarks
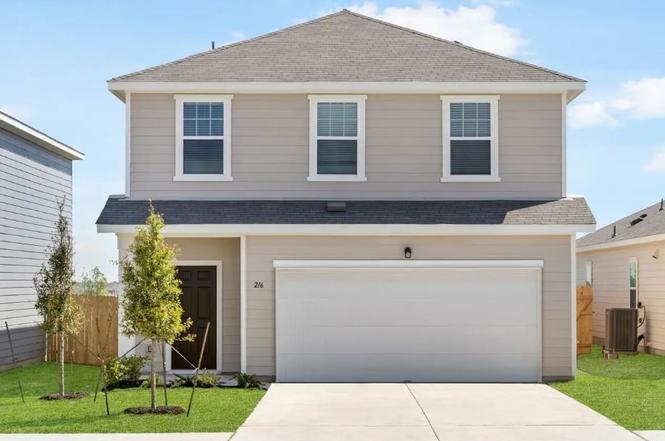
You enter through the covered porch into the foyer and travel down the hall, where a powder bath is conveniently located. As you step into the family room, the stairs leading to the second floor come into view. The open layout flows into the kitchen, which features a pantry, additional storage space, and access to the two-car garage. Upstairs, the primary bedroom includes a walk-in closet and a spacious primary bath. The laundry room is located right at the top of the stairs for easy access. Two additional bedrooms, each with its own walk-in closet, share a full bath.
Key facts
- 4,599 sq ft lot
- 2 garage spots
- Built 2025
Neighborhood map
What this means for you Summary
Snapshot
- This is a 3-bed/2.5-bath land listed at $275k.
Deal economics
- At list price, monthly cash flow is $-112 ($-1k/yr) — negative.
- To cash-flow at today's rent, offer at most $256k (7.2% below list).
- To meet the 1% rule (rent ≥ 1% of price), the offer needs to be $198k (28.3% below list).
- Recommended offer: $198k (28.3% below list) — sets the bar for 1% rule.
- Cap rate 5.8% vs local median 4.4% in Elgin — top-decile yield for the area; either an underpriced asset or a hidden risk that comps aren't pricing in. Stress-test before assuming the spread holds.
Location & tenants
- Location reads 74/100 on livability (#167 in TX, #4,404 nationally) — a middle-class / working-renter tenant base. Strengths: cost of living A+, housing A+, health & safety A+; Watch: schools F, amenities F, commute F.
- Elgin ISD (rural): math 17% / reading 26% proficiency, ranked #741 of 826 in TX (top 90%) — low school quality limits family demand, transient renter base, plan for 1-2y turnover; 67% free/reduced lunch — lower-income household profile, screen leases tightly.
- Market conditions: Rents rising (+3.1%/yr); 813 active listings in the ZIP; 23 comparable units currently listed for rent nearby; rentals leasing fast (median 14d on market — plan ~1-2 weeks tenant-placement turnaround); solid renter incomes; 17,121 units permitted in Travis County in 2024 (11,963 in 5+ unit buildings).
Forward outlook
- In year one you build about $29k of equity ($2k loan paydown + $28k appreciation (10.0% local appreciation)).
- Travis County population projected at +60% by 2050 — long-run rental-demand tailwind backs the buy-and-hold thesis.
- By year 2, paydown + projected appreciation supports a ~$47k cash-out refi (75% LTV) — recoverable capital for the next deal without selling this one.
Negotiation context
- It's been on market 82 days — a 6% lower offer ($259k) is reasonable based on typical stale-listing flexibility.
- 2 sale attempts with the ask held roughly flat each time — persistent listings suggest the price (not the market) is what's stuck; bring a comps-based counter.
Questions for the listing agent
- What do current leases actually rent for vs. the listed asking? Can we see a recent rent roll and the last 12 months of T-12 income?
- It's been on market 82 days. Have you received any prior offers? Is the seller open to a 28% concession, seller financing, or rate buy-down credit?
- What does the HOA fee cover, when was the last increase, and are there any pending special assessments or reserve-fund shortfalls?
- Why hasn't it sold? Are there any deal-killer items the seller is aware of (foundation, flood, title, zoning, code violations)?
- Is there a deadline driving the sale (1031 exchange, divorce, estate, relocation)? That informs how much negotiation room exists.
- Schools are F-rated, which usually means shorter tenancies and higher turnover. Who's the typical renter profile here, and what's been the actual vacancy rate?
- The area grade is low — what's the realistic commute time and amenity access for the typical tenant pool here? Any planned neighborhood developments (good or bad) we should know about?
- What's the average days-on-market for RENTAL listings here right now (not sales)? A rising rental-DOM trend means longer vacancies and softer asking-rent achievability than the comps imply.
- What's the recent tenant-quality profile in this submarket — average credit score on applications, eviction rate, late-payment / NSF rate, and stable-employment percentage? A property-management company in the area should have these aggregated.
- How much new for-sale + rental construction is in the pipeline within 1–3 miles? Heavy new supply typically softens prices + rents 12–24 months out; constrained supply supports both.
Investment metrics
- 1% rule
- 0.72% ✗
- Cap rate
- 5.80%
- Cash-on-cash
- -1.75%
- DSCR
- 0.92
- GRM
- 11.6
CMA / ARV
No comps found within radius.
Projected returns pro-forma
10.0% appreciation · 3.12% rent growth · sell at horizon
- IRR
- 23.0%
- Equity multiple
- 2.85×
- Total profit
- $143,003
- Equity at exit
- $248,183
- IRR
- 20.6%
- Equity multiple
- 6.54×
- Total profit
- $427,019
- Equity at exit
- $535,216
Cash invested: $77,137 (down + closing). Projections, not guarantees.
Landlord ↔ Tenant lean methodology
- Overall (STATE)
- 87 Strongly Landlord-Friendly
- State Texas
- 87 Strongly Landlord-Friendly · R+5
- County
- — inherits STATE
- City
- — inherits STATE
ZIP-level market 78621
- Home prices YoY
- 7.6%
- Rents YoY
- 3.1%
- Active inventory
- 813
- Price-to-rent
- 11.6×
Monthly cashflow live
- Estimated rent
- $1,976 high interval (Pro) →
- Mortgage (P&I)
- −$1,445
- Tax from tax record
- −$79 /mo · $952/yr
- Insurance
- −$115
- HOA
- −$35
- Vacancy / Maint / Mgmt
- −$415
- Net cashflow
- $-112
Break-even live
Sensitivity live
| Price | -10% $43 | -5% $-34 | +0% $-112 | +5% $-190 | +10% $-268 |
|---|---|---|---|---|---|
| Rent | -10% $-269 | -5% $-191 | +0% $-112 | +5% $-34 | +10% $44 |
| Rate | -1.0pp $26 | -0.5pp $-42 | base $-112 | +0.5pp $-184 | +1.0pp $-256 |
UW: 25.0% down · 7.5% · 30yr · 1.5% tax · 5.0% vac · 8.0% maint · 8.0% mgmt
Financing live
Cash to close
- Down payment
- $68,872
- Closing costs
- $8,265
- Reserves months
- —
- Total cash needed
- —
Loan-product check · same deal, 3 products live
Conventional
25% down · 7.5% · 30yr
- Down + closing
- —
- Monthly P&I
- —
- Monthly cashflow
- —
- DSCR
- —
- Eligible?
- —
Personal DTI + credit; lowest rate.
DSCR
20% down · 8.5% · 30yr
- Down + closing
- —
- Monthly P&I
- —
- Monthly cashflow
- —
- DSCR
- —
- Eligible?
- —
No personal income docs; deal must DSCR.
Hard money
10% down · 12.0% · 12mo
- Down + closing
- —
- Monthly P&I
- —
- Monthly cashflow
- —
- DSCR
- —
- Eligible?
- —
Short-term bridge; refi at stabilization.
Rent comps 23 comps
| Address | Beds | Baths | Sqft | Rent | $/sqft | DOM | Units | Dist |
|---|---|---|---|---|---|---|---|---|
| 14508 Wahlbergs Way Elgin, TX | 3.0 | 2.0 | 1076 | $2,045 | $1.90 | 12d | 1 | 0.03mi |
| 18300 Speculator Ln Elgin, TX | 4.0 | 2.0 | 1794 | $1,995 | $1.11 | 25d | 1 | 0.07mi |
| 18224 Speculator Ln Elgin, TX | 3.0 | 2.5 | 1599 | $1,700 | $1.06 | 44d | 1 | 0.07mi |
| 18200 Papuan Cv Elgin, TX | 3.0 | 2.0 | 1402 | $1,900 | $1.36 | 4d | 1 | 0.08mi |
| 14141 Prospector Way Elgin, TX | 3.0 | 2.0 | 1520 | $1,650 | $1.09 | 44d | 1 | 0.14mi |
| 18316 Stellers Sea St Elgin, TX | 3.0 | 2.0 | 1076 | $2,045 | $1.90 | 20d | 1 | 0.17mi |
| 14300 Boomtown Way Elgin, TX | 4.0 | 2.0 | 1794 | $2,050 | $1.14 | 25d | 1 | 0.25mi |
| 18500 Allen Welch Dr Elgin, TX | 3.0 | 2.0 | 1525 | $1,825 | $1.20 | 5d | 1 | 0.27mi |
| 18505 Quiet Range Dr Unit 18505 Elgin, TX | 4.0 | 2.0 | 1794 | $1,785 | $0.99 | 5d | 1 | 0.32mi |
| 18505 Quiet Range Dr Elgin, TX | 4.0 | 2.0 | 1794 | $1,950 | $1.09 | 25d | 1 | 0.32mi |
| 18525 Quiet Range Dr Elgin, TX | 4.0 | 2.0 | 1794 | $1,725 | $0.96 | 18d | 1 | 0.33mi |
| 18612 Allen Welch Dr Elgin, TX | 4.0 | 2.0 | 1794 | $1,885 | $1.05 | 5d | 1 | 0.35mi |
| 14421 Prairie Sod Ln Elgin, TX | 3.0 | 2.0 | 1525 | $1,650 | $1.08 | 3d | 1 | 0.40mi |
| 18721 Quiet Range Dr Elgin, TX | 3.0–5.0 | 2.0–3.5 | 1773 | $2,085 | $1.18 | 2d | 1 | 0.48mi |
| 234 Heritage Mill Trl Elgin, TX | 3.0 | 2.0 | 1530 | $1,850 | $1.21 | 3d | 1 | 0.55mi |
| 107 Tillage Rd Elgin, TX | 3.0 | 2.0 | 1548 | $1,775 | $1.15 | 20d | 1 | 0.56mi |
| 116 Honeybee Ln Elgin, TX | 3.0 | 2.5 | 1782 | $2,000 | $1.12 | 5d | 1 | 0.69mi |
| 242 Barley Ln Elgin, TX | 3.0 | 2.5 | 1782 | $2,150 | $1.21 | 2d | 1 | 0.73mi |
| 19405 Bear Grass Dr Elgin, TX | 3.0 | 2.0 | 1495 | $1,760 | $1.18 | 44d | 1 | 0.83mi |
| 13817 County Line Rd Elgin, TX | 1.0–3.0 | 1.0–2.0 | 937 | $1,890 | $2.02 | 2d | 6 | 0.95mi |
| 101 Bandara Woods Blvd Elgin, TX | 3.0 | 2.0 | 1499 | $1,769 | $1.18 | 15d | 1 | 0.99mi |
| 401 Bandara Woods Blvd Elgin, TX | 3.0 | 2.0 | 1665 | $1,875 | $1.13 | 44d | 1 | 1.12mi |
| 419 Gettysburg Loop Elgin, TX | 3.0 | 2.0 | 1565 | $1,850 | $1.18 | 13d | 1 | 1.42mi |
HOA detail
- Monthly dues
- $35 · $420/yr
Listing history 5 events
-
2026-04-20status Pending
-
2026-01-28status Active
-
2026-01-28price $275,490
-
2025-12-01$268,265
-
2025-12-01historical
ⓘ Source: listings_history table (triggers on properties + properties_extension) + one-shot
backfill from property_details.listing_events for pre-trigger history.
Tax reassessment forecast TX · Resets to sale price
- Current annual tax
- $952 · $79/mo
- Projected year-2 tax
- $5,041 · $420/mo
- Expected delta
- +$4,089/yr (+$341/mo · 429.3%)
ⓘ Screening estimate from a state-policy table — verify with the county assessor before closing.
Nearby sold comps map
Loading sold comps map…
Walkable amenities ~0.75 mi
Loading nearby amenities…
Taxation est. · year 1
- Rental income
- $23,717
- − Mortgage interest
- −$15,432
- − Property taxes
- −$952
- − Insurance
- −$1,377
- − Repairs & maintenance
- −$1,897
- − Management
- −$1,897
- − HOA
- −$420
- − Depreciation
- −$8,014
- Taxable loss
- −$6,273
- Est. tax savings @ 24.0%
- +$1,506
- After-tax cash flow
- $156/yr
For passive investors: Depreciation is non-cash, so a rental often shows a tax loss while cash-flowing — sheltering income. Rental losses are passive: they offset passive income freely, and up to $25,000/yr can offset ordinary (W-2) income if you actively participate and your MAGI is under $100k (phasing out to $0 by $150k); unused losses carry forward. On sale, claimed depreciation is recaptured at up to 25%, and gains may owe capital-gains tax (a 1031 exchange can defer both). Figures are a year-1 estimate at your 24.0% rate — not tax advice; consult a CPA.
Schools (NCES district)
- District
- Elgin ISD
- NCES district ID
- 4818360
- Math proficiency
- 17% ▼ -9.00%
- Reading proficiency
- 26% ▼ -5.00%
- Median HH income
- $55,176
- Composite
- 19.62/100
- National rank
- #8749
- State rank
- #741 of 826 in TX
Livability — Elgin
- Score
- 74/100
- State rank
- #167
- US rank
- #4404
Category grades
Schools grade is shown separately in the Schools card above.
Census & demographics
- Census place
- Elgin, TX
- County
- Bastrop County · 68,601 people
- City population
- 27,860
- Metro
- Austin-Round Rock-Georgetown, TX
- Population (ZIP)
- 30,411
- Household income
- $98,534
- Rent vs Own
- Severe rent burden
- 235.0
Population outlook (Travis County) Hauer SSP2
- Today (2025)
- 1,545,133 people
- By 2030
- 1,729,269 · +11.9%
- By 2040
- 2,097,596 · +35.8%
- By 2050
- 2,463,890 · +59.5%
- By 2075
- 3,249,374 · +110.3%
- By 2100
- 3,801,868 · +146.1%
Race, ethnicity, and origin ACS 2023
- Neighborhood character
- Diverse neighborhood (Simpson 0.64)
- Race & ethnicity
- Hispanic / Latino 46% White 38% Two or more races 19% Black 11% Native American 1%
- Hispanic origin (detail)
- Mexican 38%
- Common ancestry
- Slovak 2% Italian 2% Romanian 1%
- Foreign-born
- 17% · Canada, Vietnam
- Languages at home
- 63% English-only · Spanish 36%
Political lean MEDSL · Travis
- 2024 margin
- Solid D (+39.3) · D 68.8% · R 29.4% · Other 1.8%
- 2008→2024 swing
- +9.9pp toward D · 2008: 29.4pp · 2024: 39.3pp
- All cycles
- 2024: D+39.3 2020: D+45.0 2016: D+38.9 2012: D+23.9 2008: D+29.4
Not yet ingested
- Civics
- —
Market trends
- HPI YoY
- ▲ 29.47%
- Current HPI
- 416.87
- Rent YoY
- ▲ 3.12%
- Metro
- Austin-Round Rock-Georgetown, TX
- State GDP YoY
- ▲ 3.95%
- F500 in state
- 110
Industry mix (Fortune 500 HQ in TX)
| Industry | F500 HQs | Revenue |
|---|---|---|
| Energy | 16 | $1,198B |
|
||
| Technology | 5 | $198B |
|
||
| Engineering / Construction | 4 | $72B |
|
||
| Energy Services | 3 | $60B |
|
||
| Utilities | 3 | $41B |
|
||
| Healthcare | 2 | $330B |
|
||
Price history
+2.7% since first listed5 events — show timeline
- 2026-04-20 Pending — Unlock MLS
- 2026-01-28 Relisted — Unlock MLS
- 2026-01-28 Price Changed $275,490 Unlock MLS
- 2025-12-01 Delisted — Unlock MLS
- 2025-12-01 Listed $268,265 Unlock MLS
Cash-flow waterfall
monthlySold comps — $/sqft
last 12 mo · ≤1 miLoading sold comps…