2318 E 8th St · Muncie, IN
Flood risk 1/10 · Minimal
- FEMA flood zone
- X (unshaded)
- Chance of flooding over 30 yrs
- 0.0%
- Est. flood insurance / yr
- $507 – $1,088
Fire risk 1/10 · Minimal
- Est. fire insurance / yr
- $717 – $1,331
Heat risk 3/10 · Minor
- Hot days now (above 101°F)
- 7 days/yr
- Hot days in 30 yrs
- 18 days/yr
Wind risk 2/10 · Minimal
- Chance of severe wind over 30 yrs
- 1.0%
Air-quality risk 3/10 · Minor
- Unhealthy air days now
- 2 days/yr
- Unhealthy air days in 30 yrs
- 3 days/yr
Risk factors via First Street. Map © Google.
Why this score? — see what drove the C+ grade
The composite is a weighted blend of 9 inputs, each scored 0–100. Each bar is that input's sub-score; the figure is the points it added to the 100-point composite (weight × sub-score).
- Cash flow +25.0/30.0
- ARV discount +8.4/15.0
- DSCR +8.1/10.0
- 1% rule +6.4/10.0
- Rent growth +4.5/5.0
- Livability +4.0/5.0
- Condition / age +2.5/5.0
- Schools +1.7/10.0
- Appreciation +0.0/10.0
$89,900
🖨 Deal sheet (PDF) 📄 Offer letter ✓ Due diligence
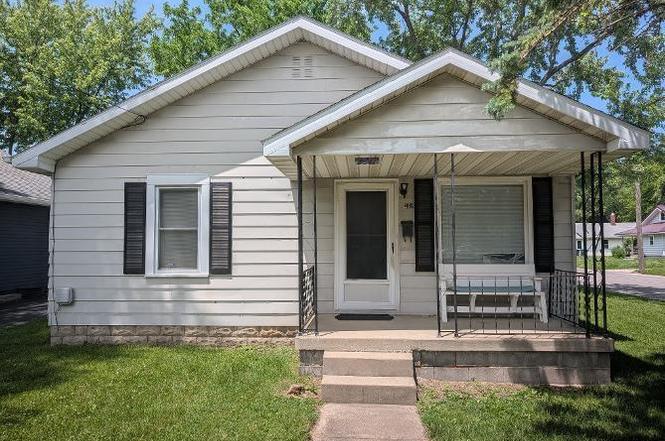
Listing remarks
Cozy Home sitting on a corner lot with a large fenced in yard and large 2 car garage. The interior offers a big living room with a large front window, a roomy kitchen with lots of cabinets, 2 bedrooms, laundry room, and full bathroom.
Key facts
- Lots of cabinets
- Laundry room
- Roomy kitchen
Tags
Property features AI
Finance
- HOA & community: Sidewalks in the community
Exterior
- Parking: Detached garage with garage door opener (2 car); Asphalt parking
- Security: Smoke detector(s)
- Utilities: Public water; Public sewer; Cable connected
- Home design: Single-family residence, site-built; One-story
- Construction: Metal siding
- Exterior features: Covered porch; Corner lot, level and landscaped; Chain link fencing; Shingle roof
Interior
- Kitchen: Refrigerator; Electric range
- Bedrooms: Total rooms: 5 (includes bedrooms and living spaces)
- Flooring: Carpet; Vinyl
- Bathrooms: One full bathroom (main level)
- Heating & cooling: Central air; Ceiling fan(s); Natural gas forced air heating
- Interior features: Ceiling fans; Eat-in kitchen; Laminate countertops; One fireplace
- Laundry & utility: Washer hookup (main level); Electric dryer hookup; Electric water heater
Neighborhood map
What this means for you Summary
Snapshot
- This is a 2-bed/1.0-bath single-family listed at $90k.
Deal economics
- At list price, monthly cash flow is $195 ($2k/yr) — positive.
- The deal already cash-flows at list — no discount required.
- Meets the 1% rule at list price ($1k rent vs $90k).
- Cap rate 8.9% vs local median 6.0% in Muncie — top-decile yield for the area; either an underpriced asset or a hidden risk that comps aren't pricing in. Stress-test before assuming the spread holds.
Location & tenants
- Location reads 80/100 on livability (#18 in IN, #1,654 nationally) — a professional / high-income tenant draw. Strengths: amenities A+, commute A+, cost of living A+; Watch: crime F, employment F.
- Muncie Community Schools (urban): math 18% / reading 25% proficiency, ranked #275 of 301 in IN (top 91%) — low school quality limits family demand, transient renter base, plan for 1-2y turnover; 68% free/reduced lunch — lower-income household profile, screen leases tightly.
- Zoned schools: Grissom Elementary School (math 8% / reading 8%, grade F, #949 of 994 statewide, top 97%, 450 students, 85% FRL); Southside Middle School (math 7% / reading 15%, grade F, #312 of 330 statewide, top 95%, 443 students, 85% FRL) — zoned schools average 85% FRL vs 68% district-wide (17 pts higher); higher-poverty schools than district average — tighter screening recommended.
- Zoned-school proficiency averages 9% at this address vs 22% district-wide (-12 pts) — the specific schools serving this property underperform the Muncie Community Schools average; the district grade overstates school quality for this exact location.
- Market conditions: Rents rising fast (+8.1%/yr); 202 active listings in the ZIP; 21 comparable units currently listed for rent nearby; rentals lingering (median 45d on market — plan ~5-8 weeks vacancy on turnover, expect pricing pressure); 100% of comp listings sitting > 30 days — soft ceiling on asking rent; 171 units permitted in Delaware County in 2024 (57 in 5+ unit buildings).
Forward outlook
- Local home prices are declining (-3.0%/yr); year-one equity from $622 of loan paydown is wiped out by about $3k of value loss. Plan a longer hold.
- Delaware County population projected at -11% by 2050 — secular population decline; favor cash flow + early exit over multi-decade hold.
- At projected returns (-3.0% appreciation + 8.0% rent growth), your $25k cash investment doubles in ~8 years — after that, you're playing with house money.
Negotiation context
- Only 4 days on market — expect competitive offers; lowballing is unlikely to land.
- 3 sale attempts since 8y ago with the ask held roughly flat each time — persistent listings suggest the price (not the market) is what's stuck; bring a comps-based counter.
Risks & watch-outs
- Watch-outs: built in 1928 — expect roof / HVAC / electrical / plumbing capex.
Questions for the listing agent
- Built in 1928 — when were the roof, HVAC, electrical panel, plumbing, and water heater last replaced?
- Is there a deadline driving the sale (1031 exchange, divorce, estate, relocation)? That informs how much negotiation room exists.
- Schools are D-rated, which usually means shorter tenancies and higher turnover. Who's the typical renter profile here, and what's been the actual vacancy rate?
- Crime grade is F in this area — have there been break-ins, vandalism, or insurance claims at this property in the last 3 years? What carrier currently insures it and at what premium?
- What's the average days-on-market for RENTAL listings here right now (not sales)? A rising rental-DOM trend means longer vacancies and softer asking-rent achievability than the comps imply.
- What's the recent tenant-quality profile in this submarket — average credit score on applications, eviction rate, late-payment / NSF rate, and stable-employment percentage? A property-management company in the area should have these aggregated.
- How much new for-sale + rental construction is in the pipeline within 1–3 miles? Heavy new supply typically softens prices + rents 12–24 months out; constrained supply supports both.
Investment metrics
- 1% rule
- 1.14% ✓
- Cap rate
- 8.89%
- Cash-on-cash
- 9.27%
- DSCR
- 1.41
- GRM
- 7.3
CMA / ARV
- ARV (on-the-fly)
- $91,744
- Comps found
- 12
Show comp detail 12 sales within ~0.75 mi
| Address | Dist | Beds/Ba | Sqft | Sold | Price | $/sf | Match |
|---|---|---|---|---|---|---|---|
| 1407 S Meeker Ave | 0.06mi | 2/1.0 | 980 (+0%) | 5mo | $110,000 | $112 | 92 |
| 1512 S Wall Ave | 0.16mi | 2/1.0 | 912 (-7%) | 4mo | $62,500 | $69 | 78 |
| 1103 S Jersey Ave | 0.30mi | 2/1.0 | 952 (-2%) | 10mo | $69,900 | $73 | 74 |
| 1501 S Biltmore Ave | 0.45mi | 2/1.0 | 980 (+0%) | 8mo | $89,900 | $92 | 72 |
| 2624 E Memorial Dr | 0.33mi | 2/1.0 | 940 (-4%) | 12mo | $23,000 | $24 | 69 |
| 2014 E 13th St | 0.36mi | 3/1.0 (+1) | 958 (-2%) | 10mo | $63,000 | $66 | 67 |
| 1603 S Ribble Ave | 0.13mi | 2/1.0 | 1,092 (+12%) | 13mo | $119,500 | $109 | 63 |
| 1301 S Meeker Ave | 0.12mi | 2/1.0 | 848 (-13%) | 13mo | $79,900 | $94 | 62 |
| 2612 E Memorial Dr | 0.30mi | 2/1.0 | 852 (-13%) | 6mo | $89,000 | $104 | 60 |
| 907 S Tennessee Ave | 0.41mi | 3/1.0 (+1) | 1,053 (+8%) | 9mo | $106,000 | $101 | 55 |
| 2511 E 13th St | 0.40mi | 3/1.0 (+1) | 864 (-12%) | 7mo | $70,000 | $81 | 51 |
| 1806 E 18th St | 0.71mi | 3/1.0 (+1) | 865 (-11%) | 7mo | $92,500 | $107 | 38 |
Match score weights: distance 35% · size 25% · config 20% · recency 20%. Top-matched comps best support the ARV.
Projected returns pro-forma
-3.0% appreciation · 8.0% rent growth · sell at horizon
- IRR
- 3.2%
- Equity multiple
- 1.13×
- Total profit
- $3,257
- Equity at exit
- $13,404
- IRR
- 17.0%
- Equity multiple
- 2.73×
- Total profit
- $43,517
- Equity at exit
- $7,773
Cash invested: $25,172 (down + closing). Projections, not guarantees.
Landlord ↔ Tenant lean methodology
- Overall (STATE)
- 90 Strongly Landlord-Friendly
- State Indiana
- 90 Strongly Landlord-Friendly · R+11
- County
- — inherits STATE
- City
- — inherits STATE
ZIP-level market 47304
- Home prices YoY
- -28.4%
- Rents YoY
- 8.1%
- Active inventory
- 202
- Price-to-rent
- 7.3×
Monthly cashflow live
- Estimated rent
- $1,026 high interval (Pro) →
- Mortgage (P&I)
- −$471
- Tax from tax record
- −$107 /mo · $1,284/yr
- Insurance
- −$37
- HOA
- −$0
- Vacancy / Maint / Mgmt
- −$215
- Net cashflow
- $195
Break-even live
Sensitivity live
| Price | -10% $245 | -5% $220 | +0% $195 | +5% $169 | +10% $144 |
|---|---|---|---|---|---|
| Rent | -10% $114 | -5% $154 | +0% $195 | +5% $235 | +10% $276 |
| Rate | -1.0pp $240 | -0.5pp $217 | base $195 | +0.5pp $171 | +1.0pp $148 |
UW: 25.0% down · 7.5% · 30yr · 1.5% tax · 5.0% vac · 8.0% maint · 8.0% mgmt
Financing live
Cash to close
- Down payment
- $22,475
- Closing costs
- $2,697
- Reserves months
- —
- Total cash needed
- —
Loan-product check · same deal, 3 products live
Conventional
25% down · 7.5% · 30yr
- Down + closing
- —
- Monthly P&I
- —
- Monthly cashflow
- —
- DSCR
- —
- Eligible?
- —
Personal DTI + credit; lowest rate.
DSCR
20% down · 8.5% · 30yr
- Down + closing
- —
- Monthly P&I
- —
- Monthly cashflow
- —
- DSCR
- —
- Eligible?
- —
No personal income docs; deal must DSCR.
Hard money
10% down · 12.0% · 12mo
- Down + closing
- —
- Monthly P&I
- —
- Monthly cashflow
- —
- DSCR
- —
- Eligible?
- —
Short-term bridge; refi at stabilization.
Rent comps 21 comps
| Address | Beds | Baths | Sqft | Rent | $/sqft | DOM | Units | Dist |
|---|---|---|---|---|---|---|---|---|
| 1804 S Wall Ave Muncie, IN | 2.0 | 1.0 | 900 | $899 | $1.00 | 44d | 1 | 0.25mi |
| 2213 E Memorial Dr Muncie, IN | 2.0 | 1.0–2.0 | 997 | $1,078 | $1.08 | 44d | 1 | 0.31mi |
| 1703 E 14th St Apt 15 Muncie, IN | 2.0 | 1.0 | 756 | $777 | $1.03 | 44d | 1 | 0.55mi |
| 1310 E 5th St Muncie, IN | 3.0 | 1.0 | 864 | $1,300 | $1.50 | 44d | 1 | 0.66mi |
| 1311 E 11th St Unit 2 Muncie, IN | 1.0 | 1.0 | 672 | $715 | $1.06 | 44d | 1 | 0.67mi |
| 1521 E Kirby Ave Muncie, IN | 2.0–4.0 | 1.0–2.0 | 972 | $800 | $0.82 | 44d | 2 | 0.68mi |
| 1806 E 18th St Muncie, IN | 3.0 | 1.0 | 865 | $1,100 | $1.27 | 44d | 1 | 0.71mi |
| 3508 E Memorial Dr Muncie, IN | 2.0–3.0 | 1.0–2.0 | 1029 | $429 | $0.42 | 44d | 7 | 0.79mi |
| 1307 S Ebright St Unit 2 Muncie, IN | 1.0 | 1.0 | 630 | $695 | $1.10 | 44d | 1 | 0.87mi |
| 1109 E Kirby Ave Muncie, IN | 2.0–3.0 | 1.0 | 971 | $835 | $0.86 | 44d | 2 | 0.88mi |
| 2808 S Brotherton St Muncie, IN | 2.0 | 1.0 | 966 | $825 | $0.85 | 44d | 1 | 0.95mi |
| 305 N Biltmore Ave Muncie, IN | 2.0 | 1.0 | 912 | $1,186 | $1.30 | 44d | 1 | 1.02mi |
| 2302 S Hackley St Muncie, IN | 2.0 | 1.0 | 870 | $1,199 | $1.38 | 44d | 1 | 1.05mi |
| 2105 S Vine St Muncie, IN | 3.0 | 1.0 | 960 | $1,365 | $1.42 | 44d | 1 | 1.12mi |
| 1721 S Elm St Muncie, IN | 2.0 | 1.0 | 940 | $925 | $0.98 | 44d | 1 | 1.24mi |
| 1901 E 26th St Unit 5 Muncie, IN | 2.0 | 1.0 | 600 | $865 | $1.44 | 44d | 1 | 1.30mi |
| 305 N Pershing Dr Muncie, IN | 3.0 | 1.0 | 1062 | $1,100 | $1.04 | 44d | 1 | 1.37mi |
| 1525 S Walnut St Unit 11 Muncie, IN | 2.0 | 1.0 | 800 | $775 | $0.97 | 44d | 1 | 1.41mi |
| 3013 S Pershing Dr Muncie, IN | 3.0 | 1.0 | 814 | $850 | $1.04 | 44d | 1 | 1.45mi |
| 9901 N State St Muncie, IN | 3.0 | 2.0 | 1136 | $1,110 | $0.98 | 44d | 5 | 1.48mi |
| 2316 S Walnut St Muncie, IN | 3.0 | 1.0 | 956 | $1,100 | $1.15 | 44d | 1 | 1.49mi |
Listing history 5 events
-
2026-06-19days on market $89,900 Active 4 DOM
-
2026-06-18days on market $89,900 Active 3 DOM
-
2026-06-17days on market $89,900 Active 2 DOM
-
2026-06-16remarks 234-char remark
-
2026-06-16$89,900 Active 1 DOM
ⓘ Source: listings_history table (triggers on properties + properties_extension) + one-shot
backfill from property_details.listing_events for pre-trigger history.
Tax reassessment forecast IN · Partial reset (capped growth)
- Current annual tax
- $1,284 · $107/mo
- Projected year-2 tax
- $1,284 · $107/mo
- Expected delta
- $0/yr ($0/mo · 0.0%)
ⓘ Screening estimate from a state-policy table — verify with the county assessor before closing.
Climate risk First Street
- Flood 1/10 Low FEMA zone X (unshaded) · 0% chance over 30 yrs
- Wildfire 1/10 Low
- Heat 3/10 Moderate 7 d/yr ≥101°F today · 18 d/yr by 30 yrs out
- Wind 2/10 Low 100% chance of damaging wind over 30 yrs
- Air quality 3/10 Moderate 2 unhealthy d/yr today · 3 by 30 yrs out
Nearby sold comps map
Loading sold comps map…
Walkable amenities ~0.75 mi
Loading nearby amenities…
Taxation est. · year 1
- Rental income
- $12,311
- − Mortgage interest
- −$5,036
- − Property taxes
- −$1,284
- − Insurance
- −$450
- − Repairs & maintenance
- −$985
- − Management
- −$985
- − Depreciation
- −$2,615
- Taxable income
- $956
- Est. tax owed @ 24.0%
- −$230
- After-tax cash flow
- $2,105/yr
For passive investors: Depreciation is non-cash, so a rental often shows a tax loss while cash-flowing — sheltering income. Rental losses are passive: they offset passive income freely, and up to $25,000/yr can offset ordinary (W-2) income if you actively participate and your MAGI is under $100k (phasing out to $0 by $150k); unused losses carry forward. On sale, claimed depreciation is recaptured at up to 25%, and gains may owe capital-gains tax (a 1031 exchange can defer both). Figures are a year-1 estimate at your 24.0% rate — not tax advice; consult a CPA.
Schools (NCES district)
- District
- Muncie Community Schools
- NCES district ID
- 1807320
- Math proficiency
- 18% ▼ -9.00%
- Reading proficiency
- 25% ▼ -4.00%
- Median HH income
- $30,052
- Composite
- 17.22/100
- National rank
- #9099
- State rank
- #275 of 301 in IN
Livability — Muncie
- Score
- 80/100
- State rank
- #18
- US rank
- #1654
Category grades
Schools grade is shown separately in the Schools card above.
Census & demographics
- Census place
- Muncie, IN
- County
- Delaware County · 84,658 people
- City population
- 84,658
- Metro
- Muncie, IN
- Population (ZIP)
- 31,237
- Household income
- $63,215
- Rent vs Own
- Severe rent burden
- 1141.0
Population outlook (Delaware County) Hauer SSP2
- Today (2025)
- 113,036 people
- By 2030
- 111,313 · -1.5%
- By 2040
- 106,432 · -5.8%
- By 2050
- 100,747 · -10.9%
- By 2075
- 91,000 · -19.5%
- By 2100
- 80,687 · -28.6%
Race, ethnicity, and origin ACS 2023
- Neighborhood character
- Predominantly White (85%)
- Race & ethnicity
- White 85% Two or more races 5% Black 4% Asian 4% Hispanic / Latino 3%
- Common ancestry
- Lithuanian 2% Romanian 2% Slovak 1%
- Foreign-born
- 5% · Canada, Vietnam, China
- Languages at home
- 94% English-only · Spanish 2% Other Indo-European 1% Vietnamese 1%
Political lean MEDSL · Delaware
- 2024 margin
- R (+15.8) · D 41.2% · R 57.0% · Other 1.8%
- 2008→2024 swing
- -30.8pp toward R · 2008: 15.0pp · 2024: -15.8pp
- All cycles
- 2024: R+15.8 2020: R+13.2 2016: R+13.7 2012: D+3.1 2008: D+15.0
Not yet ingested
- Civics
- —
Market trends
- HPI YoY
- ▼ -78.53%
- Current HPI
- 197.5213
- Rent YoY
- ▲ 8.08%
- Metro
- Muncie, IN
- State GDP YoY
- ▲ 2.90%
- F500 in state
- 18
Industry mix (Fortune 500 HQ in IN)
| Industry | F500 HQs | Revenue |
|---|---|---|
| Industrial Machinery | 2 | $37B |
|
||
| Healthcare | 1 | $177B |
|
||
| Pharmaceuticals | 1 | $45B |
|
||
| Metals / Steel | 1 | $18B |
|
||
| Agriculture | 1 | $17B |
|
||
| Packaging | 1 | $12B |
|
||
Price history
+80.2% since first listed4 events — show timeline
- 2026-06-16 Listed $89,900 IRMLS
- 2019-07-17 Listing Removed — MIBOR as Distributed by MLS Grid
- 2018-12-18 Listed $49,900 MIBOR as Distributed by MLS Grid
- 2018-12-17 Listed $49,900 IRMLS
Property tax history
-2.9%/yrLatest (2024): $1,284 · +12.6% YoY. Source: county tax records.
Cash-flow waterfall
monthlySold comps — $/sqft
last 12 mo · ≤1 miLoading sold comps…