 🏷️ Likely Rental
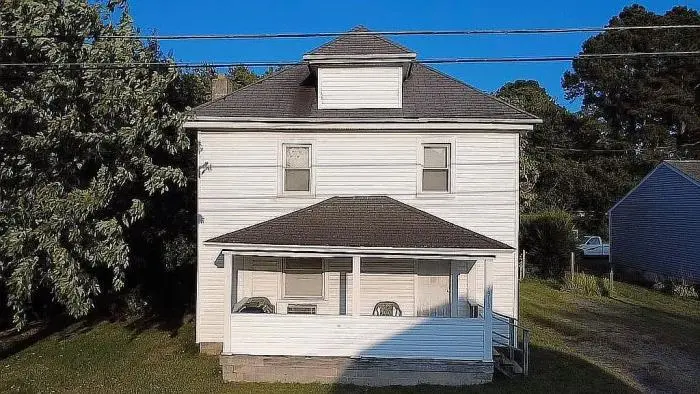
7313 Canal St · Willards, MD
Flood risk 1/10 · Minimal
- FEMA flood zone
- X (unshaded)
- Chance of flooding over 30 yrs
- 0.0%
- Est. flood insurance / yr
- $507 – $1,088
Fire risk 2/10 · Minimal
- Est. fire insurance / yr
- $755 – $1,403
Heat risk 8/10 · Major
- Hot days now (above 105°F)
- 7 days/yr
- Hot days in 30 yrs
- 16 days/yr
Wind risk 8/10 · Major
- Chance of severe wind over 30 yrs
- 80.0%
Air-quality risk 2/10 · Minimal
- Unhealthy air days now
- 1 days/yr
- Unhealthy air days in 30 yrs
- 2 days/yr
Risk factors via First Street. Map © Google.
Why this score? — see what drove the C- grade
The composite is a weighted blend of 9 inputs, each scored 0–100. Each bar is that input's sub-score; the figure is the points it added to the 100-point composite (weight × sub-score).
- Cash flow +19.2/30.0
- Appreciation +7.7/10.0
- ARV discount +7.5/15.0
- DSCR +6.1/10.0
- 1% rule +4.1/10.0
- Livability +2.9/5.0
- Rent growth +2.5/5.0
- Condition / age +2.5/5.0
- Schools +1.9/10.0
$150,000
🖨 Deal sheet (PDF) 📄 Offer letter ✓ Due diligence
Listing remarks MLS
Excellent investment opportunity! This tenant-occupied duplex is available for purchase individually or as part of a package with additional income-producing properties
Key facts
- Built 1933
- Listed 6 days
Neighborhood map
What this means for you Summary
Snapshot
- This is a 2-bed/2.0-bath single-family listed at $150k.
Deal economics
- At list price, monthly cash flow is $163 ($2k/yr) — positive.
- The deal already cash-flows at list — no discount required.
- To meet the 1% rule (rent ≥ 1% of price), the offer needs to be $136k (9.0% below list).
- Recommended offer: $136k (9.0% below list) — sets the bar for 1% rule.
Location & tenants
- Location reads 58/100 on livability (#387 in MD) — a working-class tenant base; expect higher turnover. Strengths: cost of living A+, housing A+, crime B+; Watch: amenities F, commute F, employment F.
- Wicomico County Public Schools (urban): math 16% / reading 26% proficiency, ranked #19 of 24 in MD (top 79%) — low school quality limits family demand, transient renter base, plan for 1-2y turnover.
- Zoned schools: Willards Elementary (math 5% / reading 15%, grade F, #602 of 860 statewide, top 71%, 309 students, 57% FRL); Pittsville Elementary & Middle (math 11% / reading 27%, grade F, #155 of 225 statewide, top 70%, 329 students, 55% FRL); Parkside High (math 52% / reading 59%, grade C, #85 of 222 statewide, top 39%, 1,160 students, 45% FRL) — zoned schools at 52% FRL track the district average.
- Market conditions: 13 active listings in the ZIP; 278 units permitted in Wicomico County in 2024 (44 in 5+ unit buildings).
Forward outlook
- In year one you build about $9k of equity ($1k loan paydown + $8k appreciation (5.5% local appreciation)).
- Wicomico County population projected at +14% by 2050 — modest demand growth; plan on rents tracking national, not racing it.
- At projected returns (5.5% appreciation + 3.0% rent growth), your $42k cash investment doubles in ~4 years — after that, you're playing with house money.
- By year 4, paydown + projected appreciation supports a ~$31k cash-out refi (75% LTV) — recoverable capital for the next deal without selling this one.
Negotiation context
- Only 6 days on market — expect competitive offers; lowballing is unlikely to land.
- 3 sale attempts with the ask held roughly flat each time — persistent listings suggest the price (not the market) is what's stuck; bring a comps-based counter.
- Current owner paid $125k; 20% above their basis — modest negotiation headroom, anchor on the comps not their cost.
Risks & watch-outs
- Watch-outs: built in 1933 — expect roof / HVAC / electrical / plumbing capex.
- Climate carrying-cost: severe wind risk, 80% chance of damaging wind over 30y; extreme-heat days projected 7→16/yr by 2055 (HVAC capex compounding) — expect insurance premiums to compound above CPI over the hold.
Questions for the listing agent
- Built in 1933 — when were the roof, HVAC, electrical panel, plumbing, and water heater last replaced?
- Is there a deadline driving the sale (1031 exchange, divorce, estate, relocation)? That informs how much negotiation room exists.
- Schools are D-rated, which usually means shorter tenancies and higher turnover. Who's the typical renter profile here, and what's been the actual vacancy rate?
- What's the average days-on-market for RENTAL listings here right now (not sales)? A rising rental-DOM trend means longer vacancies and softer asking-rent achievability than the comps imply.
- What's the recent tenant-quality profile in this submarket — average credit score on applications, eviction rate, late-payment / NSF rate, and stable-employment percentage? A property-management company in the area should have these aggregated.
- How much new for-sale + rental construction is in the pipeline within 1–3 miles? Heavy new supply typically softens prices + rents 12–24 months out; constrained supply supports both.
Investment metrics
- 1% rule
- 0.91% ✗
- Cap rate
- 7.60%
- Cash-on-cash
- 4.66%
- DSCR
- 1.21
- GRM
- 9.2
CMA / ARV
- ARV (on-the-fly)
- $348,220
- Comps found
- 11
Show comp detail 11 sales within ~0.75 mi
| Address | Dist | Beds/Ba | Sqft | Sold | Price | $/sf | Match |
|---|---|---|---|---|---|---|---|
| 7313 Canal St | 0.00mi | 3/2.0 (+1) | 1,514 (0%) | 2mo | $125,000 | $83 | 94 |
| 7457 Market St | 0.28mi | 3/2.5 (+1) | 1,440 (-5%) | 3mo | $342,500 | $238 | 70 |
| 7442 Main St | 0.25mi | 3/2.0 (+1) | 1,364 (-10%) | 3mo | $290,000 | $213 | 65 |
| 7329 Market St | 0.32mi | 3/2.0 (+1) | 1,611 (+6%) | 23mo | $350,000 | $217 | 51 |
| 7453 Market St | 0.31mi | 3/2.0 (+1) | 1,337 (-12%) | 16mo | $346,000 | $259 | 48 |
| 7461 Market St | 0.28mi | 3/2.0 (+1) | 1,307 (-14%) | 15mo | $300,000 | $230 | 46 |
| 0 Market St | 0.35mi | 3/2.0 (+1) | 1,337 (-12%) | 20mo | $339,900 | $254 | 43 |
| 7339 Market St | 0.29mi | 2/1.0 | 1,295 (-14%) | 24mo | $290,000 | $224 | 38 |
| 36235 Old Ocean City Rd | 0.38mi | 3/2.5 (+1) | 1,331 (-12%) | 21mo | $312,785 | $235 | 38 |
| 36130 Richland Rd | 0.65mi | 3/2.0 (+1) | 1,344 (-11%) | 15mo | $275,000 | $205 | 33 |
| 6996 Powellville Rd | 0.75mi | 3/2.5 (+1) | 1,688 (+12%) | 15mo | $419,000 | $248 | 27 |
Match score weights: distance 35% · size 25% · config 20% · recency 20%. Top-matched comps best support the ARV.
Projected returns pro-forma
5.46% appreciation · 3.0% rent growth · sell at horizon
- IRR
- 17.9%
- Equity multiple
- 2.16×
- Total profit
- $48,861
- Equity at exit
- $89,220
- IRR
- 17.8%
- Equity multiple
- 4.26×
- Total profit
- $136,910
- Equity at exit
- $157,586
Cash invested: $42,000 (down + closing). Projections, not guarantees.
Landlord ↔ Tenant lean methodology
- Overall (STATE)
- 27 Tenant-Leaning
- State Maryland
- 27 Tenant-Leaning · D+14
- County
- — inherits STATE
- City
- — inherits STATE
ZIP-level market 21874
- Home prices YoY
- 2.1%
- Active inventory
- 13
- Price-to-rent
- 9.2×
Monthly cashflow live
- Estimated rent
- $1,365 medium interval (Pro) →
- Mortgage (P&I)
- −$787
- Tax from tax record
- −$66 /mo · $795/yr
- Insurance
- −$62
- HOA
- −$0
- Vacancy / Maint / Mgmt
- −$287
- Net cashflow
- $163
Break-even live
Sensitivity live
| Price | -10% $248 | -5% $205 | +0% $163 | +5% $121 | +10% $78 |
|---|---|---|---|---|---|
| Rent | -10% $55 | -5% $109 | +0% $163 | +5% $217 | +10% $271 |
| Rate | -1.0pp $238 | -0.5pp $201 | base $163 | +0.5pp $124 | +1.0pp $85 |
UW: 25.0% down · 7.5% · 30yr · 1.5% tax · 5.0% vac · 8.0% maint · 8.0% mgmt
Financing live
Cash to close
- Down payment
- $37,500
- Closing costs
- $4,500
- Reserves months
- —
- Total cash needed
- —
Loan-product check · same deal, 3 products live
Conventional
25% down · 7.5% · 30yr
- Down + closing
- —
- Monthly P&I
- —
- Monthly cashflow
- —
- DSCR
- —
- Eligible?
- —
Personal DTI + credit; lowest rate.
DSCR
20% down · 8.5% · 30yr
- Down + closing
- —
- Monthly P&I
- —
- Monthly cashflow
- —
- DSCR
- —
- Eligible?
- —
No personal income docs; deal must DSCR.
Hard money
10% down · 12.0% · 12mo
- Down + closing
- —
- Monthly P&I
- —
- Monthly cashflow
- —
- DSCR
- —
- Eligible?
- —
Short-term bridge; refi at stabilization.
Listing history 5 events
-
2026-06-21days on market $150,000 Active 6 DOM
-
2026-06-18days on market $150,000 Active 3 DOM
-
2026-06-17days on market $150,000 Active 2 DOM
-
2026-06-15remarks 170-char remark
-
2026-06-15$150,000 Active 1 DOM
ⓘ Source: listings_history table (triggers on properties + properties_extension) + one-shot
backfill from property_details.listing_events for pre-trigger history.
Tax reassessment forecast MD · Partial reset (capped growth)
- Current annual tax
- $795 · $66/mo
- Projected year-2 tax
- $1,215 · $101/mo
- Expected delta
- +$420/yr (+$35/mo · 52.8%)
ⓘ Screening estimate from a state-policy table — verify with the county assessor before closing.
Climate risk First Street
- Flood 1/10 Low FEMA zone X (unshaded) · 0% chance over 30 yrs
- Wildfire 2/10 Low
- Heat 8/10 Severe 7 d/yr ≥105°F today · 16 d/yr by 30 yrs out
- Wind 8/10 Severe 80% chance of damaging wind over 30 yrs
- Air quality 2/10 Low 1 unhealthy d/yr today · 2 by 30 yrs out
Nearby sold comps map
Loading sold comps map…
Walkable amenities ~0.75 mi
Loading nearby amenities…
Taxation est. · year 1
- Rental income
- $16,379
- − Mortgage interest
- −$8,402
- − Property taxes
- −$795
- − Insurance
- −$750
- − Repairs & maintenance
- −$1,310
- − Management
- −$1,310
- − Depreciation
- −$4,364
- Taxable loss
- −$552
- Est. tax savings @ 24.0%
- +$133
- After-tax cash flow
- $2,088/yr
For passive investors: Depreciation is non-cash, so a rental often shows a tax loss while cash-flowing — sheltering income. Rental losses are passive: they offset passive income freely, and up to $25,000/yr can offset ordinary (W-2) income if you actively participate and your MAGI is under $100k (phasing out to $0 by $150k); unused losses carry forward. On sale, claimed depreciation is recaptured at up to 25%, and gains may owe capital-gains tax (a 1031 exchange can defer both). Figures are a year-1 estimate at your 24.0% rate — not tax advice; consult a CPA.
Schools (NCES district)
- District
- Wicomico County Public Schools
- NCES district ID
- 2400690
- Math proficiency
- 16% ▼ -18.00%
- Reading proficiency
- 26% ▼ -13.00%
- Median HH income
- $51,745
- Composite
- 18.87/100
- National rank
- #8860
- State rank
- #19 of 24 in MD
Livability — Willards
- Score
- 58/100
- State rank
- #387
- US rank
- #21084
Category grades
Schools grade is shown separately in the Schools card above.
Census & demographics
- Census place
- Willards, MD
- City population
- 1,847
- Population (ZIP)
- 1,847
Population outlook (Wicomico County) Hauer SSP2
- Today (2025)
- 108,548 people
- By 2030
- 111,783 · +3.0%
- By 2040
- 118,139 · +8.8%
- By 2050
- 123,641 · +13.9%
- By 2075
- 139,784 · +28.8%
- By 2100
- 145,334 · +33.9%
Race, ethnicity, and origin ACS 2023
- Neighborhood character
- Predominantly White (70%)
- Race & ethnicity
- White 70% Hispanic / Latino 20% Two or more races 12% Black 2%
- Hispanic origin (detail)
- Mexican 14%
- Common ancestry
- Romanian 2% Russian 1% Slovak 1%
- Foreign-born
- 11% · Canada
- Languages at home
- 81% English-only · Spanish 17% Arabic 1% Other Asian/Pacific 1%
Political lean MEDSL · Wicomico
- 2024 margin
- Lean R (+5.5) · D 46.1% · R 51.5% · Other 2.4%
- 2008→2024 swing
- +0.3pp no change · 2008: -5.8pp · 2024: -5.5pp
- All cycles
- 2024: R+5.5 2020: R+1.9 2016: R+11.6 2012: R+6.9 2008: R+5.8
Not yet ingested
- Civics
- —
Market trends
- HPI YoY
- ▲ 5.46%
- Current HPI
- 259.1252
- Rent YoY
- —
- Metro
- —
- State GDP YoY
- ▲ 2.97%
- F500 in state
- 12
Industry mix (Fortune 500 HQ in MD)
| Industry | F500 HQs | Revenue |
|---|---|---|
| Aerospace / Defense | 1 | $71B |
|
||
| Utilities | 1 | $25B |
|
||
| Hotels | 1 | $24B |
|
||
| Consumer Goods | 1 | $7B |
|
||
| Real Estate | 1 | $6B |
|
||
| Chemicals | 1 | $2B |
|
||
Price history
+614.3% since first listed18 events — show timeline
- 2026-06-11 Listed $150,000 Fizber.com
- 2026-05-11 Sold (Public Records) $125,000 Public Records
- 2026-04-29 Sold (MLS) $125,000 BRIGHT MLS
- 2026-04-29 Sold (MLS) $125,000 BRIGHT MLS
- 2026-02-28 Price Changed $130,000 BRIGHT MLS
- 2025-12-27 Contingent — BRIGHT MLS
- 2025-12-15 Price Changed $140,000 BRIGHT MLS
- 2025-12-15 Price Changed $140,000 BRIGHT MLS
- 2025-11-17 Price Changed $155,000 BRIGHT MLS
- 2025-11-17 Price Changed $155,000 BRIGHT MLS
- 2025-10-14 Price Changed $160,000 BRIGHT MLS
- 2025-10-14 Price Changed $160,000 BRIGHT MLS
- 2025-09-10 Listed $170,000 BRIGHT MLS
- 2025-09-10 Listed $170,000 BRIGHT MLS
- 2024-10-25 Sold (Public Records) $150,000 Public Records
- 2019-02-08 Sold (Public Records) $85,000 Public Records
- 2004-06-21 Sold (Public Records) $55,000 Public Records
- 1985-11-05 Sold (Public Records) $21,000 Public Records
Property tax history
-1.2%/yrLatest (2025): $795 · +2.2% YoY. Source: county tax records.
Cash-flow waterfall
monthlySold comps — $/sqft
last 12 mo · ≤1 miLoading sold comps…