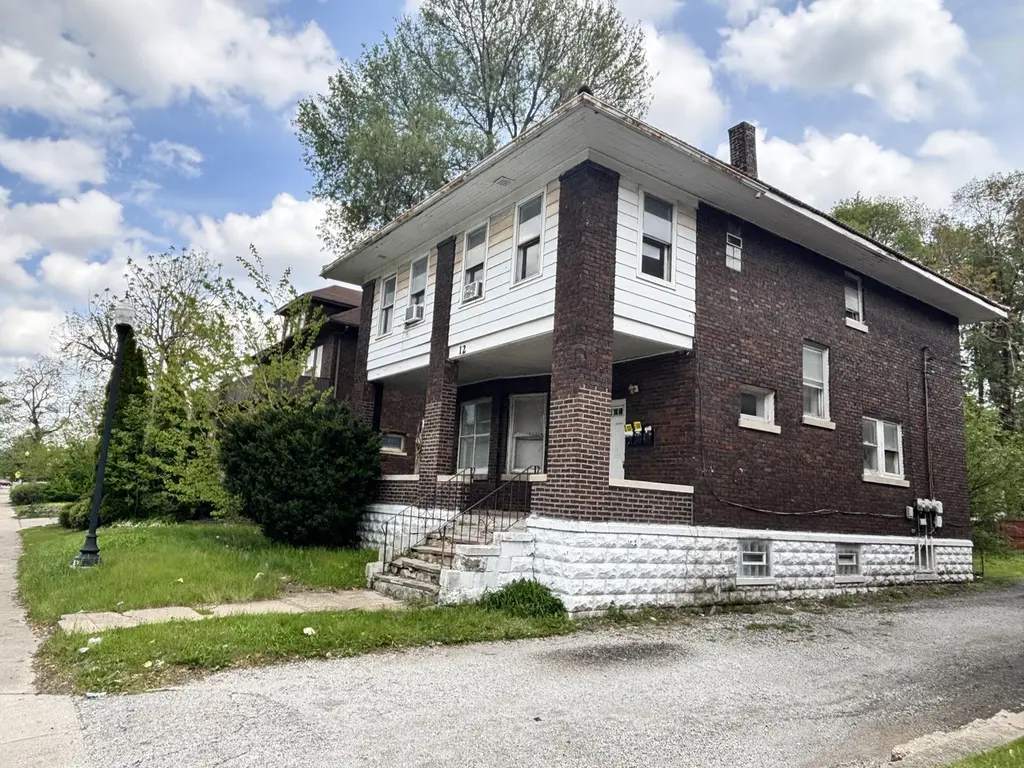
 Triplex
10-12 Waltham St · Hammond, IN
Flood risk 6/10 · Moderate
- FEMA flood zone
- X (unshaded)
- Chance of flooding over 30 yrs
- 0.69%
- Est. flood insurance / yr
- $473 – $860
Fire risk 1/10 · Minimal
- Est. fire insurance / yr
- $717 – $1,331
Heat risk 3/10 · Minor
- Hot days now (above 102°F)
- 7 days/yr
- Hot days in 30 yrs
- 15 days/yr
Wind risk 2/10 · Minimal
- Chance of severe wind over 30 yrs
- —
Air-quality risk 4/10 · Minor
- Unhealthy air days now
- 5 days/yr
- Unhealthy air days in 30 yrs
- 6 days/yr
Risk factors via First Street. Map © Google.
Why this score? — see what drove the B+ grade
The composite is a weighted blend of 9 inputs, each scored 0–100. Each bar is that input's sub-score; the figure is the points it added to the 100-point composite (weight × sub-score).
- Cash flow +30.0/30.0
- 1% rule +10.0/10.0
- DSCR +10.0/10.0
- Appreciation +10.0/10.0
- ARV discount +7.5/15.0
- Rent growth +4.4/5.0
- Livability +3.5/5.0
- Condition / age +2.2/5.0
- Schools +1.1/10.0
$150,000
🖨 Deal sheet 📄 Offer letter ✓ Due diligence
Multi-family units
County records classify this as Multi-Family (2-4 Unit). Listing-text estimate: 3 units. confirmed
Listing remarks
Don't miss this excellent opportunity to own a 3-unit multifamily property in the heart of Hammond. Perfect for investors or owner-occupants looking to build equity and generate rental income. This property features: One 1-bedroom unit, Two 2-bedroom units. Strong rental potential with multiple income streams. Great layout for long-term tenants or house hacking opportunities The building does need some updating and repairs, making it an ideal opportunity for investors looking to add value and increase cash flow. Conveniently located near shopping, restaurants, schools, and major commuter routes, with easy access to public transportation and nearby city amenities. Tenants will appreciate the
Key facts
- Long-term tenants
- Multifamily property
- Conveniently located
Tags
Property features AI
Finance
- Other: Property is vacant; Three total units
Exterior
- Parking: Three parking spaces total; Two-car garage
- Utilities: Cable connected; Water connected (public); Natural gas connected; Electricity connected; Public sewer
- Home design: Two-story multi-unit building; Built in 1912; Property listed as fixer
- Construction: Asphalt shingle roof; Assessor-recorded living area
- Exterior features: Neighborhood view; Front porch; Rear porch
Interior
- Kitchen: No appliances listed
- Bedrooms: Total of 3 residential units: one 1-bedroom unit and two 2-bedroom units
- Flooring: Carpet; Vinyl
- Bathrooms: Three full bathrooms
- Heating & cooling: Forced air heating (natural gas); No central cooling listed
- Interior features: No special interior features listed; Full unfinished basement
- Laundry & utility: No laundry appliances listed
Neighborhood map
What this means for you Summary
Snapshot
- This is a 1×1bd/1ba + 2×2bd/1ba units multifamily listed at $150k. Condition is rated fair.
Deal economics
- At list price, monthly cash flow is $2k ($24k/yr) — positive. Per door: $660/mo.
- The deal already cash-flows at list — no discount required.
- Meets the 1% rule at list price ($4k rent vs $150k).
- Recommended offer: $146k (3.0% below list) — sets the bar for market timing.
- Cap rate 22.1% vs local median 5.8% in Hammond — top-decile yield for the area; either an underpriced asset or a hidden risk that comps aren't pricing in. Stress-test before assuming the spread holds.
Location & tenants
- Location reads 70/100 on livability (#143 in IN) — a middle-class / working-renter tenant base. Strengths: cost of living A+, housing A+, commute A; Watch: health & safety D+, employment D, schools F.
- School City Of Hammond (suburban): math 8% / reading 18% proficiency, ranked #289 of 301 in IN (top 96%) — low school quality limits family demand, transient renter base, plan for 1-2y turnover; 74% free/reduced lunch — lower-income household profile, screen leases tightly.
- Market conditions: Rents rising fast (+7.6%/yr); 52 active listings in the ZIP; lower-income renter base — watch delinquency; 1,642 units permitted in Lake County in 2024 (14 in 5+ unit buildings).
- At $3,820/mo this rent would consume 123% of the median local household income ($37k/yr) (locally 900% of renters already pay >50% of income on rent) — very limited rent-growth headroom before tenants either downsize or default.
Forward outlook
- In year one you build about $16k of equity ($1k loan paydown + $15k appreciation (10.0% local appreciation)).
- Lake County population projected to shrink 7% by 2050 — rents likely to lag national; underwrite the cash flow, not the appreciation.
- At projected returns (10.0% appreciation + 7.6% rent growth), your $42k cash investment doubles in ~2 years — after that, you're playing with house money.
- By year 3, paydown + projected appreciation supports a ~$41k cash-out refi (75% LTV) — recoverable capital for the next deal without selling this one.
Negotiation context
- It's been on market 38 days — a 3% lower offer ($146k) is reasonable based on typical stale-listing flexibility.
- 5 sale attempts since 22y ago; this cycle's ask has dropped $25k (14%) from the opening price — seller is motivated, your offer sets the floor, not the list.
Risks & watch-outs
- Watch-outs: built in 1912 — expect roof / HVAC / electrical / plumbing capex.
- Climate carrying-cost: major flood risk — expect insurance premiums to compound above CPI over the hold.
Questions for the listing agent
- It's been on market 38 days. Have you received any prior offers? Is the seller open to a 3% concession, seller financing, or rate buy-down credit?
- Can we see the unit-by-unit rent roll, current vacancy, and any below-market leases? What's the average tenancy length?
- What capital expenditures (roof, boiler, parking lot, exteriors) have been made in the last 5 years, and what's planned in the next 2?
- Have any recent inspections been done? Can we get a copy of the seller's disclosures and any deferred-maintenance estimates?
- Built in 1912 — when were the roof, HVAC, electrical panel, plumbing, and water heater last replaced?
- Is there a deadline driving the sale (1031 exchange, divorce, estate, relocation)? That informs how much negotiation room exists.
- Schools are F-rated, which usually means shorter tenancies and higher turnover. Who's the typical renter profile here, and what's been the actual vacancy rate?
- Crime grade is F in this area — have there been break-ins, vandalism, or insurance claims at this property in the last 3 years? What carrier currently insures it and at what premium?
- What's the average days-on-market for RENTAL listings here right now (not sales)? A rising rental-DOM trend means longer vacancies and softer asking-rent achievability than the comps imply.
- What's the recent tenant-quality profile in this submarket — average credit score on applications, eviction rate, late-payment / NSF rate, and stable-employment percentage? A property-management company in the area should have these aggregated.
- How much new apartment / multifamily construction is in the pipeline within 1–3 miles? Heavy new supply (>2% of stock underway) typically softens rents 12–24 months out; light construction supports rent growth.
Investment metrics
- 1% rule
- 2.55% ✓
- Cap rate
- 22.14%
- Cash-on-cash
- 56.61%
- DSCR
- 3.52
- GRM
- 3.3
CMA / ARV
No comps found within radius.
Projected returns pro-forma
10.0% appreciation · 7.61% rent growth · sell at horizon
- IRR
- 73.0%
- Equity multiple
- 6.39×
- Total profit
- $226,476
- Equity at exit
- $135,132
- IRR
- 68.5%
- Equity multiple
- 15.60×
- Total profit
- $613,063
- Equity at exit
- $291,417
Cash invested: $42,000 (down + closing). Projections, not guarantees.
Landlord ↔ Tenant lean methodology
- Overall (STATE)
- 90 Strongly Landlord-Friendly
- State Indiana
- 90 Strongly Landlord-Friendly · R+11
- County
- — inherits STATE
- City
- — inherits STATE
ZIP-level market 46320
- Home prices YoY
- 5.0%
- Rents YoY
- 7.6%
- Active inventory
- 52
- Price-to-rent
- 11.4×
Monthly cashflow live
- Estimated rent
- $3,820 high interval (Pro) →
- Mortgage (P&I)
- −$787
- Tax est. 1.5%
- −$188 /mo · $2,250/yr
- Insurance
- −$62
- HOA
- −$0
- Vacancy / Maint / Mgmt
- −$802
- Net cashflow
- $1,981
Break-even live
3-unit breakdown (identical units grouped — click to expand)
| Units | Beds | Baths | Est. rent |
|---|---|---|---|
| 1× unit | 1 | 1 | $1,093 |
| 2× units | 2 | 1 | $2,728 |
| #2 | 2 | 1 | $1,364 |
| #3 | 2 | 1 | $1,364 |
| Total (3 units) | $3,820 | ||
UW: 25.0% down · 7.5% · 30yr · 1.5% tax · 5.0% vac · 8.0% maint · 8.0% mgmt
Financing live
Cash to close
- Down payment
- $37,500
- Closing costs
- $4,500
- Reserves months
- —
- Total cash needed
- —
Loan-product check · same deal, 3 products live
Conventional
25% down · 7.5% · 30yr
- Down + closing
- —
- Monthly P&I
- —
- Monthly cashflow
- —
- DSCR
- —
- Eligible?
- —
Personal DTI + credit; lowest rate.
DSCR
20% down · 8.5% · 30yr
- Down + closing
- —
- Monthly P&I
- —
- Monthly cashflow
- —
- DSCR
- —
- Eligible?
- —
No personal income docs; deal must DSCR.
Hard money
10% down · 12.0% · 12mo
- Down + closing
- —
- Monthly P&I
- —
- Monthly cashflow
- —
- DSCR
- —
- Eligible?
- —
Short-term bridge; refi at stabilization.
Listing history 22 events
-
2026-06-18days on market $150,000 Active 38 DOM
-
2026-06-17days on market $150,000 Active 37 DOM
-
2026-06-16days on market $150,000 Active 36 DOM
-
2026-06-15days on market $150,000 Active 35 DOM
-
2026-06-13days on market $150,000 Active 33 DOM
-
2026-06-09days on market $150,000 Active 29 DOM
-
2026-06-08days on market $150,000 Active 28 DOM
-
2026-06-07days on market $150,000 Active 27 DOM
-
2026-06-04days on market $150,000 Active 24 DOM
-
2026-06-03days on market $150,000 Active 23 DOM
-
2026-06-02days on market $150,000 Active 22 DOM
-
2026-06-01days on market $150,000 Active 21 DOM
-
2026-05-31days on market $150,000 Active 20 DOM
-
2026-05-11$175,000 Active
-
2012-05-01historical
-
2011-10-24$55,000
-
2007-10-27historical
-
2007-05-26$85,000
-
2007-05-06historical
-
2006-11-06$99,900
-
2005-05-23historical
-
2004-04-21$89,900
ⓘ Source: listings_history table (triggers on properties + properties_extension) + one-shot
backfill from property_details.listing_events for pre-trigger history.
Climate risk First Street
- Flood 6/10 Major FEMA zone X (unshaded) · 69% chance over 30 yrs
- Wildfire 1/10 Low
- Heat 3/10 Moderate 7 d/yr ≥102°F today · 15 d/yr by 30 yrs out
- Wind 2/10 Low
- Air quality 4/10 Moderate 5 unhealthy d/yr today · 6 by 30 yrs out
Nearby sold comps map
Loading sold comps map…
Walkable amenities ~0.75 mi
Loading nearby amenities…
Taxation est. · year 1
- Rental income
- $45,840
- − Mortgage interest
- −$8,402
- − Property taxes
- −$2,250
- − Insurance
- −$750
- − Repairs & maintenance
- −$3,667
- − Management
- −$3,667
- − Depreciation
- −$4,364
- Taxable income
- $22,740
- Est. tax owed @ 24.0%
- −$5,458
- After-tax cash flow
- $18,317/yr
For passive investors: Depreciation is non-cash, so a rental often shows a tax loss while cash-flowing — sheltering income. Rental losses are passive: they offset passive income freely, and up to $25,000/yr can offset ordinary (W-2) income if you actively participate and your MAGI is under $100k (phasing out to $0 by $150k); unused losses carry forward. On sale, claimed depreciation is recaptured at up to 25%, and gains may owe capital-gains tax (a 1031 exchange can defer both). Figures are a year-1 estimate at your 24.0% rate — not tax advice; consult a CPA.
Condition & rehab AI · 12 photos
This 3-unit multifamily property requires moderate renovations to improve its condition and increase its value. Key areas for improvement include the kitchen, bathrooms, flooring, and exterior. With updates, it presents a strong opportunity for investors to increase cash flow and property value.
Repairs flagged
- Major kitchen cabinets — Old and worn
- Major bathroom fixtures — Old and worn
- Major flooring — Worn and outdated
- Major interior paint — Worn and peeling
- Major exterior siding — Worn and peeling
- Major windows — Old and possibly drafty
- Major HVAC units — Old and possibly inefficient
Value-add opportunities
- Both New kitchen cabinets and countertops — Modernizes the space and increases appeal
- Both New flooring throughout — Improves comfort and appearance
- Both New paint and freshening of interior walls — Enhances the overall look and feel
- Both New windows and door seals — Improves energy efficiency and comfort
- Both New HVAC units — Improves comfort and energy efficiency
- Both Landscaping and curb appeal improvements — Enhances the overall appearance and appeal
Renovation cost estimate screening
| Repair item | Severity | Est. cost |
|---|---|---|
| kitchen cabinets · Old and worn | Major | $15,000–50,000 |
| bathroom fixtures · Old and worn | Major | $15,000–50,000 |
| flooring · Worn and outdated | Major | $15,000–50,000 |
| interior paint · Worn and peeling | Major | $15,000–50,000 |
| exterior siding · Worn and peeling | Major | $15,000–50,000 |
| windows · Old and possibly drafty | Major | $15,000–50,000 |
| HVAC units · Old and possibly inefficient | Major | $15,000–50,000 |
| Total estimated repair cost · 7 items | $105,000–350,000 |
Value-add ROI direction
- Both New kitchen cabinets and countertops — Modernizes the space and increases appeal ↑
- Both New flooring throughout — Improves comfort and appearance ↑
- Both New paint and freshening of interior walls — Enhances the overall look and feel ↑
- Both New windows and door seals — Improves energy efficiency and comfort ↑
- Both New HVAC units — Improves comfort and energy efficiency ↑
- Both Landscaping and curb appeal improvements — Enhances the overall appearance and appeal ↑
ⓘ Cost ranges are severity-bucket heuristics (US national rule-of-thumb). Get contractor quotes + a written scope before underwriting a rehab budget.
Schools (NCES district)
- District
- School City Of Hammond
- NCES district ID
- 1804320
- Math proficiency
- 8% ▼ -18.00%
- Reading proficiency
- 18% ▼ -15.00%
- Median HH income
- $39,970
- Composite
- 11.11/100
- National rank
- #9730
- State rank
- #289 of 301 in IN
Livability — Hammond
- Score
- 70/100
- State rank
- #143
- US rank
- #7343
Category grades
Schools grade is shown separately in the Schools card above.
Census & demographics
- Census place
- Hammond, IN
- County
- Lake County · 422,878 people
- City population
- 58,809
- Metro
- Chicago-Naperville-Elgin, IL-IN-WI
- Population (ZIP)
- 14,353
- Household income
- $37,158
- Rent vs Own
- Severe rent burden
- 900.0
Population outlook (Lake County) Hauer SSP2
- Today (2025)
- 484,026 people
- By 2030
- 478,091 · -1.2%
- By 2040
- 462,974 · -4.3%
- By 2050
- 449,894 · -7.1%
- By 2075
- 436,169 · -9.9%
- By 2100
- 426,607 · -11.9%
Race, ethnicity, and origin ACS 2023
- Neighborhood character
- Diverse neighborhood (Simpson 0.64)
- Race & ethnicity
- Black 44% Hispanic / Latino 39% White 14% Two or more races 12% Asian 1%
- Hispanic origin (detail)
- Mexican 31% Puerto Rican 4%
- Common ancestry
- Romanian 2% Lithuanian 1%
- Foreign-born
- 14% · Canada
- Languages at home
- 68% English-only · Spanish 31%
Political lean MEDSL · Lake
- 2024 margin
- Lean D (+5.6) · D 52.1% · R 46.5% · Other 1.5%
- 2008→2024 swing
- -28.6pp toward R · 2008: 34.3pp · 2024: 5.6pp
- All cycles
- 2024: D+5.6 2020: D+15.1 2016: D+20.6 2012: D+31.0 2008: D+34.3
Not yet ingested
- Civics
- —
Market trends
- HPI YoY
- ▲ 13.81%
- Current HPI
- 288.1513
- Rent YoY
- ▲ 7.61%
- Metro
- Chicago-Naperville-Elgin, IL-IN-WI
- State GDP YoY
- ▲ 2.90%
- F500 in state
- 18
Industry mix (Fortune 500 HQ in IN)
| Industry | F500 HQs | Revenue |
|---|---|---|
| Industrial Machinery | 2 | $37B |
|
||
| Healthcare | 1 | $177B |
|
||
| Pharmaceuticals | 1 | $45B |
|
||
| Metals / Steel | 1 | $18B |
|
||
| Agriculture | 1 | $17B |
|
||
| Packaging | 1 | $12B |
|
||
Price history
+94.7% since first listed9 events — show timeline
- 2026-05-11 Listed $175,000 NIRA MLS as Distributed by MLS Grid
- 2012-05-01 Listing Removed — NIRA MLS as Distributed by MLS Grid
- 2011-10-24 Listed $55,000 NIRA MLS as Distributed by MLS Grid
- 2007-10-27 Listing Removed — NIRA MLS as Distributed by MLS Grid
- 2007-05-26 Listed $85,000 NIRA MLS as Distributed by MLS Grid
- 2007-05-06 Listing Removed — NIRA MLS as Distributed by MLS Grid
- 2006-11-06 Listed $99,900 NIRA MLS as Distributed by MLS Grid
- 2005-05-23 Listing Removed — NIRA MLS as Distributed by MLS Grid
- 2004-04-21 Listed $89,900 NIRA MLS as Distributed by MLS Grid
Cash-flow waterfall
monthlySold comps — $/sqft
last 12 mo · ≤1 miLoading sold comps…