14777 Masterson Way · Magalia, CA
Flood risk 9/10 · Severe
- FEMA flood zone
- X (unshaded)
- Chance of flooding over 30 yrs
- 0.99%
- Est. flood insurance / yr
- $507 – $1,088
Fire risk 7/10 · Major
- Est. fire insurance / yr
- $659 – $1,223
Heat risk 4/10 · Minor
- Hot days now (above 97°F)
- 7 days/yr
- Hot days in 30 yrs
- 18 days/yr
Wind risk 1/10 · Minimal
- Chance of severe wind over 30 yrs
- —
Air-quality risk 10/10 · Severe
- Unhealthy air days now
- 37 days/yr
- Unhealthy air days in 30 yrs
- 42 days/yr
Risk factors via First Street. Map © Google.
Why this score? — see what drove the D+ grade
The composite is a weighted blend of 9 inputs, each scored 0–100. Each bar is that input's sub-score; the figure is the points it added to the 100-point composite (weight × sub-score).
- Cash flow +23.5/30.0
- DSCR +7.6/10.0
- 1% rule +5.0/10.0
- Schools +5.0/10.0
- Livability +2.6/5.0
- Rent growth +2.5/5.0
- Condition / age +2.5/5.0
- ARV discount +0.0/15.0
- Appreciation +0.0/10.0
$132,888
🖨 Deal sheet 📄 Offer letter ✓ Due diligence
Listing remarks
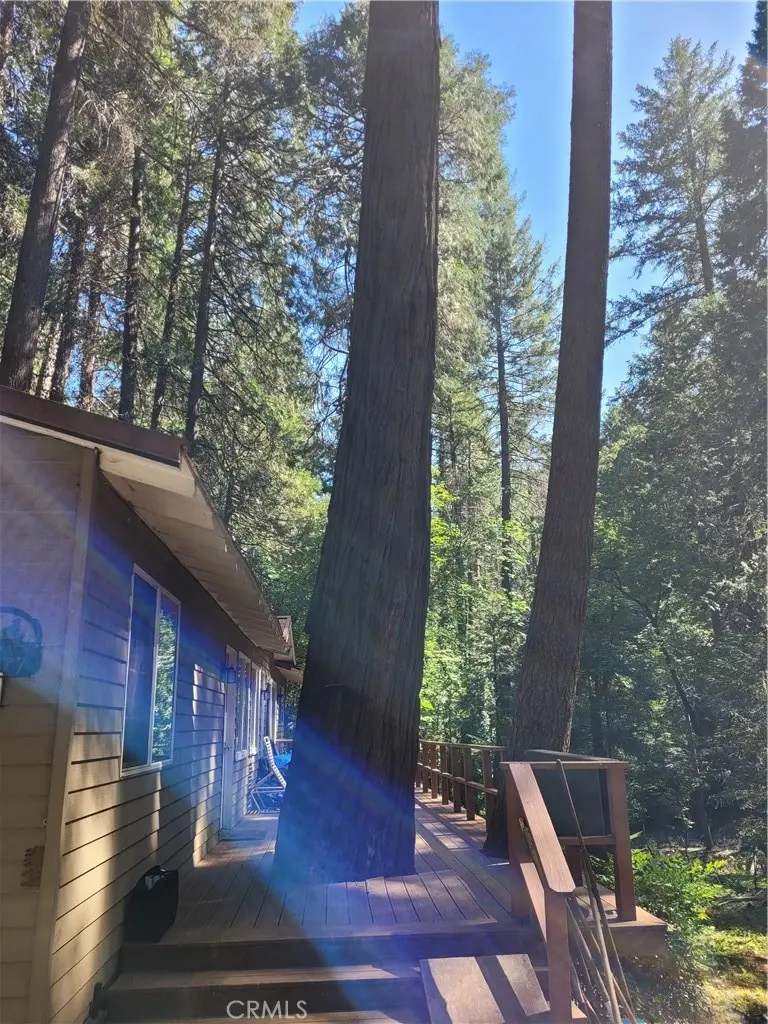
For sale is a single manufactured house on about half an acre with rolling topography. Then further down the driveway leads to a the unit. There is around half an acre here, on irregular shaped lot that backs to a creek. Right down a steep driveway is a charming mountain retreat on nearly half an acre in the peaceful pines of Magalia. This 1-bedroom, 1-bath manufactured home offers comfortable living with a functional layout, cozy fireplace, and serene natural surroundings. Situated on a spacious 0.48-acre lot, the property provides ample room for gardening, recreation, parking, and potential expansion. One possible benefit is there is no HOA on this side of town. Enjoy mountain living that
Key facts
- Rolling topography
- Irregular shaped lot
- Mountain retreat
Tags
Property features AI
Finance
- HOA & community: Rural community
Exterior
- Utilities: Public water (district); Septic tank
- Home design: Single-story; Entry level 1
- Construction: No ADU; Year built source: Assessor
- Exterior features: Manufactured house; No pool
Interior
- Bedrooms: Primary bedroom on the main level
- Bathrooms: 1 full bathroom on the main level
- Heating & cooling: Central cooling
- Interior features: One-level layout; Entry accessed down the driveway and up a deck; Has a fireplace in the living room; Has a view
- Laundry & utility: Washer included; Dryer included
Neighborhood map
What this means for you Summary
Snapshot
- This is a 1-bed/1.0-bath manufactured listed at $133k.
Deal economics
- At list price, monthly cash flow is $182 ($2k/yr) — positive.
- The deal already cash-flows at list — no discount required.
- Meets the 1% rule at list price ($1k rent vs $133k).
- Recommended offer: $131k (1.5% below list) — sets the bar for market timing.
- Cap rate 8.5% vs local median 4.0% in Magalia — top-decile yield for the area; either an underpriced asset or a hidden risk that comps aren't pricing in. Stress-test before assuming the spread holds.
Location & tenants
- Location reads 51/100 on livability (#1,094 in CA) — a working-class tenant base; expect higher turnover. Strengths: housing A+; Watch: employment C-, schools F, crime F.
- Market conditions: 211 active listings in the ZIP; 1 comparable units currently listed for rent nearby; 946 units permitted in Butte County in 2024 (254 in 5+ unit buildings).
Forward outlook
- Local home prices are declining (-3.0%/yr); year-one equity from $919 of loan paydown is wiped out by about $4k of value loss. Plan a longer hold.
- Butte County population projected at +10% by 2050 — modest demand growth; plan on rents tracking national, not racing it.
Negotiation context
- It's been on market 22 days — a 2% lower offer ($131k) is reasonable based on typical stale-listing flexibility.
- 4 sale attempts since 20y ago with the ask held roughly flat each time — persistent listings suggest the price (not the market) is what's stuck; bring a comps-based counter.
- Current owner paid $110k; 21% above their basis — modest negotiation headroom, anchor on the comps not their cost.
Risks & watch-outs
- Watch-outs: flood insurance adds $66/mo.
- Climate carrying-cost: severe flood risk; major wildfire risk — expect insurance premiums to compound above CPI over the hold.
Questions for the listing agent
- Built in 1972 — when were the roof, HVAC, electrical panel, plumbing, and water heater last replaced?
- What's the actual annual flood-insurance premium (NFIP or private), and is the property in a SFHA with mandatory coverage?
- Is there a deadline driving the sale (1031 exchange, divorce, estate, relocation)? That informs how much negotiation room exists.
- Schools are F-rated, which usually means shorter tenancies and higher turnover. Who's the typical renter profile here, and what's been the actual vacancy rate?
- Crime grade is F in this area — have there been break-ins, vandalism, or insurance claims at this property in the last 3 years? What carrier currently insures it and at what premium?
- The area grade is low — what's the realistic commute time and amenity access for the typical tenant pool here? Any planned neighborhood developments (good or bad) we should know about?
- What's the average days-on-market for RENTAL listings here right now (not sales)? A rising rental-DOM trend means longer vacancies and softer asking-rent achievability than the comps imply.
- What's the recent tenant-quality profile in this submarket — average credit score on applications, eviction rate, late-payment / NSF rate, and stable-employment percentage? A property-management company in the area should have these aggregated.
- How much new for-sale + rental construction is in the pipeline within 1–3 miles? Heavy new supply typically softens prices + rents 12–24 months out; constrained supply supports both.
Investment metrics
- 1% rule
- 1.00% ✓
- Cap rate
- 8.53%
- Cash-on-cash
- 8.00%
- DSCR
- 1.36
- GRM
- 8.3
CMA / ARV
- ARV (on-the-fly)
- $91,540
- Comps found
- 6
Show comp detail 6 sales within ~0.75 mi
| Address | Dist | Beds/Ba | Sqft | Sold | Price | $/sf | Match |
|---|---|---|---|---|---|---|---|
| 14775 Glenwood Dr | 0.58mi | 2/1.0 (+1) | 798 (+0%) | 14mo | $95,000 | $119 | 55 |
| 14842 Upland Rd | 0.50mi | 1/1.5 | 744 (-6%) | 10mo | $100,000 | $134 | 55 |
| 14717 Wood | 0.52mi | 2/1.0 (+1) | 864 (+8%) | 4mo | $65,000 | $75 | 54 |
| 14750 Glenwood Dr | 0.61mi | 2/1.5 (+1) | 825 (+4%) | 9mo | $95,000 | $115 | 51 |
| 14794 Glenwood Dr | 0.63mi | 1/1.0 | 900 (+13%) | 10mo | $80,000 | $89 | 41 |
| 14820 Glenwood Dr | 0.64mi | 2/1.0 (+1) | 700 (-12%) | 14mo | $27,000 | $39 | 34 |
Match score weights: distance 35% · size 25% · config 20% · recency 20%. Top-matched comps best support the ARV.
Projected returns pro-forma
-3.0% appreciation · 3.0% rent growth · sell at horizon
- IRR
- -7.3%
- Equity multiple
- 0.73×
- Total profit
- $-9,969
- Equity at exit
- $19,814
- IRR
- 2.3%
- Equity multiple
- 1.17×
- Total profit
- $6,185
- Equity at exit
- $11,490
Cash invested: $37,209 (down + closing). Projections, not guarantees.
Landlord ↔ Tenant lean methodology
- Overall (STATE)
- 18 Strongly Tenant-Friendly
- State California
- 18 Strongly Tenant-Friendly · D+13
- County
- — inherits STATE
- City
- — inherits STATE
ZIP-level market 95954
- Home prices YoY
- -30.0%
- Active inventory
- 211
- Price-to-rent
- 8.3×
Monthly cashflow live
- Estimated rent
- $1,333 medium interval (Pro) →
- Mortgage (P&I)
- −$697
- Tax from tax record
- −$53 /mo · $632/yr
- Insurance
- −$55
- Flood insurance flood zone
- −$66 /mo · $798/yr
- HOA
- −$0
- Vacancy / Maint / Mgmt
- −$280
- Net cashflow
- $182
Break-even live
UW: 25.0% down · 7.5% · 30yr · 1.5% tax · 5.0% vac · 8.0% maint · 8.0% mgmt
Financing live
Cash to close
- Down payment
- $33,222
- Closing costs
- $3,987
- Reserves months
- —
- Total cash needed
- —
Loan-product check · same deal, 3 products live
Conventional
25% down · 7.5% · 30yr
- Down + closing
- —
- Monthly P&I
- —
- Monthly cashflow
- —
- DSCR
- —
- Eligible?
- —
Personal DTI + credit; lowest rate.
DSCR
20% down · 8.5% · 30yr
- Down + closing
- —
- Monthly P&I
- —
- Monthly cashflow
- —
- DSCR
- —
- Eligible?
- —
No personal income docs; deal must DSCR.
Hard money
10% down · 12.0% · 12mo
- Down + closing
- —
- Monthly P&I
- —
- Monthly cashflow
- —
- DSCR
- —
- Eligible?
- —
Short-term bridge; refi at stabilization.
Rent comps 1 comps
| Address | Beds | Baths | Sqft | Rent | $/sqft | DOM | Units | Dist |
|---|---|---|---|---|---|---|---|---|
| 15240 Dayton Hupp Mill Rd Unit A Magalia, CA | 1.0 | 1.0 | 1000 | $1,333 | $1.33 | 21d | 1 | 1.23mi |
Listing history 28 events
-
2026-06-19days on market $132,888 Active 22 DOM
-
2026-06-18days on market $132,888 Active 21 DOM
-
2026-06-17days on market $132,888 Active 20 DOM
-
2026-06-16days on market $132,888 Active 19 DOM
-
2026-06-15days on market $132,888 Active 18 DOM
-
2026-06-14days on market $132,888 Active 16 DOM
-
2026-06-13days on market $132,888 Active 15 DOM
-
2026-06-10days on market $132,888 Active 13 DOM
-
2026-06-09days on market $132,888 Active 12 DOM
-
2026-06-08days on market $132,888 Active 11 DOM
-
2026-06-07days on market $132,888 Active 10 DOM
-
2026-06-05days on market $132,888 Active 7 DOM
-
2026-06-03days on market $132,888 Active 6 DOM
-
2026-06-02days on market $132,888 Active 5 DOM
-
2026-06-01days on market $132,888 Active 4 DOM
-
2026-05-31days on market $132,888 Active 3 DOM
-
2026-05-30days on market $132,888 Active 2 DOM
-
2026-05-28$132,888 Active
-
2026-05-27$132,888 Active
-
2026-05-27historical
-
2025-04-09historical
-
2024-08-23$125,000 Active
-
2006-06-19soldstatus $110,000
-
2006-06-19soldstatus $110,000
-
2006-03-06$119,000
-
1998-09-14soldstatus $34,500
-
1996-09-04soldstatus $40,000
-
1995-07-13soldstatus $20,000
ⓘ Source: listings_history table (triggers on properties + properties_extension) + one-shot
backfill from property_details.listing_events for pre-trigger history.
Tax reassessment forecast CA · Resets to sale price
- Current annual tax
- $632 · $53/mo
- Projected year-2 tax
- $1,010 · $84/mo
- Expected delta
- +$378/yr (+$32/mo · 59.8%)
ⓘ Screening estimate from a state-policy table — verify with the county assessor before closing.
Climate risk First Street
- Flood 9/10 Extreme FEMA zone X (unshaded) · 99% chance over 30 yrs
- Wildfire 7/10 Severe
- Heat 4/10 Moderate 7 d/yr ≥97°F today · 18 d/yr by 30 yrs out
- Wind 1/10 Low
- Air quality 10/10 Extreme 37 unhealthy d/yr today · 42 by 30 yrs out
Nearby sold comps map
Loading sold comps map…
Walkable amenities ~0.75 mi
Loading nearby amenities…
Taxation est. · year 1
- Rental income
- $15,996
- − Mortgage interest
- −$7,444
- − Property taxes
- −$632
- − Insurance
- −$1,462
- − Repairs & maintenance
- −$1,280
- − Management
- −$1,280
- − Depreciation
- −$3,866
- Taxable income
- $33
- Est. tax owed @ 24.0%
- −$8
- After-tax cash flow
- $2,172/yr
For passive investors: Depreciation is non-cash, so a rental often shows a tax loss while cash-flowing — sheltering income. Rental losses are passive: they offset passive income freely, and up to $25,000/yr can offset ordinary (W-2) income if you actively participate and your MAGI is under $100k (phasing out to $0 by $150k); unused losses carry forward. On sale, claimed depreciation is recaptured at up to 25%, and gains may owe capital-gains tax (a 1031 exchange can defer both). Figures are a year-1 estimate at your 24.0% rate — not tax advice; consult a CPA.
Schools (NCES district)
No district data.
Livability — Magalia
- Score
- 51/100
- State rank
- #1094
- US rank
- #25434
Category grades
Schools grade is shown separately in the Schools card above.
Census & demographics
- Census place
- Magalia, CA
- Population (ZIP)
- 8,488
Population outlook (Butte County) Hauer SSP2
- Today (2025)
- 237,527 people
- By 2030
- 243,804 · +2.6%
- By 2040
- 253,899 · +6.9%
- By 2050
- 262,561 · +10.5%
- By 2075
- 283,709 · +19.4%
- By 2100
- 282,689 · +19.0%
Race, ethnicity, and origin ACS 2023
- Neighborhood character
- Predominantly White (78%)
- Race & ethnicity
- White 78% Two or more races 12% Hispanic / Latino 10% Asian 2%
- Hispanic origin (detail)
- Mexican 7%
- Common ancestry
- Portuguese 4% Russian 3% Lithuanian 2%
- Foreign-born
- 4% · Canada, Vietnam, South Korea
- Languages at home
- 94% English-only · Spanish 3% Other Indo-European 1% Vietnamese 1%
Political lean MEDSL · Butte
- 2024 margin
- Toss-up / Even · D 46.8% · R 49.9% · Other 3.3%
- 2008→2024 swing
- -5.5pp toward R · 2008: 2.4pp · 2024: -3.1pp
- All cycles
- 2024: R+3.1 2020: D+1.7 2016: R+4.0 2012: R+3.9 2008: D+2.4
Not yet ingested
- Civics
- —
Market trends
- HPI YoY
- ▼ -83.49%
- Current HPI
- 194.8809
- Rent YoY
- —
- Metro
- —
- State GDP YoY
- ▲ 3.21%
- F500 in state
- 116
Industry mix (Fortune 500 HQ in CA)
| Industry | F500 HQs | Revenue |
|---|---|---|
| Technology | 27 | $1,492B |
|
||
| Financial Services | 3 | $174B |
|
||
| Retail | 3 | $44B |
|
||
| Insurance | 3 | $26B |
|
||
| Media / Entertainment | 2 | $115B |
|
||
| Pharmaceuticals / Biotech | 2 | $62B |
|
||
Price history
+564.4% since first listed11 events — show timeline
- 2026-05-28 Listed $132,888 CRMLS
- 2026-05-27 Listing Removed — CRMLS
- 2026-05-27 Listed $132,888 CRMLS
- 2025-04-09 Listing Removed — CRMLS
- 2024-08-23 Listed $125,000 CRMLS
- 2006-06-19 Sold (Public Records) $110,000 Public Records
- 2006-06-19 Sold (MLS) $110,000 CRMLS
- 2006-03-06 Listed $119,000 CRMLS
- 1998-09-14 Sold (Public Records) $34,500 Public Records
- 1996-09-04 Sold (Public Records) $40,000 Public Records
- 1995-07-13 Sold (Public Records) $20,000 Public Records
Property tax history
+3.3%/yrLatest (2025): $632 · +1.6% YoY. Source: county tax records.
Cash-flow waterfall
monthlySold comps — $/sqft
last 12 mo · ≤1 miLoading sold comps…