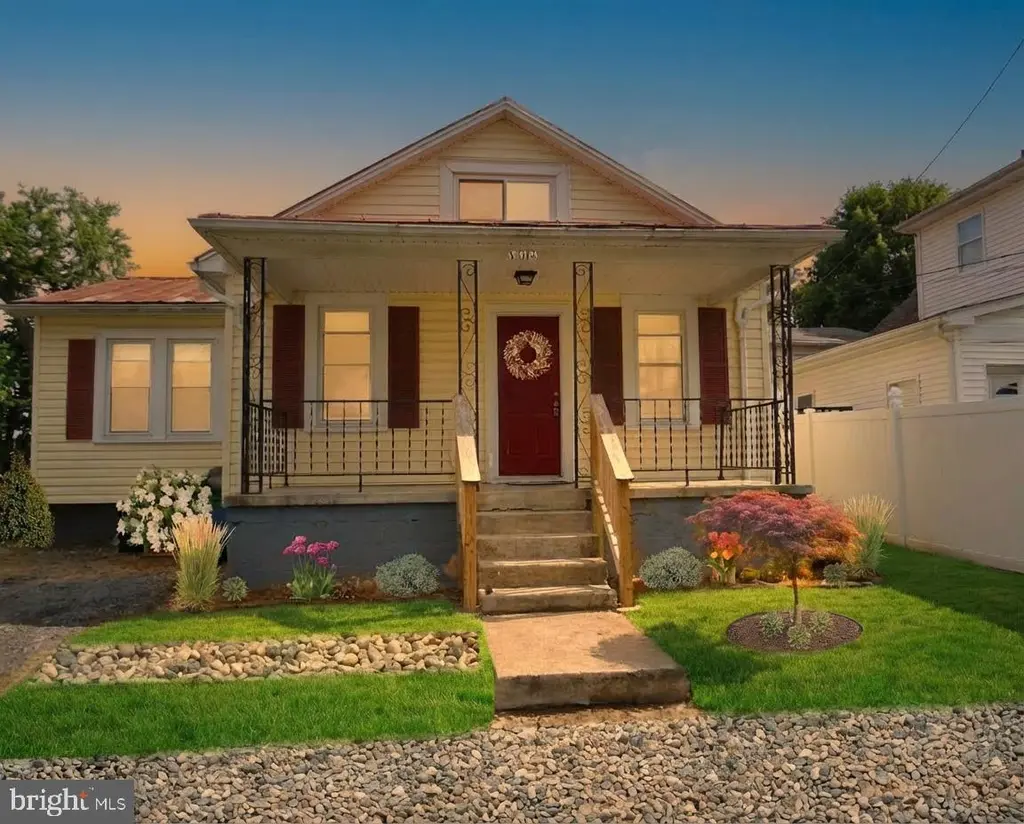
514 Cather Ave · Winchester, VA
Flood risk 6/10 · Moderate
- FEMA flood zone
- X (unshaded)
- Chance of flooding over 30 yrs
- 0.75%
- Est. flood insurance / yr
- $473 – $860
Fire risk 3/10 · Minor
- Est. fire insurance / yr
- $666 – $1,236
Heat risk 6/10 · Moderate
- Hot days now (above 101°F)
- 7 days/yr
- Hot days in 30 yrs
- 16 days/yr
Wind risk 2/10 · Minimal
- Chance of severe wind over 30 yrs
- 1.0%
Air-quality risk 2/10 · Minimal
- Unhealthy air days now
- 0 days/yr
- Unhealthy air days in 30 yrs
- 1 days/yr
Risk factors via First Street. Map © Google.
Why this score? — see what drove the D- grade
The composite is a weighted blend of 9 inputs, each scored 0–100. Each bar is that input's sub-score; the figure is the points it added to the 100-point composite (weight × sub-score).
- ARV discount +12.3/15.0
- Cash flow +8.4/30.0
- Schools +4.8/10.0
- Livability +3.7/5.0
- Rent growth +3.4/5.0
- Condition / age +2.5/5.0
- DSCR +2.3/10.0
- 1% rule +1.7/10.0
- Appreciation +0.0/10.0
$250,000
🖨 Deal sheet (PDF) 📄 Offer letter ✓ Due diligence
Listing remarks
Welcome to this home where classic charm meets modern versatility! Built in 1948, this property offers warmth, character, and flexible living spaces designed to fit today’s lifestyle. Step inside to a spacious main level featuring a bright and inviting family room, a dedicated dining area, and an eat-in kitchen—perfect for everyday living and entertaining. This home offers 3–4 bedroom options, giving you the flexibility to create a home office, playroom, guest space, or additional bedroom to suit your needs. Needs improved and just envision the unlimited possibilities. Updated HVAC and Hot water Heater recently. Ready to move in. Enjoy the convenience of two full bathrooms
Key facts
- 2,657 sq ft lot
- Built 1948
- Listed 40 days
Neighborhood map
What this means for you Summary
Snapshot
- This is a 2-bed/2.0-bath single-family listed at $250k.
Deal economics
- At list price, monthly cash flow is $-223 ($-3k/yr) — negative.
- To cash-flow at today's rent, offer at most $211k (15.8% below list).
- To meet the 1% rule (rent ≥ 1% of price), the offer needs to be $167k (33.1% below list).
- Recommended offer: $167k (33.1% below list) — sets the bar for 1% rule.
- Cap rate 5.2% vs local median 3.0% in Winchester — top-decile yield for the area; either an underpriced asset or a hidden risk that comps aren't pricing in. Stress-test before assuming the spread holds.
Location & tenants
- Location reads 74/100 on livability (#138 in VA, #4,429 nationally) — a middle-class / working-renter tenant base. Strengths: housing A+, health & safety A+, amenities B; Watch: commute F.
- Winchester City Public School District (urban): math 52% / reading 62% proficiency, ranked #73 of 131 in VA (top 56%) — acceptable for families but not a draw, mixed tenant base, ~2y average lease.
- Zoned schools: Frederick Douglass Elementary (math 47% / reading 62%, grade C, #650 of 1,108 statewide, top 62%, 325 students, 82% FRL); Daniel Morgan Middle (math 60% / reading 66%, grade B+, #134 of 342 statewide, top 40%, 613 students, 76% FRL); John Handley High (math 54% / reading 78%, grade B, #200 of 319 statewide, top 64%, 1,384 students, 77% FRL) — zoned schools average 78% FRL vs 52% district-wide (26 pts higher); higher-poverty schools than district average — tighter screening recommended.
- Market conditions: Rents rising (+3.6%/yr); 145 active listings in the ZIP; 17 comparable units currently listed for rent nearby; rentals lingering (median 46d on market — plan ~5-8 weeks vacancy on turnover, expect pricing pressure); 94% of comp listings sitting > 30 days — soft ceiling on asking rent; 91 units permitted in Winchester city in 2024 (52 in 5+ unit buildings).
- This rent runs 31% of the median local income ($64k/yr) — at the standard rent-burdened threshold; future hikes will face affordability resistance.
Forward outlook
- Local home prices are declining (-3.0%/yr); year-one equity from $2k of loan paydown is wiped out by about $8k of value loss. Plan a longer hold.
- Winchester County population projected at +15% by 2050 — modest demand growth; plan on rents tracking national, not racing it.
Negotiation context
- It's been on market 40 days — a 3% lower offer ($242k) is reasonable based on typical stale-listing flexibility.
- 2 sale attempts since 19y ago with the ask held roughly flat each time — persistent listings suggest the price (not the market) is what's stuck; bring a comps-based counter.
Risks & watch-outs
- Watch-outs: built in 1948 — expect roof / HVAC / electrical / plumbing capex.
- Climate carrying-cost: major flood risk; extreme-heat days projected 7→16/yr by 2055 (HVAC capex compounding) — expect insurance premiums to compound above CPI over the hold.
Questions for the listing agent
- What do current leases actually rent for vs. the listed asking? Can we see a recent rent roll and the last 12 months of T-12 income?
- It's been on market 40 days. Have you received any prior offers? Is the seller open to a 33% concession, seller financing, or rate buy-down credit?
- Built in 1948 — when were the roof, HVAC, electrical panel, plumbing, and water heater last replaced?
- Is there a deadline driving the sale (1031 exchange, divorce, estate, relocation)? That informs how much negotiation room exists.
- Schools are A-rated — typically a magnet for longer-tenancy family renters. What's the average tenant stay here, and is there a school-zone premium baked into asking?
- The area grade is low — what's the realistic commute time and amenity access for the typical tenant pool here? Any planned neighborhood developments (good or bad) we should know about?
- What's the average days-on-market for RENTAL listings here right now (not sales)? A rising rental-DOM trend means longer vacancies and softer asking-rent achievability than the comps imply.
- What's the recent tenant-quality profile in this submarket — average credit score on applications, eviction rate, late-payment / NSF rate, and stable-employment percentage? A property-management company in the area should have these aggregated.
- How much new for-sale + rental construction is in the pipeline within 1–3 miles? Heavy new supply typically softens prices + rents 12–24 months out; constrained supply supports both.
Investment metrics
- 1% rule
- 0.67% ✗
- Cap rate
- 5.22%
- Cash-on-cash
- -3.82%
- DSCR
- 0.83
- GRM
- 12.5
CMA / ARV
- ARV (median comp)
- $279,970
- List price
- $250,000
- Delta
- -10.70%
- Verdict
- UNDERPRICED
- Comps
- 20 within 1.0 mi
Show comp detail 4 sales within ~0.75 mi
| Address | Dist | Beds/Ba | Sqft | Sold | Price | $/sf | Match |
|---|---|---|---|---|---|---|---|
| 514 Cather Ave | 0.00mi | 3/2.0 (+1) | 1,008 (0%) | 0mo | $335,000 | $332 | 95 |
| 2301 Tower Ave | 0.35mi | 3/1.0 (+1) | 960 (-5%) | 9mo | $265,000 | $276 | 59 |
| 2617 Cornerstone Cir | 0.67mi | 2/1.5 | 1,012 (+0%) | 12mo | $328,000 | $324 | 56 |
| 2531 Hockman Ave | 0.52mi | 2/1.5 | 1,142 (+13%) | 10mo | $200,000 | $175 | 43 |
Match score weights: distance 35% · size 25% · config 20% · recency 20%. Top-matched comps best support the ARV.
Projected returns pro-forma
-3.0% appreciation · 3.58% rent growth · sell at horizon
- IRR
- -22.2%
- Equity multiple
- 0.23×
- Total profit
- $-53,816
- Equity at exit
- $37,276
- IRR
- -15.2%
- Equity multiple
- 0.12×
- Total profit
- $-61,424
- Equity at exit
- $21,615
Cash invested: $70,000 (down + closing). Projections, not guarantees.
Landlord ↔ Tenant lean methodology
- Overall (STATE)
- 55 Moderately Landlord-Leaning
- State Virginia
- 55 Moderately Landlord-Leaning · D+2
- County
- — inherits STATE
- City
- — inherits STATE
ZIP-level market 22601
- Rents YoY
- 3.6%
- Active inventory
- 145
- Price-to-rent
- 12.5×
Monthly cashflow live
- Estimated rent
- $1,673 high interval (Pro) →
- Mortgage (P&I)
- −$1,311
- Tax from tax record
- −$129 /mo · $1,553/yr
- Insurance
- −$104
- HOA
- −$0
- Vacancy / Maint / Mgmt
- −$351
- Net cashflow
- $-223
Break-even live
Sensitivity live
| Price | -10% $-81 | -5% $-152 | +0% $-223 | +5% $-294 | +10% $-364 |
|---|---|---|---|---|---|
| Rent | -10% $-355 | -5% $-289 | +0% $-223 | +5% $-157 | +10% $-91 |
| Rate | -1.0pp $-97 | -0.5pp $-159 | base $-223 | +0.5pp $-288 | +1.0pp $-354 |
UW: 25.0% down · 7.5% · 30yr · 1.5% tax · 5.0% vac · 8.0% maint · 8.0% mgmt
Financing live
Cash to close
- Down payment
- $62,500
- Closing costs
- $7,500
- Reserves months
- —
- Total cash needed
- —
Loan-product check · same deal, 3 products live
Conventional
25% down · 7.5% · 30yr
- Down + closing
- —
- Monthly P&I
- —
- Monthly cashflow
- —
- DSCR
- —
- Eligible?
- —
Personal DTI + credit; lowest rate.
DSCR
20% down · 8.5% · 30yr
- Down + closing
- —
- Monthly P&I
- —
- Monthly cashflow
- —
- DSCR
- —
- Eligible?
- —
No personal income docs; deal must DSCR.
Hard money
10% down · 12.0% · 12mo
- Down + closing
- —
- Monthly P&I
- —
- Monthly cashflow
- —
- DSCR
- —
- Eligible?
- —
Short-term bridge; refi at stabilization.
Rent comps 17 comps
| Address | Beds | Baths | Sqft | Rent | $/sqft | DOM | Units | Dist |
|---|---|---|---|---|---|---|---|---|
| 1981 Randolph Pl Winchester, VA | 1.0–3.0 | 1.0–2.0 | 1070 | $1,910 | $1.78 | 45d | 7 | 0.28mi |
| 15 Jigsaw Pl Unit 1 Winchester, VA | 3.0 | 1.5 | 1160 | $1,695 | $1.46 | 45d | 1 | 0.38mi |
| 2260 Wilson Blvd Winchester, VA | 2.0 | 1.0 | 802 | $1,620 | $2.02 | 45d | 8 | 0.43mi |
| 2256 Roosevelt Blvd Winchester, VA | 2.0 | 1.0 | 1100 | $1,450 | $1.32 | 45d | 1 | 0.48mi |
| 103 Taft Ave Winchester, VA | 2.0 | 1.0 | 1000 | $1,600 | $1.60 | 45d | 1 | 0.48mi |
| 540 Bellview Ave Winchester, VA | 3.0 | 1.0 | 1280 | $1,850 | $1.45 | 45d | 1 | 0.55mi |
| 2342-2354 Roosevelt Blvd Unit 2352 Winchester, VA | 2.0 | 1.5 | 1100 | $1,550 | $1.41 | 45d | 1 | 0.58mi |
| 105 Lambden Ave Winchester, VA | 2.0 | 1.0 | 800 | $1,295 | $1.62 | 45d | 1 | 0.78mi |
| 230 Spring St Winchester, VA | 1.0–4.0 | 1.0–4.0 | 1042 | $2,433 | $2.33 | 7d | 1 | 1.01mi |
| 2965 Sorrell Ct Winchester, VA | 3.0 | 2.5 | 1280 | $1,700 | $1.33 | 45d | 1 | 1.19mi |
| 2971 Valley Ave Winchester, VA | 1.0 | 1.0 | 750 | $1,900 | $2.53 | 45d | 1 | 1.26mi |
| 702 S Braddock St #2 Winchester, VA | 1.0 | 1.0 | 800 | $1,100 | $1.38 | 45d | 1 | 1.27mi |
| 28 E Pall Mall St Winchester, VA | 2.0 | 2.0 | 1000 | $1,595 | $1.59 | 45d | 1 | 1.30mi |
| 109 E Pall Mall St Winchester, VA | 2.0 | 1.0 | 709 | $1,500 | $2.12 | 45d | 1 | 1.31mi |
| 2 E Germain St Winchester, VA | 2.0 | 1.0 | 950 | $1,400 | $1.47 | 45d | 1 | 1.32mi |
| 112 E Pall Mall St Unit 2 Winchester, VA | 2.0 | 1.0 | 850 | $1,450 | $1.71 | 45d | 1 | 1.32mi |
| 6 E Cecil St Winchester, VA | 2.0 | 1.5 | 1369 | $2,100 | $1.53 | 45d | 1 | 1.48mi |
Listing history 5 events
-
2026-05-11status Pending
-
2026-04-02$250,000 Active
-
2026-03-26historical $250,000
-
2007-04-04historical
-
2007-02-26
ⓘ Source: listings_history table (triggers on properties + properties_extension) + one-shot
backfill from property_details.listing_events for pre-trigger history.
Tax reassessment forecast VA · Resets to sale price
- Current annual tax
- $1,553 · $129/mo
- Projected year-2 tax
- $2,050 · $171/mo
- Expected delta
- +$497/yr (+$41/mo · 32.0%)
ⓘ Screening estimate from a state-policy table — verify with the county assessor before closing.
Climate risk First Street
- Flood 6/10 Major FEMA zone X (unshaded) · 75% chance over 30 yrs
- Wildfire 3/10 Moderate
- Heat 6/10 Major 7 d/yr ≥101°F today · 16 d/yr by 30 yrs out
- Wind 2/10 Low 100% chance of damaging wind over 30 yrs
- Air quality 2/10 Low 0 unhealthy d/yr today · 1 by 30 yrs out
Nearby sold comps map
Loading sold comps map…
Walkable amenities ~0.75 mi
Loading nearby amenities…
Taxation est. · year 1
- Rental income
- $20,076
- − Mortgage interest
- −$14,004
- − Property taxes
- −$1,553
- − Insurance
- −$1,250
- − Repairs & maintenance
- −$1,606
- − Management
- −$1,606
- − Depreciation
- −$7,273
- Taxable loss
- −$7,216
- Est. tax savings @ 24.0%
- +$1,732
- After-tax cash flow
- $-944/yr
For passive investors: Depreciation is non-cash, so a rental often shows a tax loss while cash-flowing — sheltering income. Rental losses are passive: they offset passive income freely, and up to $25,000/yr can offset ordinary (W-2) income if you actively participate and your MAGI is under $100k (phasing out to $0 by $150k); unused losses carry forward. On sale, claimed depreciation is recaptured at up to 25%, and gains may owe capital-gains tax (a 1031 exchange can defer both). Figures are a year-1 estimate at your 24.0% rate — not tax advice; consult a CPA.
Schools (NCES district)
- District
- Winchester City Public School District
- NCES district ID
- 5104050
- Math proficiency
- 52% ▼ -25.00%
- Reading proficiency
- 62% ▼ -5.00%
- Median HH income
- $46,544
- Composite
- 48.23/100
- National rank
- #2164
- State rank
- #73 of 131 in VA
Livability — Winchester
- Score
- 74/100
- State rank
- #138
- US rank
- #4429
Category grades
Schools grade is shown separately in the Schools card above.
Census & demographics
- Census place
- Winchester, VA
- County
- Winchester City · 29,230 people
- City population
- 62,070
- Metro
- Winchester, VA-WV
- Population (ZIP)
- 29,230
- Household income
- $64,258
- Rent vs Own
- Severe rent burden
- 1627.0
Population outlook (Winchester County) Hauer SSP2
- Today (2025)
- 29,693 people
- By 2030
- 30,745 · +3.5%
- By 2040
- 32,619 · +9.9%
- By 2050
- 34,014 · +14.6%
- By 2075
- 35,490 · +19.5%
- By 2100
- 35,424 · +19.3%
Race, ethnicity, and origin ACS 2023
- Neighborhood character
- Diverse neighborhood (Simpson 0.56)
- Race & ethnicity
- White 63% Hispanic / Latino 19% Two or more races 11% Black 10% Asian 2%
- Hispanic origin (detail)
- Mexican 7%
- Common ancestry
- Italian 3% Romanian 2% Lithuanian 2%
- Foreign-born
- 12% · Canada
- Languages at home
- 80% English-only · Spanish 15% French/Haitian/Cajun 1% Other Indo-European 1%
Political lean MEDSL · Winchester
- 2024 margin
- Lean D (+9.8) · D 54.2% · R 44.4% · Other 1.4%
- 2008→2024 swing
- +4.4pp toward D · 2008: 5.4pp · 2024: 9.8pp
- All cycles
- 2024: D+9.8 2020: D+11.5 2016: D+3.5 2012: D+1.4 2008: D+5.4
Not yet ingested
- Civics
- —
Market trends
- HPI YoY
- ▼ -245.80%
- Current HPI
- 297.2882
- Rent YoY
- ▲ 3.58%
- Metro
- Winchester, VA-WV
- State GDP YoY
- ▲ 2.40%
- F500 in state
- 50
Industry mix (Fortune 500 HQ in VA)
| Industry | F500 HQs | Revenue |
|---|---|---|
| Aerospace / Defense | 4 | $236B |
|
||
| Technology / Defense | 3 | $32B |
|
||
| Financial Services | 2 | $176B |
|
||
| Utilities | 2 | $27B |
|
||
| Insurance | 2 | $25B |
|
||
| Technology | 2 | $15B |
|
||
Price history
+0.0% since first listed5 events — show timeline
- 2026-05-11 Pending — BRIGHT MLS
- 2026-04-02 Listed $250,000 BRIGHT MLS
- 2026-03-26 Coming Soon $250,000 BRIGHT MLS
- 2007-04-04 Delisted — MRIS
- 2007-02-26 Listed — MRIS
Property tax history
+4.9%/yrLatest (2025): $1,553 · +9.4% YoY. Source: county tax records.
Cash-flow waterfall
monthlySold comps — $/sqft
last 12 mo · ≤1 miLoading sold comps…