59 Serenity Pl · Charlotte Court House, VA
Flood risk 1/10 · Minimal
- FEMA flood zone
- X (unshaded)
- Chance of flooding over 30 yrs
- 0.0%
- Est. flood insurance / yr
- $507 – $1,088
Fire risk 4/10 · Minor
- Est. fire insurance / yr
- $666 – $1,236
Heat risk 6/10 · Moderate
- Hot days now (above 104°F)
- 7 days/yr
- Hot days in 30 yrs
- 17 days/yr
Wind risk 4/10 · Minor
- Chance of severe wind over 30 yrs
- 10.0%
Air-quality risk 1/10 · Minimal
- Unhealthy air days now
- 0 days/yr
- Unhealthy air days in 30 yrs
- 0 days/yr
Risk factors via First Street. Map © Google.
Why this score? — see what drove the D grade
The composite is a weighted blend of 9 inputs, each scored 0–100. Each bar is that input's sub-score; the figure is the points it added to the 100-point composite (weight × sub-score).
- Appreciation +10.0/10.0
- Cash flow +8.4/30.0
- ARV discount +7.5/15.0
- Livability +3.7/5.0
- Schools +3.0/10.0
- Rent growth +2.5/5.0
- Condition / age +2.5/5.0
- DSCR +2.3/10.0
- 1% rule +1.5/10.0
$179,000
🖨 Deal sheet (PDF) 📄 Offer letter ✓ Due diligence
Listing remarks
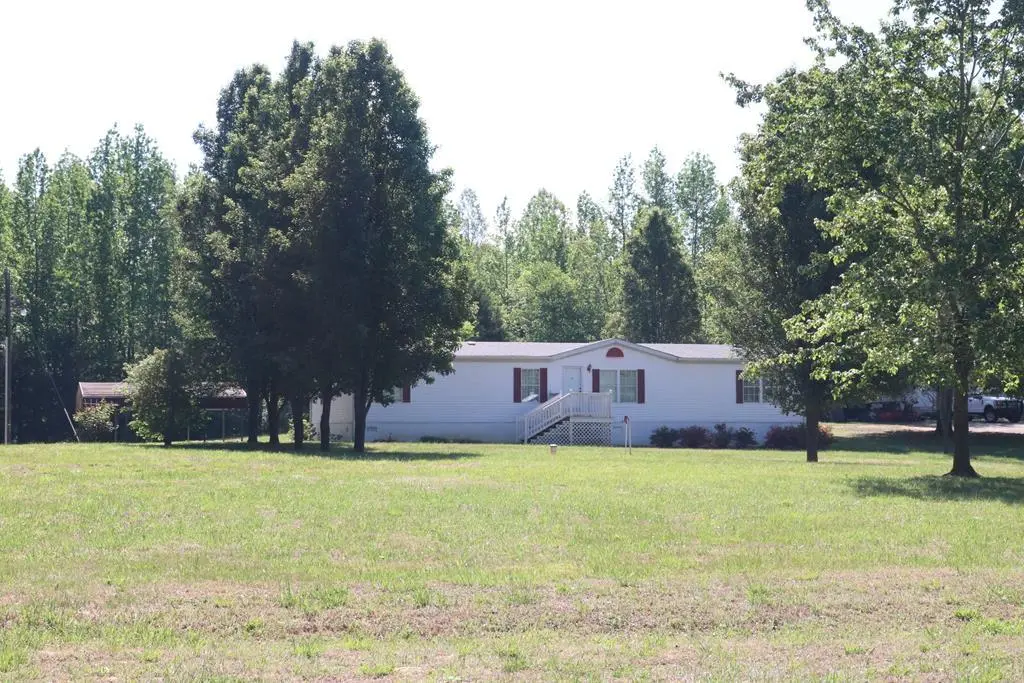
Well-kept home that is ready for a new owner. Offering 4 bedrooms with two full baths. Livingroom, family room and eat-in kitchen. Nice layout for a large family. Two sheds that will convey as well as all major appliances. Approx. 2 +/- open acres, plenty of room for a garden or adding a garage.
Key facts
- Major appliances
- Open acres
- Room for a garden
Tags
Property features AI
Exterior
- Parking: Gravel parking
- Utilities: Private well water; Septic tank sewer
- Home design: Residential property; 2-acre lot
- Construction: Vinyl siding
- Exterior features: Composition roof
Interior
- Bathrooms: 2 full bathrooms
- Heating & cooling: Heat pump heating; Has heating
- Interior features: Storm windows
Neighborhood map
What this means for you Summary
Snapshot
- This is a 3-bed/2.0-bath manufactured listed at $179k.
Deal economics
- At list price, monthly cash flow is $-161 ($-2k/yr) — negative.
- To cash-flow at today's rent, offer at most $151k (15.9% below list).
- To meet the 1% rule (rent ≥ 1% of price), the offer needs to be $116k (35.4% below list).
- Recommended offer: $116k (35.4% below list) — sets the bar for 1% rule.
Location & tenants
- Location reads 74/100 on livability (#143 in VA, #4,687 nationally) — a middle-class / working-renter tenant base. Strengths: cost of living A+, housing A+, health & safety A+; Watch: crime C-, amenities F, commute F.
- Prince Edward County Public School District (town): math 25% / reading 48% proficiency, ranked #126 of 131 in VA (top 96%) — families likely to look elsewhere, expect single-tenant / working-renter base with shorter leases; 65% free/reduced lunch — lower-income household profile, screen leases tightly.
- Zoned schools: Prince Edward Elementary (math 33% / reading 40%, grade F, #953 of 1,108 statewide, top 86%, 808 students, 100% FRL); Prince Edward Middle (math 23% / reading 47%, grade F, #327 of 342 statewide, top 96%, 544 students, 98% FRL); Prince Edward County High (math 22% / reading 67%, grade F, #310 of 319 statewide, top 98%, 535 students, 101% FRL) — zoned schools average 99% FRL vs 65% district-wide (34 pts higher); higher-poverty schools than district average — tighter screening recommended.
- Market conditions: 19 active listings in the ZIP; 65 units permitted in Prince Edward County in 2024 (5 in 5+ unit buildings).
Forward outlook
- In year one you build about $19k of equity ($1k loan paydown + $18k appreciation (10.0% local appreciation)).
- Prince Edward County population projected to shrink 9% by 2050 — rents likely to lag national; underwrite the cash flow, not the appreciation.
- By year 2, paydown + projected appreciation supports a ~$31k cash-out refi (75% LTV) — recoverable capital for the next deal without selling this one.
Negotiation context
- Only 7 days on market — expect competitive offers; lowballing is unlikely to land.
Risks & watch-outs
- Climate carrying-cost: extreme-heat days projected 7→17/yr by 2055 (HVAC capex compounding) — expect insurance premiums to compound above CPI over the hold.
Questions for the listing agent
- What do current leases actually rent for vs. the listed asking? Can we see a recent rent roll and the last 12 months of T-12 income?
- Is there a deadline driving the sale (1031 exchange, divorce, estate, relocation)? That informs how much negotiation room exists.
- Schools are B-rated — typically a magnet for longer-tenancy family renters. What's the average tenant stay here, and is there a school-zone premium baked into asking?
- The area grade is low — what's the realistic commute time and amenity access for the typical tenant pool here? Any planned neighborhood developments (good or bad) we should know about?
- What's the average days-on-market for RENTAL listings here right now (not sales)? A rising rental-DOM trend means longer vacancies and softer asking-rent achievability than the comps imply.
- What's the recent tenant-quality profile in this submarket — average credit score on applications, eviction rate, late-payment / NSF rate, and stable-employment percentage? A property-management company in the area should have these aggregated.
- How much new for-sale + rental construction is in the pipeline within 1–3 miles? Heavy new supply typically softens prices + rents 12–24 months out; constrained supply supports both.
Investment metrics
- 1% rule
- 0.65% ✗
- Cap rate
- 5.21%
- Cash-on-cash
- -3.85%
- DSCR
- 0.83
- GRM
- 12.9
CMA / ARV
No comps found within radius.
Projected returns pro-forma
10.0% appreciation · 3.0% rent growth · sell at horizon
- IRR
- 21.5%
- Equity multiple
- 2.74×
- Total profit
- $87,160
- Equity at exit
- $161,257
- IRR
- 19.4%
- Equity multiple
- 6.28×
- Total profit
- $264,564
- Equity at exit
- $347,758
Cash invested: $50,120 (down + closing). Projections, not guarantees.
Landlord ↔ Tenant lean methodology
- Overall (STATE)
- 55 Moderately Landlord-Leaning
- State Virginia
- 55 Moderately Landlord-Leaning · D+2
- County
- — inherits STATE
- City
- — inherits STATE
ZIP-level market 23923
- Home prices YoY
- 5.7%
- Active inventory
- 19
- Price-to-rent
- 12.9×
Monthly cashflow live
- Estimated rent
- $1,156 medium interval (Pro) →
- Mortgage (P&I)
- −$939
- Tax from tax record
- −$60 /mo · $726/yr
- Insurance
- −$75
- HOA
- −$0
- Vacancy / Maint / Mgmt
- −$243
- Net cashflow
- $-161
Break-even live
Sensitivity live
| Price | -10% $-60 | -5% $-110 | +0% $-161 | +5% $-212 | +10% $-262 |
|---|---|---|---|---|---|
| Rent | -10% $-252 | -5% $-207 | +0% $-161 | +5% $-115 | +10% $-70 |
| Rate | -1.0pp $-71 | -0.5pp $-115 | base $-161 | +0.5pp $-207 | +1.0pp $-254 |
UW: 25.0% down · 7.5% · 30yr · 1.5% tax · 5.0% vac · 8.0% maint · 8.0% mgmt
Financing live
Cash to close
- Down payment
- $44,750
- Closing costs
- $5,370
- Reserves months
- —
- Total cash needed
- —
Loan-product check · same deal, 3 products live
Conventional
25% down · 7.5% · 30yr
- Down + closing
- —
- Monthly P&I
- —
- Monthly cashflow
- —
- DSCR
- —
- Eligible?
- —
Personal DTI + credit; lowest rate.
DSCR
20% down · 8.5% · 30yr
- Down + closing
- —
- Monthly P&I
- —
- Monthly cashflow
- —
- DSCR
- —
- Eligible?
- —
No personal income docs; deal must DSCR.
Hard money
10% down · 12.0% · 12mo
- Down + closing
- —
- Monthly P&I
- —
- Monthly cashflow
- —
- DSCR
- —
- Eligible?
- —
Short-term bridge; refi at stabilization.
Listing history 2 events
-
2026-05-04status Pending 296-char remark
-
2026-04-27$179,000 Active 296-char remark
ⓘ Source: listings_history table (triggers on properties + properties_extension) + one-shot
backfill from property_details.listing_events for pre-trigger history.
Tax reassessment forecast VA · Resets to sale price
- Current annual tax
- $726 · $60/mo
- Projected year-2 tax
- $1,468 · $122/mo
- Expected delta
- +$742/yr (+$62/mo · 102.3%)
ⓘ Screening estimate from a state-policy table — verify with the county assessor before closing.
Climate risk First Street
- Flood 1/10 Low FEMA zone X (unshaded) · 0% chance over 30 yrs
- Wildfire 4/10 Moderate
- Heat 6/10 Major 7 d/yr ≥104°F today · 17 d/yr by 30 yrs out
- Wind 4/10 Moderate 10% chance of damaging wind over 30 yrs
- Air quality 1/10 Low 0 unhealthy d/yr today · 0 by 30 yrs out
Nearby sold comps map
Loading sold comps map…
Walkable amenities ~0.75 mi
Loading nearby amenities…
Taxation est. · year 1
- Rental income
- $13,867
- − Mortgage interest
- −$10,027
- − Property taxes
- −$726
- − Insurance
- −$895
- − Repairs & maintenance
- −$1,109
- − Management
- −$1,109
- − Depreciation
- −$5,207
- Taxable loss
- −$5,207
- Est. tax savings @ 24.0%
- +$1,250
- After-tax cash flow
- $-681/yr
For passive investors: Depreciation is non-cash, so a rental often shows a tax loss while cash-flowing — sheltering income. Rental losses are passive: they offset passive income freely, and up to $25,000/yr can offset ordinary (W-2) income if you actively participate and your MAGI is under $100k (phasing out to $0 by $150k); unused losses carry forward. On sale, claimed depreciation is recaptured at up to 25%, and gains may owe capital-gains tax (a 1031 exchange can defer both). Figures are a year-1 estimate at your 24.0% rate — not tax advice; consult a CPA.
Schools (NCES district)
- District
- Prince Edward County Public School District
- NCES district ID
- 5103060
- Math proficiency
- 25% ▼ -37.00%
- Reading proficiency
- 48% ▼ -12.00%
- Median HH income
- $39,482
- Composite
- 30.49/100
- National rank
- #6221
- State rank
- #126 of 131 in VA
Livability — Charlotte Court House
- Score
- 74/100
- State rank
- #143
- US rank
- #4687
Category grades
Schools grade is shown separately in the Schools card above.
Census & demographics
- Population (ZIP)
- 2,395
Population outlook (Prince Edward County) Hauer SSP2
- Today (2025)
- 24,387 people
- By 2030
- 24,161 · -0.9%
- By 2040
- 23,194 · -4.9%
- By 2050
- 22,292 · -8.6%
- By 2075
- 20,854 · -14.5%
- By 2100
- 19,030 · -22.0%
Race, ethnicity, and origin ACS 2023
- Neighborhood character
- Diverse neighborhood (Simpson 0.56)
- Race & ethnicity
- White 61% Black 23% Hispanic / Latino 10% Two or more races 6%
- Hispanic origin (detail)
- Puerto Rican 9%
- Common ancestry
- Italian 4% Lithuanian 3% Iranian 1%
- Foreign-born
- 1% · Canada
- Languages at home
- 97% English-only · German/W. Germanic 1% French/Haitian/Cajun 1% Spanish 1%
Political lean MEDSL · Prince Edward
- 2024 margin
- Toss-up / Even · D 48.2% · R 50.7% · Other 1.1%
- 2008→2024 swing
- -12.5pp toward R · 2008: 9.9pp · 2024: -2.6pp
- All cycles
- 2024: R+2.6 2020: D+5.6 2016: D+5.4 2012: D+12.8 2008: D+9.9
Not yet ingested
- Civics
- —
Market trends
- HPI YoY
- ▲ 11.06%
- Current HPI
- 205.1735
- Rent YoY
- —
- Metro
- —
- State GDP YoY
- ▲ 2.40%
- F500 in state
- 50
Industry mix (Fortune 500 HQ in VA)
| Industry | F500 HQs | Revenue |
|---|---|---|
| Aerospace / Defense | 4 | $236B |
|
||
| Technology / Defense | 3 | $32B |
|
||
| Financial Services | 2 | $176B |
|
||
| Utilities | 2 | $27B |
|
||
| Insurance | 2 | $25B |
|
||
| Technology | 2 | $15B |
|
||
Price history
+0.0% since first listed3 events — show timeline
- 2026-06-05 Sold (MLS) $179,000 SCAR
- 2026-05-04 Pending — SCAR
- 2026-04-27 Listed $179,000 SCAR
Property tax history
+4.5%/yrLatest (2025): $726 · +19.3% YoY. Source: county tax records.
Cash-flow waterfall
monthlySold comps — $/sqft
last 12 mo · ≤1 miLoading sold comps…