 🏗️ New Construction
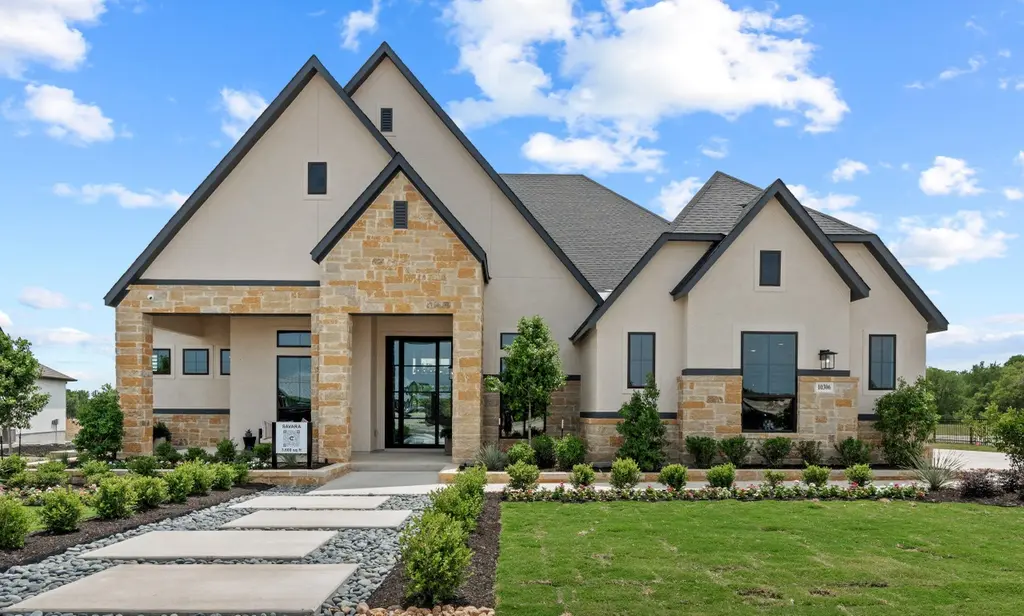
Savara Plan · Castroville, TX
Flood risk 1/10 · Minimal
- FEMA flood zone
- X (unshaded)
- Chance of flooding over 30 yrs
- 0.0%
- Est. flood insurance / yr
- $507 – $1,088
Fire risk 5/10 · Moderate
- Est. fire insurance / yr
- $1,222 – $2,270
Heat risk 7/10 · Major
- Hot days now (above 108°F)
- 6 days/yr
- Hot days in 30 yrs
- 19 days/yr
Wind risk 6/10 · Moderate
- Chance of severe wind over 30 yrs
- 70.0%
Air-quality risk 2/10 · Minimal
- Unhealthy air days now
- 0 days/yr
- Unhealthy air days in 30 yrs
- 1 days/yr
Risk factors via First Street. Map © Google.
Why this score? — see what drove the D grade
The composite is a weighted blend of 9 inputs, each scored 0–100. Each bar is that input's sub-score; the figure is the points it added to the 100-point composite (weight × sub-score).
- Cash flow +13.5/30.0
- ARV discount +7.5/15.0
- Schools +4.4/10.0
- DSCR +4.1/10.0
- Condition / age +4.0/5.0
- 1% rule +3.8/10.0
- Livability +3.7/5.0
- Rent growth +2.5/5.0
- Appreciation +0.0/10.0
$717,990
🖨 Deal sheet 📄 Offer letter ✓ Due diligence
Listing remarks
Step into this stunning single-story home, where a dramatic foyer with arched openings and tray ceilings welcomes you with a versatile flex room, elegant formal living and dining areas, as well as a spacious family room. The family room boasts soaring ceilings adorned with tray details and cross beams, while expansive plate glass windows and transom windows frame the double glass doors that lead to a generous covered patio. The modern, open kitchen is a chef's dream, featuring a large designer island with seating, ample cabinet storage, and an oversized walk-in pantry.
Key facts
- Formal living areas
- Soaring ceilings
- Formal dining areas
Tags
Property features AI
Finance
- Other: Located at 100 Grace Ave, Castroville, TX 78009; Currently active listing
- Financial info:
- HOA & community:
Exterior
- Parking: 3 parking spaces
- Security:
- Utilities:
- Home design: New construction, Savara plan
- Construction:
- Exterior features: Living area of 3,600 (plan measurement)
Interior
- Kitchen:
- Bedrooms: 4 bedrooms
- Flooring:
- Bathrooms: 4 full bathrooms and 1 half bathroom
- Heating & cooling:
- Interior features: Open living areas (plan-based new construction)
- Laundry & utility:
Neighborhood map
What this means for you Summary
Snapshot
- This is a 4-bed/4.5-bath single-family listed at $718k. Condition is rated good.
Deal economics
- At list price, monthly cash flow is $24 ($282/yr) — positive.
- To cash-flow at today's rent, offer at most $716k (0.3% below list).
- To meet the 1% rule (rent ≥ 1% of price), the offer needs to be $626k (12.8% below list).
- Recommended offer: $626k (12.8% below list) — sets the bar for 1% rule.
- Cap rate 6.3% vs local median 2.7% in Castroville — top-decile yield for the area; either an underpriced asset or a hidden risk that comps aren't pricing in. Stress-test before assuming the spread holds.
Location & tenants
- Location reads 73/100 on livability (#212 in TX) — a middle-class / working-renter tenant base. Strengths: cost of living A+, housing A+, crime B; Watch: health & safety D+, amenities F, commute F.
- Medina Valley ISD (rural): math 48% / reading 53% proficiency, ranked #148 of 826 in TX (top 18%) — acceptable for families but not a draw, mixed tenant base, ~2y average lease.
- Market conditions: 441 active listings in the ZIP; 4 comparable units currently listed for rent nearby; rentals lingering (median 44d on market — plan ~5-8 weeks vacancy on turnover, expect pricing pressure); 50% of comp listings sitting > 30 days — soft ceiling on asking rent; 102 units permitted in Medina County in 2024 (0 in 5+ unit buildings).
Forward outlook
- Local home prices are declining (-3.0%/yr); year-one equity from $5k of loan paydown is wiped out by about $21k of value loss. Plan a longer hold.
- Medina County population projected at +24% by 2050 — long-run rental-demand tailwind backs the buy-and-hold thesis.
Negotiation context
- It's been on market 34 days — a 3% lower offer ($696k) is reasonable based on typical stale-listing flexibility.
Risks & watch-outs
- Climate carrying-cost: major wind risk, 70% chance of damaging wind over 30y; moderate wildfire risk; extreme-heat days projected 6→19/yr by 2055 (HVAC capex compounding) — expect insurance premiums to compound above CPI over the hold.
Questions for the listing agent
- It's been on market 34 days. Have you received any prior offers? Is the seller open to a 13% concession, seller financing, or rate buy-down credit?
- Is there a deadline driving the sale (1031 exchange, divorce, estate, relocation)? That informs how much negotiation room exists.
- The area grade is low — what's the realistic commute time and amenity access for the typical tenant pool here? Any planned neighborhood developments (good or bad) we should know about?
- What's the average days-on-market for RENTAL listings here right now (not sales)? A rising rental-DOM trend means longer vacancies and softer asking-rent achievability than the comps imply.
- What's the recent tenant-quality profile in this submarket — average credit score on applications, eviction rate, late-payment / NSF rate, and stable-employment percentage? A property-management company in the area should have these aggregated.
- How much new for-sale + rental construction is in the pipeline within 1–3 miles? Heavy new supply typically softens prices + rents 12–24 months out; constrained supply supports both.
Investment metrics
- 1% rule
- 0.88% ✗
- Cap rate
- 6.33%
- Cash-on-cash
- 0.14%
- DSCR
- 1.01
- GRM
- 9.5
CMA / ARV
- ARV (median comp)
- $712,559
- List price
- $717,990
- Delta
- 0.76%
- Verdict
- FAIR
- Comps
- 20 within 1.0 mi
Show comp detail 12 sales within ~0.75 mi
| Address | Dist | Beds/Ba | Sqft | Sold | Price | $/sf | Match |
|---|---|---|---|---|---|---|---|
| 210 Landon Path | 0.32mi | 4/3.5 | 3,747 (+4%) | 2mo | $794,800 | $212 | 72 |
| 534 Englewood | 0.39mi | 4/3.5 | 3,568 (-1%) | 6mo | $669,990 | $188 | 72 |
| 287 Poe Pkwy | 0.54mi | 4/3.5 | 3,568 (-1%) | 7mo | $669,990 | $188 | 64 |
| 183 Poe Pkwy | 0.43mi | 5/3.5 (+1) | 3,716 (+3%) | 4mo | $639,990 | $172 | 62 |
| 264 Storm Way | 0.71mi | 4/3.5 | 3,568 (-1%) | 1mo | $695,990 | $195 | 60 |
| 250 Matthew Path | 0.48mi | 4/3.5 | 3,325 (-8%) | 1mo | $699,900 | $210 | 60 |
| 239 Sittre Dr | 0.59mi | 4/3.0 | 3,324 (-8%) | 0mo | $635,000 | $191 | 53 |
| 222 Raven Rd | 0.64mi | 5/4.5 (+1) | 3,885 (+8%) | 2mo | $912,151 | $235 | 50 |
| 411 Poe Pkwy | 0.66mi | 4/3.5 | 3,822 (+6%) | 8mo | $809,800 | $212 | 48 |
| 235 Poe | 0.48mi | 4/3.5 | 3,101 (-14%) | 5mo | $599,900 | $193 | 46 |
| 247 Storm Way | 0.69mi | 5/5.5 (+1) | 3,800 (+6%) | 8mo | $779,800 | $205 | 43 |
| 267 Sweet Rose | 0.72mi | 4/3.5 | 3,094 (-14%) | 1mo | $549,000 | $177 | 38 |
Match score weights: distance 35% · size 25% · config 20% · recency 20%. Top-matched comps best support the ARV.
Projected returns pro-forma
-3.0% appreciation · 3.0% rent growth · sell at horizon
- IRR
- -16.1%
- Equity multiple
- 0.43×
- Total profit
- $-113,872
- Equity at exit
- $106,245
- IRR
- -7.7%
- Equity multiple
- 0.51×
- Total profit
- $-96,845
- Equity at exit
- $61,609
Cash invested: $199,516 (down + closing). Projections, not guarantees.
Landlord ↔ Tenant lean methodology
- Overall (STATE)
- 87 Strongly Landlord-Friendly
- State Texas
- 87 Strongly Landlord-Friendly · R+5
- County
- — inherits STATE
- City
- — inherits STATE
ZIP-level market 78009
- Home prices YoY
- -21.1%
- Active inventory
- 441
- Price-to-rent
- 9.6×
Monthly cashflow live
- Estimated rent
- $6,263 medium interval (Pro) →
- Mortgage (P&I)
- −$3,737
- Tax est. 1.5%
- −$891 /mo · $10,688/yr
- Insurance
- −$297
- HOA
- −$0
- Vacancy / Maint / Mgmt
- −$1,315
- Net cashflow
- $24
Break-even live
UW: 25.0% down · 7.5% · 30yr · 1.5% tax · 5.0% vac · 8.0% maint · 8.0% mgmt
Financing live
Cash to close
- Down payment
- $178,140
- Closing costs
- $21,377
- Reserves months
- —
- Total cash needed
- —
Loan-product check · same deal, 3 products live
Conventional
25% down · 7.5% · 30yr
- Down + closing
- —
- Monthly P&I
- —
- Monthly cashflow
- —
- DSCR
- —
- Eligible?
- —
Personal DTI + credit; lowest rate.
DSCR
20% down · 8.5% · 30yr
- Down + closing
- —
- Monthly P&I
- —
- Monthly cashflow
- —
- DSCR
- —
- Eligible?
- —
No personal income docs; deal must DSCR.
Hard money
10% down · 12.0% · 12mo
- Down + closing
- —
- Monthly P&I
- —
- Monthly cashflow
- —
- DSCR
- —
- Eligible?
- —
Short-term bridge; refi at stabilization.
Rent comps 4 comps
| Address | Beds | Baths | Sqft | Rent | $/sqft | DOM | Units | Dist |
|---|---|---|---|---|---|---|---|---|
| 268 Englewood Ln Castroville, TX | 5.0 | 4.5 | 4022 | $7,200 | $1.79 | 4d | 1 | 0.12mi |
| 270 Lilly Blf Castroville, TX | 4.0 | 3.0 | 2958 | $3,600 | $1.22 | 43d | 1 | 0.88mi |
| 252 Elisabeth Run San Antonio, TX | 5.0 | 2.5 | 2614 | $1,995 | $0.76 | 44d | 1 | 1.36mi |
| 206 Nesting Cyn San Antonio, TX | 4.0 | 2.5 | 2492 | $1,741 | $0.70 | 4d | 1 | 1.45mi |
Listing history 14 events
-
2026-06-18days on market $717,990 Active 34 DOM
-
2026-06-17days on market $717,990 Active 33 DOM
-
2026-06-16days on market $717,990 Active 32 DOM
-
2026-06-15days on market $717,990 Active 31 DOM
-
2026-06-13days on market $717,990 Active 29 DOM
-
2026-06-09days on market $717,990 Active 25 DOM
-
2026-06-08days on market $717,990 Active 24 DOM
-
2026-06-07days on market $717,990 Active 23 DOM
-
2026-06-04days on market $717,990 Active 20 DOM
-
2026-06-03days on market $717,990 Active 19 DOM
-
2026-06-02days on market $717,990 Active 18 DOM
-
2026-06-02days on market $717,990 Active 17 DOM
-
2026-05-31days on market $717,990 Active 16 DOM
-
2026-05-15$717,990 Active 575-char remark
ⓘ Source: listings_history table (triggers on properties + properties_extension) + one-shot
backfill from property_details.listing_events for pre-trigger history.
Climate risk First Street
- Flood 1/10 Low FEMA zone X (unshaded) · 0% chance over 30 yrs
- Wildfire 5/10 Major
- Heat 7/10 Severe 6 d/yr ≥108°F today · 19 d/yr by 30 yrs out
- Wind 6/10 Major 70% chance of damaging wind over 30 yrs
- Air quality 2/10 Low 0 unhealthy d/yr today · 1 by 30 yrs out
Nearby sold comps map
Loading sold comps map…
Walkable amenities ~0.75 mi
Loading nearby amenities…
Taxation est. · year 1
- Rental income
- $75,157
- − Mortgage interest
- −$39,914
- − Property taxes
- −$10,688
- − Insurance
- −$3,563
- − Repairs & maintenance
- −$6,013
- − Management
- −$6,013
- − Depreciation
- −$20,729
- Taxable loss
- −$11,762
- Est. tax savings @ 24.0%
- +$2,823
- After-tax cash flow
- $3,105/yr
For passive investors: Depreciation is non-cash, so a rental often shows a tax loss while cash-flowing — sheltering income. Rental losses are passive: they offset passive income freely, and up to $25,000/yr can offset ordinary (W-2) income if you actively participate and your MAGI is under $100k (phasing out to $0 by $150k); unused losses carry forward. On sale, claimed depreciation is recaptured at up to 25%, and gains may owe capital-gains tax (a 1031 exchange can defer both). Figures are a year-1 estimate at your 24.0% rate — not tax advice; consult a CPA.
Condition & rehab AI · 2 photos
This single-story home in Castroville, TX, is in good condition with a modern kitchen, spacious living areas, and a well-maintained exterior. It is ready for move-in and would benefit from a fresh coat of paint and landscaping improvements to further enhance its value.
Value-add opportunities
- Both Painting the exterior and interior walls — Fresh paint can enhance curb appeal and interior aesthetics.
- Both Landscaping improvements — Enhanced landscaping can improve curb appeal and attract more potential buyers/tenants.
- Rental HVAC maintenance — A well-maintained HVAC system ensures comfort and reduces utility costs for tenants.
Renovation cost estimate screening
Value-add ROI direction
- Both Painting the exterior and interior walls — Fresh paint can enhance curb appeal and interior aesthetics. ↑
- Both Landscaping improvements — Enhanced landscaping can improve curb appeal and attract more potential buyers/tenants. ↑
- Rental HVAC maintenance — A well-maintained HVAC system ensures comfort and reduces utility costs for tenants. ↑
ⓘ Cost ranges are severity-bucket heuristics (US national rule-of-thumb). Get contractor quotes + a written scope before underwriting a rehab budget.
Schools (NCES district)
- District
- Medina Valley ISD
- NCES district ID
- 4830060
- Math proficiency
- 48% ▼ -9.00%
- Reading proficiency
- 53% ▼ -2.00%
- Median HH income
- $60,596
- Composite
- 44.2/100
- National rank
- #2851
- State rank
- #148 of 826 in TX
Livability — Castroville
- Score
- 73/100
- State rank
- #212
- US rank
- #5267
Category grades
Schools grade is shown separately in the Schools card above.
Census & demographics
- Population (ZIP)
- 9,494
Population outlook (Medina County) Hauer SSP2
- Today (2025)
- 54,332 people
- By 2030
- 57,250 · +5.4%
- By 2040
- 62,563 · +15.1%
- By 2050
- 67,386 · +24.0%
- By 2075
- 79,538 · +46.4%
- By 2100
- 84,624 · +55.8%
Race, ethnicity, and origin ACS 2023
- Neighborhood character
- Diverse neighborhood (Simpson 0.60)
- Race & ethnicity
- Hispanic / Latino 52% White 37% Two or more races 29% Black 4% Asian 3% Native American 1%
- Hispanic origin (detail)
- Mexican 41% Puerto Rican 3%
- Common ancestry
- Albanian 6% Lithuanian 5% Slovak 2%
- Foreign-born
- 9% · Canada
- Languages at home
- 74% English-only · Spanish 24% Other Indo-European 1%
Political lean MEDSL · Medina
- 2024 margin
- Solid R (+42.8) · D 28.2% · R 71.0%
- 2008→2024 swing
- -8.9pp toward R · 2008: -33.9pp · 2024: -42.8pp
- All cycles
- 2024: R+42.8 2020: R+39.2 2016: R+43.2 2012: R+39.2 2008: R+33.9
Not yet ingested
- Civics
- —
Market trends
- HPI YoY
- ▼ -56.81%
- Current HPI
- 212.1813
- Rent YoY
- —
- Metro
- —
- State GDP YoY
- ▲ 3.95%
- F500 in state
- 110
Industry mix (Fortune 500 HQ in TX)
| Industry | F500 HQs | Revenue |
|---|---|---|
| Energy | 16 | $1,198B |
|
||
| Technology | 5 | $198B |
|
||
| Engineering / Construction | 4 | $72B |
|
||
| Energy Services | 3 | $60B |
|
||
| Utilities | 3 | $41B |
|
||
| Healthcare | 2 | $330B |
|
||
Cash-flow waterfall
monthlySold comps — $/sqft
last 12 mo · ≤1 miLoading sold comps…