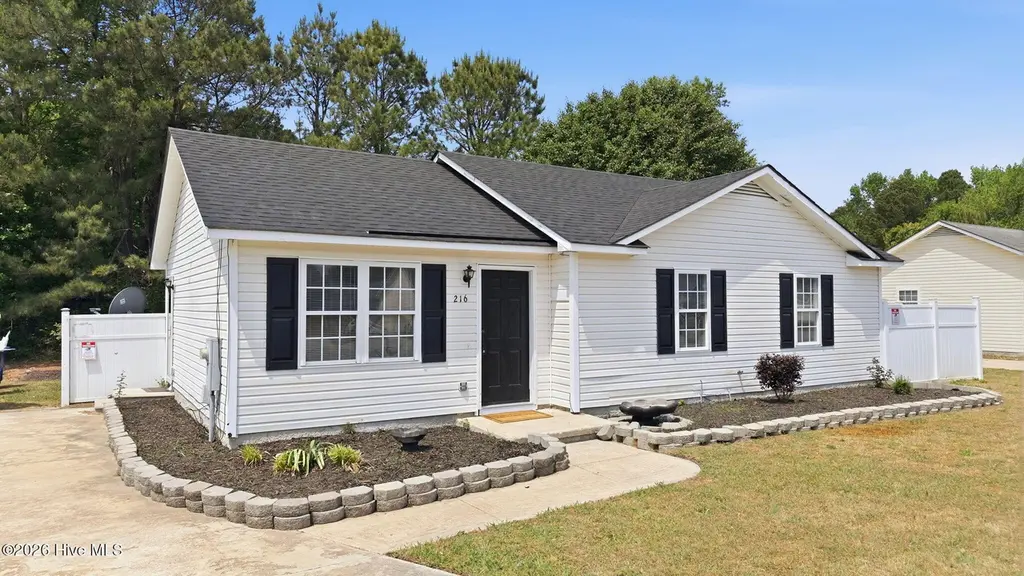
216 Katie Dr · Sharpsburg, NC
Flood risk 1/10 · Minimal
- FEMA flood zone
- X (unshaded)
- Chance of flooding over 30 yrs
- 0.0%
- Est. flood insurance / yr
- $507 – $1,088
Fire risk 4/10 · Minor
- Est. fire insurance / yr
- $906 – $1,684
Heat risk 7/10 · Major
- Hot days now (above 107°F)
- 7 days/yr
- Hot days in 30 yrs
- 16 days/yr
Wind risk 7/10 · Major
- Chance of severe wind over 30 yrs
- 78.0%
Air-quality risk 2/10 · Minimal
- Unhealthy air days now
- 1 days/yr
- Unhealthy air days in 30 yrs
- 2 days/yr
Risk factors via First Street. Map © Google.
Why this score? — see what drove the D grade
The composite is a weighted blend of 9 inputs, each scored 0–100. Each bar is that input's sub-score; the figure is the points it added to the 100-point composite (weight × sub-score).
- Cash flow +13.4/30.0
- ARV discount +11.6/15.0
- DSCR +4.0/10.0
- Rent growth +3.9/5.0
- 1% rule +3.5/10.0
- Livability +2.9/5.0
- Condition / age +2.5/5.0
- Schools +2.0/10.0
- Appreciation +0.0/10.0
$159,900
🖨 Deal sheet 📄 Offer letter ✓ Due diligence
Listing remarks MLS
USDA Eligible! This charming 3 bedroom, 2 full bath ranch style home in Sharpsburg is ready for you! Upgrades include paint throughout, new shingles, luxury vinyl plank flooring, and HVAC. Tucked away in a low traffic neighborhood, this home is still an easy drive to amenities in either Rocky Mount or Wilson. Make this one yours today!
Key facts
- Hvac
- New shingles
- 9,583 sq ft lot
Tags
Property features AI
Finance
- Other: Lot approximately 0.22 acres
- Financial info: Annual tax amount listed
- HOA & community: No homeowners association
Exterior
- Utilities: Public water; Public sewer
- Home design: One-story house
- Construction: Vinyl siding; Shingle roof; Slab foundation; Built as a house
- Exterior features: Public maintained road access
Interior
- Bedrooms: 3 bedrooms (all on the main level)
- Flooring: Vinyl
- Bathrooms: 2 full bathrooms
- Heating & cooling: Central heating; Central air conditioning
- Interior features: Vinyl flooring
Neighborhood map
What this means for you Summary
Snapshot
- This is a 3-bed/2.0-bath single-family listed at $160k.
Deal economics
- At list price, monthly cash flow is $3 ($41/yr) — positive.
- The deal already cash-flows at list — no discount required.
- To meet the 1% rule (rent ≥ 1% of price), the offer needs to be $137k (14.6% below list).
- Recommended offer: $137k (14.6% below list) — sets the bar for 1% rule.
Location & tenants
- Location reads 57/100 on livability (#595 in NC) — a working-class tenant base; expect higher turnover. Strengths: cost of living A+, housing A-; Watch: crime D, schools F, amenities F.
- Edgecombe County Public Schools (rural): math 21% / reading 27% proficiency, ranked #163 of 178 in NC (top 92%) — low school quality limits family demand, transient renter base, plan for 1-2y turnover; 74% free/reduced lunch — lower-income household profile, screen leases tightly.
- Market conditions: Rents rising fast (+5.5%/yr); 171 active listings in the ZIP; 50 units permitted in Edgecombe County in 2024 (5 in 5+ unit buildings).
Forward outlook
- Local home prices are declining (-3.0%/yr); year-one equity from $1k of loan paydown is wiped out by about $5k of value loss. Plan a longer hold.
- Edgecombe County population projected at -34% by 2050 — secular population decline; favor cash flow + early exit over multi-decade hold.
Negotiation context
- It's been on market 53 days — a 3% lower offer ($155k) is reasonable based on typical stale-listing flexibility.
- 4 sale attempts; this cycle's ask has dropped $15k (9%) from the opening price — seller is motivated, your offer sets the floor, not the list.
- Current owner paid $127k; 26% above their basis — modest negotiation headroom, anchor on the comps not their cost.
Risks & watch-outs
- Climate carrying-cost: major wind risk, 78% chance of damaging wind over 30y; extreme-heat days projected 7→16/yr by 2055 (HVAC capex compounding) — expect insurance premiums to compound above CPI over the hold.
Questions for the listing agent
- It's been on market 53 days. Have you received any prior offers? Is the seller open to a 15% concession, seller financing, or rate buy-down credit?
- Is there a deadline driving the sale (1031 exchange, divorce, estate, relocation)? That informs how much negotiation room exists.
- Schools are F-rated, which usually means shorter tenancies and higher turnover. Who's the typical renter profile here, and what's been the actual vacancy rate?
- Crime grade is D in this area — have there been break-ins, vandalism, or insurance claims at this property in the last 3 years? What carrier currently insures it and at what premium?
- The area grade is low — what's the realistic commute time and amenity access for the typical tenant pool here? Any planned neighborhood developments (good or bad) we should know about?
- What's the average days-on-market for RENTAL listings here right now (not sales)? A rising rental-DOM trend means longer vacancies and softer asking-rent achievability than the comps imply.
- What's the recent tenant-quality profile in this submarket — average credit score on applications, eviction rate, late-payment / NSF rate, and stable-employment percentage? A property-management company in the area should have these aggregated.
- How much new for-sale + rental construction is in the pipeline within 1–3 miles? Heavy new supply typically softens prices + rents 12–24 months out; constrained supply supports both.
Investment metrics
- 1% rule
- 0.85% ✗
- Cap rate
- 6.32%
- Cash-on-cash
- 0.09%
- DSCR
- 1.00
- GRM
- 9.8
CMA / ARV
- ARV (on-the-fly)
- $175,960
- Comps found
- 6
Show comp detail 6 sales within ~0.75 mi
| Address | Dist | Beds/Ba | Sqft | Sold | Price | $/sf | Match |
|---|---|---|---|---|---|---|---|
| 236 Katie Dr | 0.07mi | 3/2.0 | 1,110 (+5%) | 9mo | $184,900 | $167 | 82 |
| 408 Katie Dr | 0.07mi | 3/2.0 | 1,042 (-2%) | 19mo | $181,900 | $175 | 78 |
| 109 Mary Ln | 0.11mi | 3/2.0 | 1,178 (+11%) | 13mo | $195,000 | $166 | 65 |
| 521 S Railroad St | 0.74mi | 2/1.0 (-1) | 998 (-6%) | 0mo | $92,500 | $93 | 47 |
| 4045 S Hathaway Blvd | 0.61mi | 2/2.0 (-1) | 1,108 (+4%) | 15mo | $154,900 | $140 | 47 |
| 309 John J Sharpe St | 0.70mi | 3/1.0 | 979 (-8%) | 18mo | $130,000 | $133 | 35 |
Match score weights: distance 35% · size 25% · config 20% · recency 20%. Top-matched comps best support the ARV.
Projected returns pro-forma
-3.0% appreciation · 5.51% rent growth · sell at horizon
- IRR
- -13.5%
- Equity multiple
- 0.51×
- Total profit
- $-22,155
- Equity at exit
- $23,842
- IRR
- -1.1%
- Equity multiple
- 0.92×
- Total profit
- $-3,729
- Equity at exit
- $13,825
Cash invested: $44,772 (down + closing). Projections, not guarantees.
Landlord ↔ Tenant lean methodology
- Overall (STATE)
- 85 Strongly Landlord-Friendly
- State North Carolina
- 85 Strongly Landlord-Friendly · R+3
- County
- — inherits STATE
- City
- — inherits STATE
ZIP-level market 27803
- Rents YoY
- 5.5%
- Active inventory
- 171
- Price-to-rent
- 9.8×
Monthly cashflow live
- Estimated rent
- $1,365 medium interval (Pro) →
- Mortgage (P&I)
- −$839
- Tax from tax record
- −$170 /mo · $2,041/yr
- Insurance
- −$67
- HOA
- −$0
- Vacancy / Maint / Mgmt
- −$287
- Net cashflow
- $3
Break-even live
UW: 25.0% down · 7.5% · 30yr · 1.5% tax · 5.0% vac · 8.0% maint · 8.0% mgmt
Financing live
Cash to close
- Down payment
- $39,975
- Closing costs
- $4,797
- Reserves months
- —
- Total cash needed
- —
Loan-product check · same deal, 3 products live
Conventional
25% down · 7.5% · 30yr
- Down + closing
- —
- Monthly P&I
- —
- Monthly cashflow
- —
- DSCR
- —
- Eligible?
- —
Personal DTI + credit; lowest rate.
DSCR
20% down · 8.5% · 30yr
- Down + closing
- —
- Monthly P&I
- —
- Monthly cashflow
- —
- DSCR
- —
- Eligible?
- —
No personal income docs; deal must DSCR.
Hard money
10% down · 12.0% · 12mo
- Down + closing
- —
- Monthly P&I
- —
- Monthly cashflow
- —
- DSCR
- —
- Eligible?
- —
Short-term bridge; refi at stabilization.
Listing history 35 events
-
2026-06-19days on market $159,900 Active 53 DOM
-
2026-06-18days on market $159,900 Active 52 DOM
-
2026-06-17days on market $159,900 Active 51 DOM
-
2026-06-16days on market $159,900 Active 50 DOM
-
2026-06-15days on market $159,900 Active 49 DOM
-
2026-06-14days on market $159,900 Active 47 DOM
-
2026-06-13days on market $159,900 Active 46 DOM
-
2026-06-10days on market $159,900 Active 44 DOM
-
2026-06-09days on market $159,900 Active 43 DOM
-
2026-06-08days on market $159,900 Active 42 DOM
-
2026-06-07days on market $159,900 Active 41 DOM
-
2026-06-05days on market $159,900 Active 38 DOM
-
2026-06-02days on market $159,900 Active 36 DOM
-
2026-06-01days on market $159,900 Active 35 DOM
-
2026-05-31days on market $159,900 Active 34 DOM
-
2026-05-30days on market $159,900 Active 33 DOM
-
2026-05-11price $164,900 337-char remark
Show marketing remark (337 chars)
USDA Eligible! This charming 3 bedroom, 2 full bath ranch style home in Sharpsburg is ready for you! Upgrades include paint throughout, new shingles, luxury vinyl plank flooring, and HVAC. Tucked away in a low traffic neighborhood, this home is still an easy drive to amenities in either Rocky Mount or Wilson. Make this one yours today!
-
2026-05-11price $164,900
Show marketing remark (337 chars)
USDA Eligible! This charming 3 bedroom, 2 full bath ranch style home in Sharpsburg is ready for you! Upgrades include paint throughout, new shingles, luxury vinyl plank flooring, and HVAC. Tucked away in a low traffic neighborhood, this home is still an easy drive to amenities in either Rocky Mount or Wilson. Make this one yours today!
-
2026-04-27$174,900 Active 337-char remark
Show marketing remark (337 chars)
USDA Eligible! This charming 3 bedroom, 2 full bath ranch style home in Sharpsburg is ready for you! Upgrades include paint throughout, new shingles, luxury vinyl plank flooring, and HVAC. Tucked away in a low traffic neighborhood, this home is still an easy drive to amenities in either Rocky Mount or Wilson. Make this one yours today!
-
2026-04-27$174,900 Active
Show marketing remark (337 chars)
USDA Eligible! This charming 3 bedroom, 2 full bath ranch style home in Sharpsburg is ready for you! Upgrades include paint throughout, new shingles, luxury vinyl plank flooring, and HVAC. Tucked away in a low traffic neighborhood, this home is still an easy drive to amenities in either Rocky Mount or Wilson. Make this one yours today!
-
2026-02-26price $172,500
-
2026-02-03status Active
-
2026-02-03price $175,000
-
2026-01-19status Pending
-
2026-01-19historical
-
2025-12-10price $180,000
-
2025-12-01price $182,500
-
2025-11-07price $184,500
-
2025-10-10price $186,000
-
2025-09-21price $187,500
-
2025-09-03price $189,999
-
2025-08-15$192,000 Active
-
2025-07-18soldstatus $127,000
-
2016-08-01soldstatus $55,000
-
2007-10-12soldstatus $55,000
ⓘ Source: listings_history table (triggers on properties + properties_extension) + one-shot
backfill from property_details.listing_events for pre-trigger history.
Tax reassessment forecast NC · Resets to sale price
- Current annual tax
- $2,041 · $170/mo
- Projected year-2 tax
- $2,041 · $170/mo
- Expected delta
- $0/yr ($0/mo · 0.0%)
ⓘ Screening estimate from a state-policy table — verify with the county assessor before closing.
Climate risk First Street
- Flood 1/10 Low FEMA zone X (unshaded) · 0% chance over 30 yrs
- Wildfire 4/10 Moderate
- Heat 7/10 Severe 7 d/yr ≥107°F today · 16 d/yr by 30 yrs out
- Wind 7/10 Severe 78% chance of damaging wind over 30 yrs
- Air quality 2/10 Low 1 unhealthy d/yr today · 2 by 30 yrs out
Nearby sold comps map
Loading sold comps map…
Walkable amenities ~0.75 mi
Loading nearby amenities…
Taxation est. · year 1
- Rental income
- $16,386
- − Mortgage interest
- −$8,957
- − Property taxes
- −$2,041
- − Insurance
- −$800
- − Repairs & maintenance
- −$1,311
- − Management
- −$1,311
- − Depreciation
- −$4,652
- Taxable loss
- −$2,686
- Est. tax savings @ 24.0%
- +$645
- After-tax cash flow
- $686/yr
For passive investors: Depreciation is non-cash, so a rental often shows a tax loss while cash-flowing — sheltering income. Rental losses are passive: they offset passive income freely, and up to $25,000/yr can offset ordinary (W-2) income if you actively participate and your MAGI is under $100k (phasing out to $0 by $150k); unused losses carry forward. On sale, claimed depreciation is recaptured at up to 25%, and gains may owe capital-gains tax (a 1031 exchange can defer both). Figures are a year-1 estimate at your 24.0% rate — not tax advice; consult a CPA.
Schools (NCES district)
- District
- Edgecombe County Public Schools
- NCES district ID
- 3701320
- Math proficiency
- 21% ▼ -2.00%
- Reading proficiency
- 27% ▲ 2.00%
- Median HH income
- $35,711
- Composite
- 19.85/100
- National rank
- #8696
- State rank
- #163 of 178 in NC
Livability — Sharpsburg
- Score
- 57/100
- State rank
- #595
- US rank
- #21689
Category grades
Schools grade is shown separately in the Schools card above.
Census & demographics
- Census place
- Sharpsburg, NC
- County
- Nash County · 50,768 people
- City population
- 1,099
- Metro
- Rocky Mount, NC
- Population (ZIP)
- 20,055
- Household income
- $60,124
- Rent vs Own
- Severe rent burden
- 641.0
Population outlook (Edgecombe County) Hauer SSP2
- Today (2025)
- 47,800 people
- By 2030
- 44,396 · -7.1%
- By 2040
- 37,562 · -21.4%
- By 2050
- 31,495 · -34.1%
- By 2075
- 20,943 · -56.2%
- By 2100
- 13,674 · -71.4%
Race, ethnicity, and origin ACS 2023
- Neighborhood character
- Diverse neighborhood (Simpson 0.60)
- Race & ethnicity
- White 46% Black 44% Two or more races 6% Hispanic / Latino 5% Asian 1%
- Common ancestry
- Iranian 1% Italian 1% Slovak 1%
- Foreign-born
- 3% · Canada
- Languages at home
- 93% English-only · Spanish 5% Arabic 1% Other Indo-European 1%
Political lean MEDSL · Edgecombe
- 2024 margin
- Strong D (+22.7) · D 61.0% · R 38.3%
- 2008→2024 swing
- -11.8pp toward R · 2008: 34.5pp · 2024: 22.7pp
- All cycles
- 2024: D+22.7 2020: D+27.0 2016: D+32.2 2012: D+36.4 2008: D+34.5
Not yet ingested
- Civics
- —
Market trends
- HPI YoY
- ▼ -162.95%
- Current HPI
- 190.0204
- Rent YoY
- ▲ 5.51%
- Metro
- Rocky Mount, NC
- State GDP YoY
- ▲ 3.28%
- F500 in state
- 26
Industry mix (Fortune 500 HQ in NC)
| Industry | F500 HQs | Revenue |
|---|---|---|
| Financial Services | 2 | $213B |
|
||
| Retail | 2 | $95B |
|
||
| Industrial Conglomerate | 1 | $38B |
|
||
| Metals / Steel | 1 | $35B |
|
||
| Utilities | 1 | $30B |
|
||
| Industrial Machinery | 1 | $19B |
|
||
Price history
+199.8% since first listed19 events — show timeline
- 2026-05-11 Price Changed $164,900 Hive MLS
- 2026-05-11 Price Changed $164,900 TMLS
- 2026-04-27 Listed $174,900 TMLS
- 2026-04-27 Listed $174,900 Hive MLS
- 2026-02-26 Price Changed $172,500 TMLS
- 2026-02-03 Relisted — TMLS
- 2026-02-03 Price Changed $175,000 TMLS
- 2026-01-19 Pending — TMLS
- 2026-01-19 Listing Removed — TMLS
- 2025-12-10 Price Changed $180,000 TMLS
- 2025-12-01 Price Changed $182,500 TMLS
- 2025-11-07 Price Changed $184,500 TMLS
- 2025-10-10 Price Changed $186,000 TMLS
- 2025-09-21 Price Changed $187,500 TMLS
- 2025-09-03 Price Changed $189,999 TMLS
- 2025-08-15 Listed $192,000 TMLS
- 2025-07-18 Sold (Public Records) $127,000 Public Records
- 2016-08-01 Sold (Public Records) $55,000 Public Records
- 2007-10-12 Sold (Public Records) $55,000 Public Records
Property tax history
+3.4%/yrLatest (2025): $2,041 · +0.0% YoY. Source: county tax records.
Cash-flow waterfall
monthlySold comps — $/sqft
last 12 mo · ≤1 miLoading sold comps…