 6-Plex
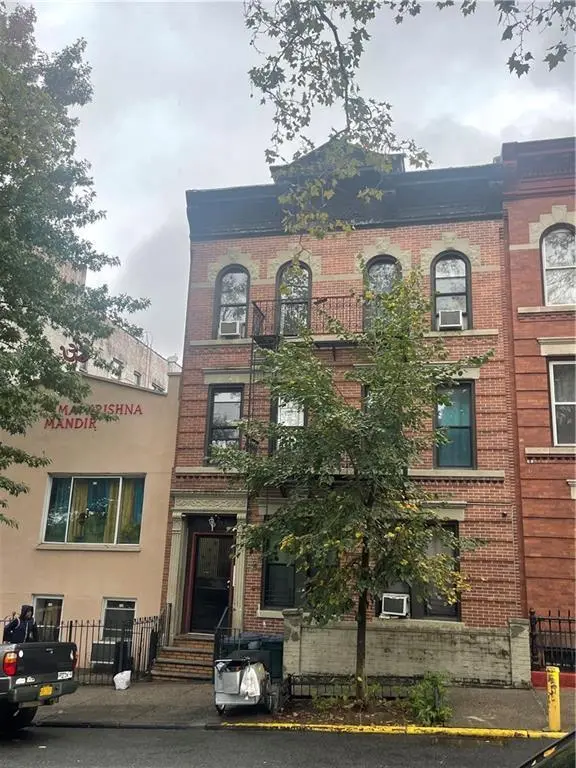
543 41 St · New York, NY
Flood risk 1/10 · Minimal
- FEMA flood zone
- X (unshaded)
- Chance of flooding over 30 yrs
- 0.0%
- Est. flood insurance / yr
- $507 – $1,088
Fire risk 1/10 · Minimal
- Est. fire insurance / yr
- $691 – $1,283
Heat risk 6/10 · Moderate
- Hot days now (above 97°F)
- 7 days/yr
- Hot days in 30 yrs
- 14 days/yr
Wind risk 6/10 · Moderate
- Chance of severe wind over 30 yrs
- 61.0%
Air-quality risk 4/10 · Minor
- Unhealthy air days now
- 5 days/yr
- Unhealthy air days in 30 yrs
- 7 days/yr
Risk factors via First Street. Map © Google.
Why this score? — see what drove the A- grade
The composite is a weighted blend of 9 inputs, each scored 0–100. Each bar is that input's sub-score; the figure is the points it added to the 100-point composite (weight × sub-score).
- Cash flow +27.4/30.0
- ARV discount +15.0/15.0
- DSCR +9.6/10.0
- Appreciation +9.2/10.0
- 1% rule +7.3/10.0
- Schools +5.0/10.0
- Rent growth +4.1/5.0
- Livability +3.8/5.0
- Condition / age +2.5/5.0
$1,330,000
🖨 Deal sheet (PDF) 📄 Offer letter ✓ Due diligence
Multi-family units
County records classify this as Multi-Family (5+ Unit). Listing-text estimate: 6 units. confirmed
5+ unit building — per-unit beds/baths from public records are typically unavailable; the breakdown below (if shown) is an estimate from the listing text.
Listing remarks MLS
Solid brick 6 family building located in the prime Sunset Park. Lot: 25x100, Building: 25x78. Finished basement with separate front and back entrance. Three 3 bedrooms and three 2 bedrooms apartment. Gross rental income $96,708/Year. Near N and R subway station. Don’t miss out this opportunity to own the income immediately building with the beautiful park view of Sunset Park.
Key facts
- Separate entrance
- Brick house
- Investment property
Tags
Property features AI
Finance
- Other: Six residential units (all currently leased) with reported current rents per unit; Unit rents reported: $1,342; $1,556; $922; $1,722; $1,348; $1,556
- Financial info: Financing: Bank mortgage or cash
Exterior
- Parking: No parking
- Utilities: Electric: 110V and 220V; Hot water: Gas; Heating fuel: Gas; Heat delivery: Steam/Radiator
- Home design: Residential property; Brick exterior; Flat roof; Poured concrete foundation; Building footprint approximately 78 x 25
- Construction: Brick construction
- Exterior features: Back yard; Attached building; Zoning: R6A
Interior
- Kitchen: Stove included
- Bedrooms: Six-unit building with a mix of 2- and 3-bedroom apartments; Units with 3 bedrooms on floors 1, 2 and 3; Units with 2 bedrooms on floors 1, 2 and 3
- Flooring: Hardwood floors; Tile floors; Other flooring (see remarks)
- Bathrooms: Six full bathrooms total; Each unit has one full bath
- Heating & cooling: Gas hot water; Gas heating fuel; Steam/radiator heat
- Interior features: Stove; Other interior features; Finished full basement; 1 AC unit
- Laundry & utility: Utility expense listed (approx. $600)
Neighborhood map
What this means for you Summary
Snapshot
- This is a 6 × 2-bed/1.0-bath units multifamily listed at $1.33M.
Deal economics
- At list price, monthly cash flow is $4k ($47k/yr) — positive. Per door: $649/mo.
- The deal already cash-flows at list — no discount required.
- Meets the 1% rule at list price ($16k rent vs $1.33M).
- Recommended offer: $1.17M (12.0% below list) — sets the bar for market timing.
- Cap rate 9.8% vs local median 2.6% in New York — top-decile yield for the area; either an underpriced asset or a hidden risk that comps aren't pricing in. Stress-test before assuming the spread holds.
Location & tenants
- Location reads 75/100 on livability (#268 in NY, #4,188 nationally) — a middle-class / working-renter tenant base. Strengths: amenities A+, commute A+, health & safety A; Watch: crime F, cost of living F.
- Zoned schools: Elm Tree Elementary School (math 27% / reading 52%, grade F, #1,444 of 2,108 statewide, top 71%, 806 students, 94% FRL); Ms 51 William Alexander (math 67% / reading 92%, grade A+, #32 of 729 statewide, top 5%, 1,026 students, 61% FRL); Midwood High School (math 94% / reading 96%, grade A+, #83 of 1,100 statewide, top 8%, 4,062 students, 73% FRL).
- Market conditions: Rents rising fast (+6.3%/yr); 87 active listings in the ZIP; solid renter incomes; 10,063 units permitted in Kings County in 2024 (9,789 in 5+ unit buildings).
Forward outlook
- In year one you build about $120k of equity ($9k loan paydown + $111k appreciation (8.3% local appreciation)).
- Kings County population projected at +13% by 2050 — modest demand growth; plan on rents tracking national, not racing it.
- At projected returns (8.3% appreciation + 6.3% rent growth), your $372k cash investment doubles in ~3 years — after that, you're playing with house money.
- By year 2, paydown + projected appreciation supports a ~$193k cash-out refi (75% LTV) — recoverable capital for the next deal without selling this one.
Negotiation context
- It's been on market 363 days — a 12% lower offer ($1.17M) is reasonable based on typical stale-listing flexibility.
- 2 sale attempts since 3y ago with the ask held roughly flat each time — persistent listings suggest the price (not the market) is what's stuck; bring a comps-based counter.
- Current owner paid $950k; 40% above their basis — modest negotiation headroom, anchor on the comps not their cost.
Risks & watch-outs
- Watch-outs: built in 1925 — expect roof / HVAC / electrical / plumbing capex.
- Climate carrying-cost: major wind risk, 61% chance of damaging wind over 30y; extreme-heat days projected 7→14/yr by 2055 (HVAC capex compounding) — expect insurance premiums to compound above CPI over the hold.
Questions for the listing agent
- It's been on market 363 days. Have you received any prior offers? Is the seller open to a 12% concession, seller financing, or rate buy-down credit?
- Can we see the unit-by-unit rent roll, current vacancy, and any below-market leases? What's the average tenancy length?
- What capital expenditures (roof, boiler, parking lot, exteriors) have been made in the last 5 years, and what's planned in the next 2?
- Built in 1925 — when were the roof, HVAC, electrical panel, plumbing, and water heater last replaced?
- Why hasn't it sold? Are there any deal-killer items the seller is aware of (foundation, flood, title, zoning, code violations)?
- Is there a deadline driving the sale (1031 exchange, divorce, estate, relocation)? That informs how much negotiation room exists.
- Schools are B-rated — typically a magnet for longer-tenancy family renters. What's the average tenant stay here, and is there a school-zone premium baked into asking?
- Crime grade is F in this area — have there been break-ins, vandalism, or insurance claims at this property in the last 3 years? What carrier currently insures it and at what premium?
- What's the average days-on-market for RENTAL listings here right now (not sales)? A rising rental-DOM trend means longer vacancies and softer asking-rent achievability than the comps imply.
- What's the recent tenant-quality profile in this submarket — average credit score on applications, eviction rate, late-payment / NSF rate, and stable-employment percentage? A property-management company in the area should have these aggregated.
- How much new apartment / multifamily construction is in the pipeline within 1–3 miles? Heavy new supply (>2% of stock underway) typically softens rents 12–24 months out; light construction supports rent growth.
Investment metrics
- 1% rule
- 1.23% ✓
- Cap rate
- 9.81%
- Cash-on-cash
- 12.55%
- DSCR
- 1.56
- GRM
- 6.8
CMA / ARV
- ARV (on-the-fly)
- $2,016,900
- Comps found
- 1
Show comp detail 1 sale within ~0.75 mi
| Address | Dist | Beds/Ba | Sqft | Sold | Price | $/sf | Match |
|---|---|---|---|---|---|---|---|
| 719 55th St | 0.74mi | 11/6.0 (-1) | 4,374 (-12%) | 10mo | $1,770,000 | $405 | 32 |
Match score weights: distance 35% · size 25% · config 20% · recency 20%. Top-matched comps best support the ARV.
Projected returns pro-forma
8.35% appreciation · 6.26% rent growth · sell at horizon
- IRR
- 32.0%
- Equity multiple
- 3.37×
- Total profit
- $881,068
- Equity at exit
- $1,041,985
- IRR
- 29.6%
- Equity multiple
- 7.73×
- Total profit
- $2,504,400
- Equity at exit
- $2,099,164
Cash invested: $372,400 (down + closing). Projections, not guarantees.
Landlord ↔ Tenant lean methodology
- Overall (CITY)
- 0 Strongly Tenant-Friendly
- State New York
- 15 Strongly Tenant-Friendly · D+10
- County
- — inherits STATE
- City New York
- 0 Strongly Tenant-Friendly · D+34
ZIP-level market 11232
- Home prices YoY
- 2.0%
- Rents YoY
- 6.3%
- Active inventory
- 87
- Price-to-rent
- 40.7×
Monthly cashflow live
- Estimated rent
- $16,325 medium interval (Pro) →
- Mortgage (P&I)
- −$6,975
- Tax from tax record
- −$1,472 /mo · $17,669/yr
- Insurance
- −$554
- HOA
- −$0
- Vacancy / Maint / Mgmt
- −$3,428
- Net cashflow
- $3,895
Break-even live
Sensitivity live
| Price | -10% $4,648 | -5% $4,272 | +0% $3,895 | +5% $3,519 | +10% $3,143 |
|---|---|---|---|---|---|
| Rent | -10% $2,606 | -5% $3,251 | +0% $3,895 | +5% $4,540 | +10% $5,185 |
| Rate | -1.0pp $4,565 | -0.5pp $4,234 | base $3,895 | +0.5pp $3,551 | +1.0pp $3,200 |
6-unit breakdown (identical units grouped — click to expand)
| Units | Beds | Baths | Est. rent |
|---|---|---|---|
| 6× units | 2 | 1 | $16,326 |
| #1 | 2 | 1 | $2,721 |
| #2 | 2 | 1 | $2,721 |
| #3 | 2 | 1 | $2,721 |
| #4 | 2 | 1 | $2,721 |
| #5 | 2 | 1 | $2,721 |
| #6 | 2 | 1 | $2,721 |
| Total (6 units) | $16,325 | ||
UW: 25.0% down · 7.5% · 30yr · 1.5% tax · 5.0% vac · 8.0% maint · 8.0% mgmt
Financing live
Cash to close
- Down payment
- $332,500
- Closing costs
- $39,900
- Reserves months
- —
- Total cash needed
- —
Loan-product check · same deal, 3 products live
Conventional
25% down · 7.5% · 30yr
- Down + closing
- —
- Monthly P&I
- —
- Monthly cashflow
- —
- DSCR
- —
- Eligible?
- —
Personal DTI + credit; lowest rate.
DSCR
20% down · 8.5% · 30yr
- Down + closing
- —
- Monthly P&I
- —
- Monthly cashflow
- —
- DSCR
- —
- Eligible?
- —
No personal income docs; deal must DSCR.
Hard money
10% down · 12.0% · 12mo
- Down + closing
- —
- Monthly P&I
- —
- Monthly cashflow
- —
- DSCR
- —
- Eligible?
- —
Short-term bridge; refi at stabilization.
Listing history 18 events
-
2026-06-15days on market $1,330,000 Active 363 DOM
-
2026-06-13days on market $1,330,000 Active 361 DOM
-
2026-06-10days on market $1,330,000 Active 357 DOM
-
2026-06-08days on market $1,330,000 Active 356 DOM
-
2026-06-03days on market $1,330,000 Active 351 DOM
-
2026-06-01days on market $1,330,000 Active 349 DOM
-
2026-05-31days on market $1,330,000 Active 348 DOM
-
2025-07-21price $1,330,000
-
2025-06-20price $1,380,000
-
2025-06-17$1,299,000 Active
-
2025-02-21soldstatus $950,000
-
2025-02-11soldstatus $950,000 Sold 385-char remark
Show marketing remark (385 chars)
Solid brick 6 family building located in the prime Sunset Park. Lot: 25x100, Building: 25x78. Finished basement with separate front and back entrance. Three 3 bedrooms and three 2 bedrooms apartment. Gross rental income $96,708/Year. Near N and R subway station. Don’t miss out this opportunity to own the income immediately building with the beautiful park view of Sunset Park.
-
2024-12-07status Pending 385-char remark
Show marketing remark (385 chars)
Solid brick 6 family building located in the prime Sunset Park. Lot: 25x100, Building: 25x78. Finished basement with separate front and back entrance. Three 3 bedrooms and three 2 bedrooms apartment. Gross rental income $96,708/Year. Near N and R subway station. Don’t miss out this opportunity to own the income immediately building with the beautiful park view of Sunset Park.
-
2024-04-26price $1,280,000 385-char remark
Show marketing remark (385 chars)
Solid brick 6 family building located in the prime Sunset Park. Lot: 25x100, Building: 25x78. Finished basement with separate front and back entrance. Three 3 bedrooms and three 2 bedrooms apartment. Gross rental income $96,708/Year. Near N and R subway station. Don’t miss out this opportunity to own the income immediately building with the beautiful park view of Sunset Park.
-
2024-04-03price $1,320,000 385-char remark
Show marketing remark (385 chars)
Solid brick 6 family building located in the prime Sunset Park. Lot: 25x100, Building: 25x78. Finished basement with separate front and back entrance. Three 3 bedrooms and three 2 bedrooms apartment. Gross rental income $96,708/Year. Near N and R subway station. Don’t miss out this opportunity to own the income immediately building with the beautiful park view of Sunset Park.
-
2023-10-23$1,380,000 Active 385-char remark
Show marketing remark (385 chars)
Solid brick 6 family building located in the prime Sunset Park. Lot: 25x100, Building: 25x78. Finished basement with separate front and back entrance. Three 3 bedrooms and three 2 bedrooms apartment. Gross rental income $96,708/Year. Near N and R subway station. Don’t miss out this opportunity to own the income immediately building with the beautiful park view of Sunset Park.
-
2013-03-07soldstatus $900,000
-
2005-05-31soldstatus $730,000
ⓘ Source: listings_history table (triggers on properties + properties_extension) + one-shot
backfill from property_details.listing_events for pre-trigger history.
Tax reassessment forecast NY · Partial reset (capped growth)
- Current annual tax
- $17,669 · $1,472/mo
- Projected year-2 tax
- $20,073 · $1,673/mo
- Expected delta
- +$2,404/yr (+$200/mo · 13.6%)
ⓘ Screening estimate from a state-policy table — verify with the county assessor before closing.
Climate risk First Street
- Flood 1/10 Low FEMA zone X (unshaded) · 0% chance over 30 yrs
- Wildfire 1/10 Low
- Heat 6/10 Major 7 d/yr ≥97°F today · 14 d/yr by 30 yrs out
- Wind 6/10 Major 61% chance of damaging wind over 30 yrs
- Air quality 4/10 Moderate 5 unhealthy d/yr today · 7 by 30 yrs out
Nearby sold comps map
Loading sold comps map…
Walkable amenities ~0.75 mi
Loading nearby amenities…
Taxation est. · year 1
- Rental income
- $195,900
- − Mortgage interest
- −$74,501
- − Property taxes
- −$17,669
- − Insurance
- −$6,650
- − Repairs & maintenance
- −$15,672
- − Management
- −$15,672
- − Depreciation
- −$38,691
- Taxable income
- $27,045
- Est. tax owed @ 24.0%
- −$6,491
- After-tax cash flow
- $40,255/yr
For passive investors: Depreciation is non-cash, so a rental often shows a tax loss while cash-flowing — sheltering income. Rental losses are passive: they offset passive income freely, and up to $25,000/yr can offset ordinary (W-2) income if you actively participate and your MAGI is under $100k (phasing out to $0 by $150k); unused losses carry forward. On sale, claimed depreciation is recaptured at up to 25%, and gains may owe capital-gains tax (a 1031 exchange can defer both). Figures are a year-1 estimate at your 24.0% rate — not tax advice; consult a CPA.
Schools (NCES district)
No district data.
Livability — New York
- Score
- 75/100
- State rank
- #268
- US rank
- #4188
Category grades
Schools grade is shown separately in the Schools card above.
Census & demographics
- Census place
- New York, NY
- County
- Kings County · 2,614,986 people
- City population
- 7,731,280
- Metro
- New York-Newark-Jersey City, NY-NJ-PA
- Population (ZIP)
- 27,816
- Household income
- $90,891
- Rent vs Own
- Severe rent burden
- 1713.0
Population outlook (Kings County) Hauer SSP2
- Today (2025)
- 2,847,441 people
- By 2030
- 2,937,006 · +3.1%
- By 2040
- 3,095,491 · +8.7%
- By 2050
- 3,228,968 · +13.4%
- By 2075
- 3,321,723 · +16.7%
- By 2100
- 3,111,387 · +9.3%
Race, ethnicity, and origin ACS 2023
- Neighborhood character
- Diverse neighborhood (Simpson 0.65)
- Race & ethnicity
- Hispanic / Latino 52% White 23% Asian 15% Two or more races 12% Black 6% Native American 4%
- Hispanic origin (detail)
- Mexican 20% Puerto Rican 9% Dominican 7%
- Common ancestry
- Romanian 3% Scotch-Irish 1% Lithuanian 1%
- Foreign-born
- 38% · Canada, China, Jamaica
- Languages at home
- 40% English-only · Spanish 44% Chinese 9% Other Asian/Pacific 1%
Political lean MEDSL · Kings
- 2024 margin
- Solid D (+44.0) · D 72.0% · R 28.0%
- 2008→2024 swing
- -15.5pp toward R · 2008: 59.4pp · 2024: 44.0pp
- All cycles
- 2024: D+44.0 2020: D+54.8 2016: D+61.8 2012: D+63.9 2008: D+59.4
Not yet ingested
- Civics
- —
Market trends
- HPI YoY
- ▲ 8.35%
- Current HPI
- 422.0849
- Rent YoY
- ▲ 6.26%
- Metro
- New York-Newark-Jersey City, NY-NJ-PA
- State GDP YoY
- ▲ 2.60%
- F500 in state
- 92
Industry mix (Fortune 500 HQ in NY)
| Industry | F500 HQs | Revenue |
|---|---|---|
| Financial Services | 10 | $950B |
|
||
| Consumer Goods | 9 | $162B |
|
||
| Insurance | 4 | $225B |
|
||
| Telecommunications | 2 | $144B |
|
||
| Pharmaceuticals | 2 | $112B |
|
||
| Media / Entertainment | 2 | $69B |
|
||
Price history
+82.2% since first listed11 events — show timeline
- 2025-07-21 Price Changed $1,330,000 BNYMLS
- 2025-06-20 Price Changed $1,380,000 BNYMLS
- 2025-06-17 Listed $1,299,000 BNYMLS
- 2025-02-21 Sold (Public Records) $950,000 Public Records
- 2025-02-11 Sold (MLS) $950,000 BNYMLS
- 2024-12-07 Pending — BNYMLS
- 2024-04-26 Price Changed $1,280,000 BNYMLS
- 2024-04-03 Price Changed $1,320,000 BNYMLS
- 2023-10-23 Listed $1,380,000 BNYMLS
- 2013-03-07 Sold (Public Records) $900,000 Public Records
- 2005-05-31 Sold (Public Records) $730,000 Public Records
Property tax history
+4.9%/yrLatest (2025): $17,669 · -1.0% YoY. Source: county tax records.
Cash-flow waterfall
monthlySold comps — $/sqft
last 12 mo · ≤1 miLoading sold comps…