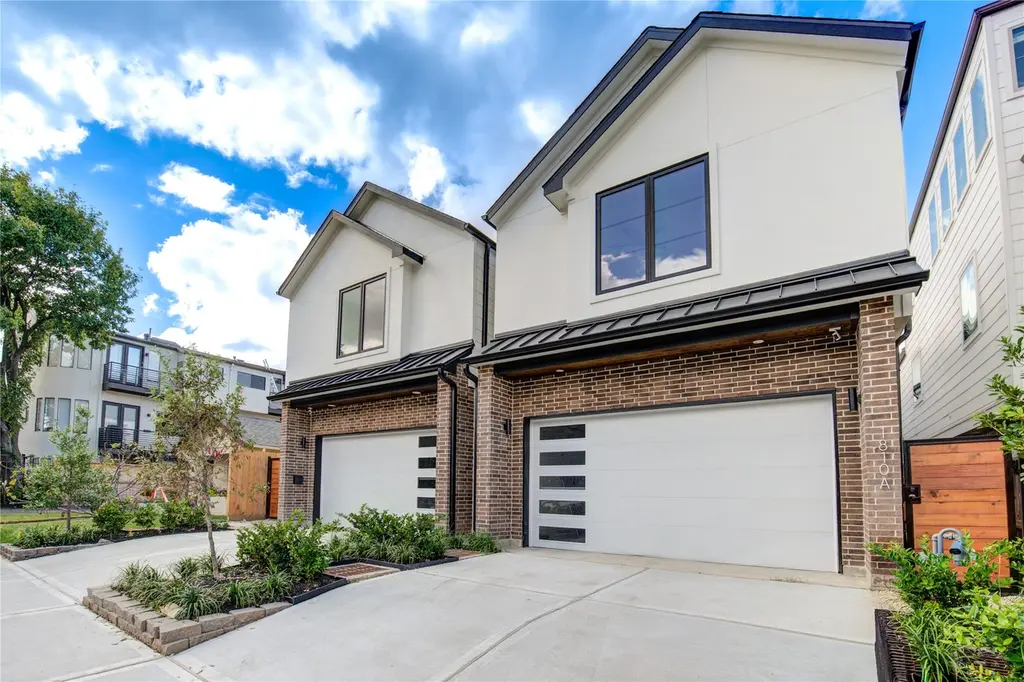
1810 Hazard St Unit A · Houston, TX
Flood risk No data
- FEMA flood zone
- —
- Chance of flooding over 30 yrs
- —
- Est. flood insurance / yr
- —
Fire risk No data
- Est. fire insurance / yr
- —
Heat risk No data
- Hot days now (above threshold)
- —
- Hot days in 30 yrs
- —
Wind risk No data
- Chance of severe wind over 30 yrs
- —
Air-quality risk No data
- Unhealthy air days now
- —
- Unhealthy air days in 30 yrs
- —
Risk factors via First Street. Map © Google.
Why this score? — see what drove the D+ grade
The composite is a weighted blend of 9 inputs, each scored 0–100. Each bar is that input's sub-score; the figure is the points it added to the 100-point composite (weight × sub-score).
- Cash flow +14.7/30.0
- ARV discount +13.3/15.0
- DSCR +4.5/10.0
- 1% rule +4.1/10.0
- Livability +3.7/5.0
- Schools +2.7/10.0
- Condition / age +2.5/5.0
- Rent growth +2.3/5.0
- Appreciation +0.0/10.0
$875,000
🖨 Deal sheet 📄 Offer letter ✓ Due diligence
Listing remarks MLS
CENTRALLY LOCATED INSIDE THE LOOP 610. FIRST FLOOR LIVING, OPEN FLOOR PLAN, GRANITE COUNTERTOPS, KITCHEN FLOOR IS TILED, THE REST OF THE HOUSE HARDWOOD FLOOR. FROM SITTING AREA DOORS OPEN TO LOW MAINTENANCE PATIO/BACKYARD WHICH IS FULLY FENCED. LIVING & DINING AREA ANCHORED BY AN ON TREND FIREPLACE FLANKED BY TWO DOORS ALLOWING FOR GENEROUS NATURAL LIGHT. CENTRAL AIR AND HEAT. NEVER LIVED IN, 4 GOOD SIZE BEDROOMS. ONE BEDROOM COULD BE CONVERTED TO AN EXTRA BATHROOM. FOUNDATION IS PIER BEAM & SLAB. NO HOA, NEVER FLOODED. INSTALLED ALARM SYSTEM & CAMERAS. CONVENIENT LOCATION WITHIN WALKING DISTANCE TO RIVER OAKS SHOPPING CENTER, KROGER SUPERMARKET, POST OFFICE, T.J.MAXX, OFFICEMAX, BARNES & NOBLE BOOKSHOP, RESTAURANTS. GREAT NEIGHBORHOOD! MINUTES TO DOWNTOWN, MIDTOWN, HEIGHTS, MEMORIAL PARK, GALLERIA SHOPPING. CLOSE TO BUFFALO BAYOU WALKING/CYCLING TRAILS & DOG PARK. CONVENIENT FOR MEDICAL CENTER AND UNIVERSITY DISTRICT. EASY ACCESS TO MAJOR HIGHWAYS & DOWNTOWN.
Key facts
- Open floor plan
- Fully fenced
- Central air and heat
Tags
Neighborhood map
What this means for you Summary
Snapshot
- This is a 4-bed/2.5-bath single-family listed at $875k.
Deal economics
- At list price, monthly cash flow is $228 ($3k/yr) — positive.
- The deal already cash-flows at list — no discount required.
- To meet the 1% rule (rent ≥ 1% of price), the offer needs to be $799k (8.6% below list).
- Recommended offer: $799k (8.6% below list) — sets the bar for 1% rule.
- Cap rate 6.6% vs local median 3.2% in Houston — top-decile yield for the area; either an underpriced asset or a hidden risk that comps aren't pricing in. Stress-test before assuming the spread holds.
Location & tenants
- Location reads 74/100 on livability (#184 in TX, #4,771 nationally) — a middle-class / working-renter tenant base. Strengths: amenities A+, cost of living A+, housing A+; Watch: schools D, crime F.
- Houston ISD (urban): math 27% / reading 35% proficiency, ranked #593 of 826 in TX (top 72%) — families likely to look elsewhere, expect single-tenant / working-renter base with shorter leases; 71% free/reduced lunch — lower-income household profile, screen leases tightly.
- Market conditions: Rents soft (-0.9%/yr); 256 active listings in the ZIP; 35 comparable units currently listed for rent nearby; rentals at typical pace (median 24d on market — plan ~3-4 weeks tenant-placement turnaround); 40% of comp listings sitting > 30 days — soft ceiling on asking rent; high-income renter base; 29,883 units permitted in Harris County in 2024 (8,621 in 5+ unit buildings).
- At $7,995/mo this rent would consume 82% of the median local household income ($116k/yr) (locally 1844% of renters already pay >50% of income on rent) — very limited rent-growth headroom before tenants either downsize or default.
Forward outlook
- Local home prices are declining (-3.0%/yr); year-one equity from $6k of loan paydown is wiped out by about $26k of value loss. Plan a longer hold.
- Harris County population projected at +47% by 2050 — long-run rental-demand tailwind backs the buy-and-hold thesis.
Negotiation context
- It's been on market 77 days — a 6% lower offer ($822k) is reasonable based on typical stale-listing flexibility.
- 3 sale attempts with the ask held roughly flat each time — persistent listings suggest the price (not the market) is what's stuck; bring a comps-based counter.
Questions for the listing agent
- It's been on market 77 days. Have you received any prior offers? Is the seller open to a 9% concession, seller financing, or rate buy-down credit?
- Why hasn't it sold? Are there any deal-killer items the seller is aware of (foundation, flood, title, zoning, code violations)?
- Is there a deadline driving the sale (1031 exchange, divorce, estate, relocation)? That informs how much negotiation room exists.
- Schools are D-rated, which usually means shorter tenancies and higher turnover. Who's the typical renter profile here, and what's been the actual vacancy rate?
- Crime grade is F in this area — have there been break-ins, vandalism, or insurance claims at this property in the last 3 years? What carrier currently insures it and at what premium?
- The area grade is low — what's the realistic commute time and amenity access for the typical tenant pool here? Any planned neighborhood developments (good or bad) we should know about?
- What's the average days-on-market for RENTAL listings here right now (not sales)? A rising rental-DOM trend means longer vacancies and softer asking-rent achievability than the comps imply.
- What's the recent tenant-quality profile in this submarket — average credit score on applications, eviction rate, late-payment / NSF rate, and stable-employment percentage? A property-management company in the area should have these aggregated.
- How much new for-sale + rental construction is in the pipeline within 1–3 miles? Heavy new supply typically softens prices + rents 12–24 months out; constrained supply supports both.
Investment metrics
- 1% rule
- 0.91% ✗
- Cap rate
- 6.61%
- Cash-on-cash
- 1.12%
- DSCR
- 1.05
- GRM
- 9.1
CMA / ARV
- ARV (median comp)
- $1,004,937
- List price
- $875,000
- Delta
- -12.93%
- Verdict
- UNDERPRICED
- Comps
- 20 within 1.0 mi
Show comp detail 12 sales within ~0.75 mi
| Address | Dist | Beds/Ba | Sqft | Sold | Price | $/sf | Match |
|---|---|---|---|---|---|---|---|
| 1953 Haddon St | 0.11mi | 3/3.5 (-1) | 2,534 (-1%) | 2mo | $699,000 | $276 | 82 |
| 1724 Woodhead St | 0.15mi | 3/3.5 (-1) | 2,502 (-2%) | 1mo | $640,000 | $256 | 79 |
| 2410 Huldy St | 0.40mi | 4/3.0 | 2,442 (-4%) | 4mo | $559,000 | $229 | 68 |
| 1545 Haddon St | 0.41mi | 3/3.5 (-1) | 2,506 (-2%) | 2mo | $729,000 | $291 | 67 |
| 1728 Michigan St Unit C | 0.42mi | 3/3.5 (-1) | 2,483 (-3%) | 4mo | $715,000 | $288 | 63 |
| 1817 Kipling St | 0.67mi | 3/2.5 (-1) | 2,552 (-0%) | 1mo | $1,149,000 | $450 | 63 |
| 1728 Michigan St Unit A | 0.42mi | 3/3.5 (-1) | 2,450 (-4%) | 4mo | $689,000 | $281 | 62 |
| 1506 Indiana St | 0.55mi | 4/3.0 | 2,693 (+5%) | 4mo | $1,100,000 | $408 | 60 |
| 1311 Peden St | 0.68mi | 3/3.0 (-1) | 2,604 (+2%) | 1mo | $895,000 | $344 | 57 |
| 1701 Welch St | 0.42mi | 3/3.5 (-1) | 2,239 (-12%) | 2mo | $529,900 | $237 | 50 |
| 1405 Indiana St Unit A | 0.66mi | 3/3.5 (-1) | 2,694 (+6%) | 2mo | $759,000 | $282 | 49 |
| 1515 Hyde Park Blvd Blvd #6 | 0.67mi | 3/3.5 (-1) | 2,813 (+10%) | 1mo | $567,200 | $202 | 42 |
Match score weights: distance 35% · size 25% · config 20% · recency 20%. Top-matched comps best support the ARV.
Projected returns pro-forma
-3.0% appreciation · 0.0% rent growth · sell at horizon
- IRR
- -18.0%
- Equity multiple
- 0.39×
- Total profit
- $-150,533
- Equity at exit
- $130,465
- IRR
- -17.4%
- Equity multiple
- 0.17×
- Total profit
- $-202,314
- Equity at exit
- $75,654
Cash invested: $245,000 (down + closing). Projections, not guarantees.
Landlord ↔ Tenant lean methodology
- Overall (STATE)
- 87 Strongly Landlord-Friendly
- State Texas
- 87 Strongly Landlord-Friendly · R+5
- County
- — inherits STATE
- City
- — inherits STATE
ZIP-level market 77019
- Rents YoY
- -0.9%
- Active inventory
- 256
- Price-to-rent
- 9.1×
Monthly cashflow live
- Estimated rent
- $7,995 high interval (Pro) →
- Mortgage (P&I)
- −$4,589
- Tax from tax record
- −$1,134 /mo · $13,613/yr
- Insurance
- −$365
- HOA
- −$0
- Vacancy / Maint / Mgmt
- −$1,679
- Net cashflow
- $228
Break-even live
UW: 25.0% down · 7.5% · 30yr · 1.5% tax · 5.0% vac · 8.0% maint · 8.0% mgmt
Financing live
Cash to close
- Down payment
- $218,750
- Closing costs
- $26,250
- Reserves months
- —
- Total cash needed
- —
Loan-product check · same deal, 3 products live
Conventional
25% down · 7.5% · 30yr
- Down + closing
- —
- Monthly P&I
- —
- Monthly cashflow
- —
- DSCR
- —
- Eligible?
- —
Personal DTI + credit; lowest rate.
DSCR
20% down · 8.5% · 30yr
- Down + closing
- —
- Monthly P&I
- —
- Monthly cashflow
- —
- DSCR
- —
- Eligible?
- —
No personal income docs; deal must DSCR.
Hard money
10% down · 12.0% · 12mo
- Down + closing
- —
- Monthly P&I
- —
- Monthly cashflow
- —
- DSCR
- —
- Eligible?
- —
Short-term bridge; refi at stabilization.
Rent comps 35 comps
| Address | Beds | Baths | Sqft | Rent | $/sqft | DOM | Units | Dist |
|---|---|---|---|---|---|---|---|---|
| 2024 Welch St Houston, TX | 3.0 | 4.0 | 2294 | $2,800 | $1.22 | 43d | 1 | 0.19mi |
| 1958 W Gray St Unit 3165 Houston, TX | 3.0 | 2.0 | 3206 | $15,018 | $4.68 | 2d | 1 | 0.25mi |
| 1958 W Gray St Unit 1991 Houston, TX | 3.0 | 2.0 | 3206 | $15,050 | $4.69 | 10d | 1 | 0.25mi |
| 1951 W Bell St Houston, TX | 3.0 | 2.0 | 1800 | $2,400 | $1.33 | 43d | 1 | 0.36mi |
| 1951 W Bell St Houston, TX | 3.0 | 2.0 | 1800 | $2,400 | $1.33 | 14d | 1 | 0.36mi |
| 2323 Woodhead St Unit 1019542P Houston, TX | 3.0 | 3.5 | 2820 | $15,722 | $5.58 | 24d | 1 | 0.38mi |
| 1924 Fairview Ave Houston, TX | 3.0 | 3.5 | 2830 | $9,750 | $3.45 | 43d | 1 | 0.39mi |
| 1027 Gross St Houston, TX | 4.0 | 3.5 | 3035 | $5,800 | $1.91 | 43d | 1 | 0.45mi |
| 811 Buffalo Park Dr Unit 844 Houston, TX | 3.0 | 2.0 | 3632 | $14,913 | $4.11 | 13d | 1 | 0.58mi |
| 811 Buffalo Park Dr Unit 3187 Houston, TX | 3.0 | 2.0 | 3632 | $15,392 | $4.24 | 2d | 1 | 0.58mi |
| 811 Buffalo Park Dr Unit 510 Houston, TX | 3.0 | 2.0 | 3632 | $15,424 | $4.25 | 10d | 1 | 0.58mi |
| 2205 Commonwealth St Houston, TX | 4.0 | 4.0 | 2513 | $3,300 | $1.31 | 43d | 1 | 0.62mi |
| 707 Marston St Unit 510 Houston, TX | 3.0 | 2.0 | 2310 | $12,482 | $5.40 | 2d | 1 | 0.66mi |
| 1326 Fairview Ave Houston, TX | 3.0 | 3.0 | 2176 | $3,250 | $1.49 | 43d | 1 | 0.74mi |
| 2311 Westheimer Rd Houston, TX | 1.0–3.0 | 1.0–3.0 | 1489 | $13,862 | $9.31 | 1d | 14 | 0.75mi |
| 2243 W Alabama St Houston, TX | 3.0 | 3.0 | 1998 | $2,440 | $1.22 | 43d | 1 | 0.94mi |
| 1211 Marconi St Houston, TX | 4.0 | 3.5 | 3020 | $4,500 | $1.49 | 43d | 1 | 0.95mi |
| 1118 Columbus St Unit A Houston, TX | 3.0 | 3.5 | 2338 | $3,000 | $1.28 | 43d | 1 | 1.02mi |
| 2651 Kipling St Unit 510 Houston, TX | 3.0 | 2.0 | 2739 | $11,492 | $4.20 | 10d | 1 | 1.04mi |
| 2651 Kipling St Unit 3165 Houston, TX | 3.0 | 2.0 | 2739 | $11,460 | $4.18 | 2d | 1 | 1.05mi |
| 2025 Colquitt St Unit 1257741P Houston, TX | 3.0 | 3.5 | 2594 | $7,405 | $2.85 | 43d | 1 | 1.05mi |
| 3411 Yoakum Blvd Unit 510 Houston, TX | 3.0 | 2.0 | 3110 | $12,304 | $3.96 | 10d | 1 | 1.06mi |
| 3411 Yoakum Blvd Unit 3165 Houston, TX | 3.0 | 2.0 | 3110 | $12,272 | $3.95 | 2d | 1 | 1.06mi |
| 2719 Kipling St Unit B Houston, TX | 3.0 | 3.5 | 2184 | $4,400 | $2.01 | 43d | 1 | 1.07mi |
| 414 Hyde Park Blvd Houston, TX | 3.0 | 3.5 | 2300 | $5,400 | $2.35 | 5d | 1 | 1.22mi |
| 3333 Lake St Unit 510 Houston, TX | 3.0 | 2.0 | 2650 | $10,458 | $3.95 | 10d | 1 | 1.22mi |
| 3333 Lake St Unit 3165 Houston, TX | 3.0 | 2.0 | 2650 | $10,426 | $3.93 | 2d | 1 | 1.22mi |
| 710 Stanford St Houston, TX | 3.0 | 4.0 | 2438 | $3,490 | $1.43 | 43d | 1 | 1.22mi |
| 328 Bomar St Houston, TX | 3.0 | 3.5 | 2688 | $5,300 | $1.97 | 21d | 1 | 1.24mi |
| 911 Thompson St #911 Houston, TX | 4.0 | 3.5 | 3200 | $8,500 | $2.66 | 24d | 1 | 1.39mi |
| 913 Thompson St #913 Houston, TX | 4.0 | 3.5 | 3200 | $8,500 | $2.66 | 24d | 1 | 1.39mi |
| 917 Thompson St Unit 917 Houston, TX | 4.0 | 3.5 | 3200 | $8,000 | $2.50 | 24d | 1 | 1.40mi |
| 915 Thompson St Unit 915 Houston, TX | 4.0 | 3.5 | 3200 | $8,500 | $2.66 | 24d | 1 | 1.40mi |
| 420 Hawthorne St Houston, TX | 4.0 | 2.0 | 2230 | $3,373 | $1.51 | 43d | 1 | 1.43mi |
| 4444 Center St Houston, TX | 3.0 | 3.0 | 2121 | $3,200 | $1.51 | 43d | 1 | 1.49mi |
Listing history 19 events
-
2026-06-18days on market $875,000 Active 77 DOM
-
2026-06-17days on market $875,000 Active 76 DOM
-
2026-06-16days on market $875,000 Active 75 DOM
-
2026-06-15days on market $875,000 Active 74 DOM
-
2026-06-13days on market $875,000 Active 72 DOM
-
2026-06-10days on market $875,000 Active 68 DOM
-
2026-06-08days on market $875,000 Active 67 DOM
-
2026-06-07days on market $875,000 Active 66 DOM
-
2026-06-04days on market $875,000 Active 63 DOM
-
2026-06-01days on market $875,000 Active 60 DOM
-
2026-05-31days on market $875,000 Active 59 DOM
-
2026-04-02$875,000 Active 1000-char remark
Show marketing remark (1000 chars)
CENTRALLY LOCATED INSIDE THE LOOP 610. FIRST FLOOR LIVING, OPEN FLOOR PLAN, GRANITE COUNTERTOPS, KITCHEN FLOOR IS TILED, THE REST OF THE HOUSE HARDWOOD FLOOR. FROM SITTING AREA DOORS OPEN TO LOW MAINTENANCE PATIO/BACKYARD WHICH IS FULLY FENCED. LIVING & DINING AREA ANCHORED BY AN ON TREND FIREPLACE FLANKED BY TWO DOORS ALLOWING FOR GENEROUS NATURAL LIGHT. CENTRAL AIR AND HEAT. NEVER LIVED IN, 4 GOOD SIZE BEDROOMS. ONE BEDROOM COULD BE CONVERTED TO AN EXTRA BATHROOM. FOUNDATION IS PIER BEAM & SLAB. NO HOA, NEVER FLOODED. INSTALLED ALARM SYSTEM & CAMERAS. CONVENIENT LOCATION WITHIN WALKING DISTANCE TO RIVER OAKS SHOPPING CENTER, KROGER SUPERMARKET, POST OFFICE, T.J.MAXX, OFFICEMAX, BARNES & NOBLE BOOKSHOP, RESTAURANTS. GREAT NEIGHBORHOOD! MINUTES TO DOWNTOWN, MIDTOWN, HEIGHTS, MEMORIAL PARK, GALLERIA SHOPPING. CLOSE TO BUFFALO BAYOU WALKING/CYCLING TRAILS & DOG PARK. CONVENIENT FOR MEDICAL CENTER AND UNIVERSITY DISTRICT. EASY ACCESS TO MAJOR HIGHWAYS & DOWNTOWN.
-
2026-04-01historical
-
2025-12-11$925,000 Active
-
2025-12-10historical
-
2025-12-08price $950,000
-
2025-11-24price $955,000
-
2025-11-13price $975,000
-
2025-10-21$995,500 Active
ⓘ Source: listings_history table (triggers on properties + properties_extension) + one-shot
backfill from property_details.listing_events for pre-trigger history.
Tax reassessment forecast TX · Resets to sale price
- Current annual tax
- $13,613 · $1,134/mo
- Projected year-2 tax
- $16,012 · $1,334/mo
- Expected delta
- +$2,400/yr (+$200/mo · 17.6%)
ⓘ Screening estimate from a state-policy table — verify with the county assessor before closing.
Nearby sold comps map
Loading sold comps map…
Walkable amenities ~0.75 mi
Loading nearby amenities…
Taxation est. · year 1
- Rental income
- $95,937
- − Mortgage interest
- −$49,014
- − Property taxes
- −$13,613
- − Insurance
- −$4,375
- − Repairs & maintenance
- −$7,675
- − Management
- −$7,675
- − Depreciation
- −$25,455
- Taxable loss
- −$11,869
- Est. tax savings @ 24.0%
- +$2,849
- After-tax cash flow
- $5,588/yr
For passive investors: Depreciation is non-cash, so a rental often shows a tax loss while cash-flowing — sheltering income. Rental losses are passive: they offset passive income freely, and up to $25,000/yr can offset ordinary (W-2) income if you actively participate and your MAGI is under $100k (phasing out to $0 by $150k); unused losses carry forward. On sale, claimed depreciation is recaptured at up to 25%, and gains may owe capital-gains tax (a 1031 exchange can defer both). Figures are a year-1 estimate at your 24.0% rate — not tax advice; consult a CPA.
Schools (NCES district)
- District
- Houston ISD
- NCES district ID
- 4823640
- Math proficiency
- 27% ▼ -18.00%
- Reading proficiency
- 35% ▼ -6.00%
- Median HH income
- $46,054
- Composite
- 26.63/100
- National rank
- #7173
- State rank
- #593 of 826 in TX
Livability — Houston
- Score
- 74/100
- State rank
- #184
- US rank
- #4771
Category grades
Schools grade is shown separately in the Schools card above.
Census & demographics
- Census place
- Houston, TX
- County
- Harris County · 4,702,590 people
- City population
- 3,226,434
- Metro
- Houston-The Woodlands-Sugar Land, TX
- Population (ZIP)
- 23,708
- Household income
- $116,423
- Rent vs Own
- Severe rent burden
- 1844.0
Population outlook (Harris County) Hauer SSP2
- Today (2025)
- 5,571,493 people
- By 2030
- 6,089,821 · +9.3%
- By 2040
- 7,142,806 · +28.2%
- By 2050
- 8,185,864 · +46.9%
- By 2075
- 10,574,329 · +89.8%
- By 2100
- 12,109,958 · +117.4%
Race, ethnicity, and origin ACS 2023
- Neighborhood character
- Diverse neighborhood (Simpson 0.62)
- Race & ethnicity
- White 57% Hispanic / Latino 18% Two or more races 13% Asian 10% Black 9%
- Hispanic origin (detail)
- Mexican 12% Salvadoran 1%
- Common ancestry
- Lithuanian 4% Romanian 2% Slovak 2%
- Foreign-born
- 17% · Canada, China, Vietnam
- Languages at home
- 77% English-only · Spanish 11% Other Indo-European 4% Chinese 1%
Political lean MEDSL · Harris
- 2024 margin
- Lean D (+5.5) · D 52.0% · R 46.4% · Other 1.6%
- 2008→2024 swing
- +3.9pp toward D · 2008: 1.6pp · 2024: 5.5pp
- All cycles
- 2024: D+5.5 2020: D+13.3 2016: D+12.4 2012: D+0.1 2008: D+1.6
Not yet ingested
- Civics
- —
Market trends
- HPI YoY
- ▼ -131.69%
- Current HPI
- 179.271
- Rent YoY
- ▼ -0.95%
- Metro
- Houston-The Woodlands-Sugar Land, TX
- State GDP YoY
- ▲ 3.95%
- F500 in state
- 110
Industry mix (Fortune 500 HQ in TX)
| Industry | F500 HQs | Revenue |
|---|---|---|
| Energy | 16 | $1,198B |
|
||
| Technology | 5 | $198B |
|
||
| Engineering / Construction | 4 | $72B |
|
||
| Energy Services | 3 | $60B |
|
||
| Utilities | 3 | $41B |
|
||
| Healthcare | 2 | $330B |
|
||
Price history
-12.1% since first listed8 events — show timeline
- 2026-04-02 Listed $875,000 HARMLS
- 2026-04-01 Listing Removed — HARMLS
- 2025-12-11 Listed $925,000 HARMLS
- 2025-12-10 Listing Removed — HARMLS
- 2025-12-08 Price Changed $950,000 HARMLS
- 2025-11-24 Price Changed $955,000 HARMLS
- 2025-11-13 Price Changed $975,000 HARMLS
- 2025-10-21 Listed $995,500 HARMLS
Property tax history
+136.6%/yrLatest (2025): $13,613 · +136.6% YoY. Source: county tax records.
Cash-flow waterfall
monthlySold comps — $/sqft
last 12 mo · ≤1 miLoading sold comps…