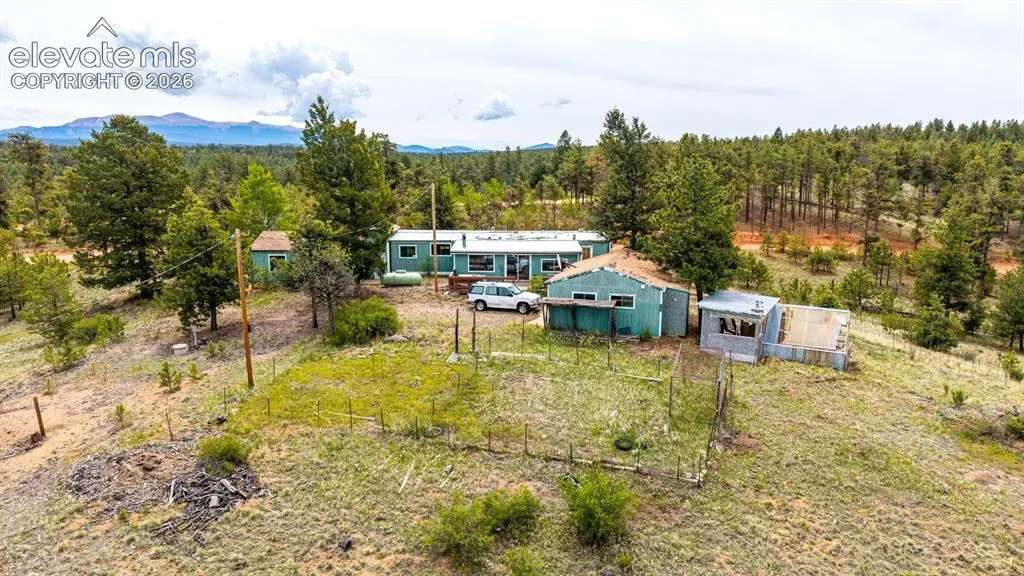
357 County Road 46 · Florissant, CO
Flood risk 1/10 · Minimal
- FEMA flood zone
- X (unshaded)
- Chance of flooding over 30 yrs
- 0.0%
- Est. flood insurance / yr
- $507 – $1,088
Fire risk 8/10 · Major
- Est. fire insurance / yr
- $939 – $1,743
Heat risk 1/10 · Minimal
- Hot days now (above 81°F)
- 7 days/yr
- Hot days in 30 yrs
- 19 days/yr
Wind risk 2/10 · Minimal
- Chance of severe wind over 30 yrs
- —
Air-quality risk 2/10 · Minimal
- Unhealthy air days now
- 0 days/yr
- Unhealthy air days in 30 yrs
- 1 days/yr
Risk factors via First Street. Map © Google.
Why this score? — see what drove the B- grade
The composite is a weighted blend of 9 inputs, each scored 0–100. Each bar is that input's sub-score; the figure is the points it added to the 100-point composite (weight × sub-score).
- Cash flow +30.0/30.0
- DSCR +10.0/10.0
- 1% rule +9.2/10.0
- ARV discount +7.5/15.0
- Schools +3.4/10.0
- Livability +2.9/5.0
- Rent growth +2.5/5.0
- Condition / age +2.5/5.0
- Appreciation +0.0/10.0
$179,900
🖨 Deal sheet 📄 Offer letter ✓ Due diligence
Listing remarks
Some properties are purchased for what they are today. Others are sought after for what they have the potential to become. Bordering Pike National Forest along its western edge, this remarkable 4.53 acre corner parcel in Woodland Park offers an uncommon opportunity to reimagine a mountain retreat against a backdrop of panoramic Colorado scenery. Long enjoyed as a private getaway, the three bedroom, two bathroom ranch style home embraces the classic connected floor plan that defined its era, where the main living room flows naturally into the kitchen to create an inviting sense of continuity. Original millwork lends authentic rustic character while full height cabinetry provides exceptional
Key facts
- Connected floor plan
- Ranch style home
- Original millwork
Tags
Property features AI
Finance
- Financial info: Seller will consider cash terms
- HOA & community: No HOA
Exterior
- Parking: Detached garage with 3 spaces; Garage door opener; Workshop in garage; Gravel driveway
- Utilities: Well water (1 well); Electricity available; Gas available; Cable available; Telephone available
- Home design: Single family property; Double wide mobile home with metal frame; Tied-down mobile foundation; Existing home
- Construction: Wood siding; Composite shingle roof
- Exterior features: Wood deck; Storage shed; Fenced (full); 360-degree views; Borders National Forest; Corner lot; Level lot; Meadow setting; Mountain views; Rural setting; Access to hiking trail
Interior
- Kitchen: Dishwasher; Disposal; Microwave; Gas/Electric range; Refrigerator
- Bedrooms: Main floor bedroom
- Flooring: Carpet; Wood laminate
- Bathrooms: 2 full bathrooms
- Heating & cooling: Forced air heating (propane); No central cooling
- Interior features: 9+ foot ceilings; Skylights; Carpeted entry; Kitchen pantry
- Laundry & utility: Main floor laundry
Neighborhood map
What this means for you Summary
Snapshot
- This is a 3-bed/2.0-bath manufactured listed at $180k.
Deal economics
- At list price, monthly cash flow is $877 ($11k/yr) — positive.
- The deal already cash-flows at list — no discount required.
- Meets the 1% rule at list price ($3k rent vs $180k).
- Cap rate 12.1% vs local median 3.3% in Florissant — top-decile yield for the area; either an underpriced asset or a hidden risk that comps aren't pricing in. Stress-test before assuming the spread holds.
Location & tenants
- Location reads 57/100 on livability (#311 in CO) — a working-class tenant base; expect higher turnover. Strengths: crime A, cost of living A, housing A-; Watch: amenities F, commute F, employment F.
- Woodland Park School District No. Re-2 (town): math 28% / reading 47% proficiency, ranked #29 of 86 in CO (top 34%) — families likely to look elsewhere, expect single-tenant / working-renter base with shorter leases.
- Market conditions: 277 active listings in the ZIP; 148 units permitted in Teller County in 2024 (0 in 5+ unit buildings).
Forward outlook
- Local home prices are declining (-3.0%/yr); year-one equity from $1k of loan paydown is wiped out by about $5k of value loss. Plan a longer hold.
- Teller County population projected at -22% by 2050 — secular population decline; favor cash flow + early exit over multi-decade hold.
- At projected returns (-3.0% appreciation + 3.0% rent growth), your $50k cash investment doubles in ~6 years — after that, you're playing with house money.
Negotiation context
- Only 9 days on market — expect competitive offers; lowballing is unlikely to land.
- Current owner paid $138k; 30% above their basis — modest negotiation headroom, anchor on the comps not their cost.
Risks & watch-outs
- Climate carrying-cost: severe wildfire risk — expect insurance premiums to compound above CPI over the hold.
Questions for the listing agent
- Built in 1971 — when were the roof, HVAC, electrical panel, plumbing, and water heater last replaced?
- Is there a deadline driving the sale (1031 exchange, divorce, estate, relocation)? That informs how much negotiation room exists.
- What's the average days-on-market for RENTAL listings here right now (not sales)? A rising rental-DOM trend means longer vacancies and softer asking-rent achievability than the comps imply.
- What's the recent tenant-quality profile in this submarket — average credit score on applications, eviction rate, late-payment / NSF rate, and stable-employment percentage? A property-management company in the area should have these aggregated.
- How much new for-sale + rental construction is in the pipeline within 1–3 miles? Heavy new supply typically softens prices + rents 12–24 months out; constrained supply supports both.
Investment metrics
- 1% rule
- 1.42% ✓
- Cap rate
- 12.14%
- Cash-on-cash
- 20.88%
- DSCR
- 1.93
- GRM
- 5.9
CMA / ARV
No comps found within radius.
Projected returns pro-forma
-3.0% appreciation · 3.0% rent growth · sell at horizon
- IRR
- 13.3%
- Equity multiple
- 1.53×
- Total profit
- $26,654
- Equity at exit
- $26,824
- IRR
- 22.1%
- Equity multiple
- 2.89×
- Total profit
- $94,991
- Equity at exit
- $15,554
Cash invested: $50,372 (down + closing). Projections, not guarantees.
Landlord ↔ Tenant lean methodology
- Overall (STATE)
- 38 Tenant-Leaning
- State Colorado
- 38 Tenant-Leaning · D+4
- County
- — inherits STATE
- City
- — inherits STATE
ZIP-level market 80816
- Home prices YoY
- -18.1%
- Active inventory
- 277
- Price-to-rent
- 5.9×
Monthly cashflow live
- Estimated rent
- $2,547 medium interval (Pro) →
- Mortgage (P&I)
- −$943
- Tax from tax record
- −$117 /mo · $1,408/yr
- Insurance
- −$75
- HOA
- −$0
- Vacancy / Maint / Mgmt
- −$535
- Net cashflow
- $877
Break-even live
UW: 25.0% down · 7.5% · 30yr · 1.5% tax · 5.0% vac · 8.0% maint · 8.0% mgmt
Financing live
Cash to close
- Down payment
- $44,975
- Closing costs
- $5,397
- Reserves months
- —
- Total cash needed
- —
Loan-product check · same deal, 3 products live
Conventional
25% down · 7.5% · 30yr
- Down + closing
- —
- Monthly P&I
- —
- Monthly cashflow
- —
- DSCR
- —
- Eligible?
- —
Personal DTI + credit; lowest rate.
DSCR
20% down · 8.5% · 30yr
- Down + closing
- —
- Monthly P&I
- —
- Monthly cashflow
- —
- DSCR
- —
- Eligible?
- —
No personal income docs; deal must DSCR.
Hard money
10% down · 12.0% · 12mo
- Down + closing
- —
- Monthly P&I
- —
- Monthly cashflow
- —
- DSCR
- —
- Eligible?
- —
Short-term bridge; refi at stabilization.
Listing history 9 events
-
2026-06-18days on market $179,900 Active 9 DOM
-
2026-06-18status $179,900 Active 8 DOM
-
2026-06-17days on market $179,900 Under Contract - Showing 8 DOM
-
2026-06-16days on market $179,900 Under Contract - Showing 7 DOM
-
2026-06-15days on market $179,900 Under Contract - Showing 6 DOM
-
2026-06-14days on market $179,900 Under Contract - Showing 4 DOM
-
2026-06-13statusdays on market $179,900 Under Contract - Showing 3 DOM
-
2026-06-10remarks 699-char remark
-
2026-06-10$179,900 Active 1 DOM
ⓘ Source: listings_history table (triggers on properties + properties_extension) + one-shot
backfill from property_details.listing_events for pre-trigger history.
Tax reassessment forecast CO · Resets to sale price
- Current annual tax
- $1,408 · $117/mo
- Projected year-2 tax
- $1,408 · $117/mo
- Expected delta
- $0/yr ($0/mo · 0.0%)
ⓘ Screening estimate from a state-policy table — verify with the county assessor before closing.
Climate risk First Street
- Flood 1/10 Low FEMA zone X (unshaded) · 0% chance over 30 yrs
- Wildfire 8/10 Severe
- Heat 1/10 Low 7 d/yr ≥81°F today · 19 d/yr by 30 yrs out
- Wind 2/10 Low
- Air quality 2/10 Low 0 unhealthy d/yr today · 1 by 30 yrs out
Nearby sold comps map
Loading sold comps map…
Walkable amenities ~0.75 mi
Loading nearby amenities…
Taxation est. · year 1
- Rental income
- $30,567
- − Mortgage interest
- −$10,077
- − Property taxes
- −$1,408
- − Insurance
- −$900
- − Repairs & maintenance
- −$2,445
- − Management
- −$2,445
- − Depreciation
- −$5,233
- Taxable income
- $8,058
- Est. tax owed @ 24.0%
- −$1,934
- After-tax cash flow
- $8,586/yr
For passive investors: Depreciation is non-cash, so a rental often shows a tax loss while cash-flowing — sheltering income. Rental losses are passive: they offset passive income freely, and up to $25,000/yr can offset ordinary (W-2) income if you actively participate and your MAGI is under $100k (phasing out to $0 by $150k); unused losses carry forward. On sale, claimed depreciation is recaptured at up to 25%, and gains may owe capital-gains tax (a 1031 exchange can defer both). Figures are a year-1 estimate at your 24.0% rate — not tax advice; consult a CPA.
Schools (NCES district)
- District
- Woodland Park School District No. Re-2
- NCES district ID
- 0807380
- Math proficiency
- 28% ▼ -3.00%
- Reading proficiency
- 47% ▼ -2.00%
- Median HH income
- $63,920
- Composite
- 33.68/100
- National rank
- #5385
- State rank
- #29 of 86 in CO
Livability — Florissant
- Score
- 57/100
- State rank
- #311
- US rank
- #22011
Category grades
Schools grade is shown separately in the Schools card above.
Census & demographics
- Population (ZIP)
- 6,372
Population outlook (Teller County) Hauer SSP2
- Today (2025)
- 22,404 people
- By 2030
- 21,527 · -3.9%
- By 2040
- 19,356 · -13.6%
- By 2050
- 17,462 · -22.1%
- By 2075
- 14,658 · -34.6%
- By 2100
- 11,982 · -46.5%
Race, ethnicity, and origin ACS 2023
- Neighborhood character
- Predominantly White (88%)
- Race & ethnicity
- White 88% Two or more races 6% Hispanic / Latino 5%
- Common ancestry
- Lithuanian 6% Slovak 5% Italian 3%
- Foreign-born
- 1% · Canada
- Languages at home
- 96% English-only · Spanish 2% French/Haitian/Cajun 1%
Political lean MEDSL · Teller
- 2024 margin
- Solid R (+35.5) · D 31.0% · R 66.5% · Other 2.5%
- 2008→2024 swing
- -7.3pp toward R · 2008: -28.1pp · 2024: -35.5pp
- All cycles
- 2024: R+35.5 2020: R+35.2 2016: R+42.5 2012: R+33.1 2008: R+28.1
Not yet ingested
- Civics
- —
Market trends
- HPI YoY
- ▼ -73.52%
- Current HPI
- 332.3075
- Rent YoY
- —
- Metro
- —
- State GDP YoY
- ▲ 1.95%
- F500 in state
- 14
Industry mix (Fortune 500 HQ in CO)
| Industry | F500 HQs | Revenue |
|---|---|---|
| Technology Distribution | 1 | $31B |
|
||
| Food / Agriculture | 1 | $18B |
|
||
| Packaging | 1 | $14B |
|
||
| Healthcare | 1 | $13B |
|
||
| Energy | 1 | $10B |
|
||
| Technology | 1 | $4B |
|
||
Price history
+9.0% since first listed3 events — show timeline
- 2026-06-09 Listed $179,900 elevateMLS
- 2012-10-09 Sold (Public Records) $138,421 Public Records
- 2002-05-30 Sold (Public Records) $165,000 Public Records
Property tax history
+6.3%/yrLatest (2025): $1,408 · +29.0% YoY. Source: county tax records.
Cash-flow waterfall
monthlySold comps — $/sqft
last 12 mo · ≤1 miLoading sold comps…