2240 Dr Martin Luther King Jr Blvd · Pompano Beach, FL
Flood risk 1/10 · Minimal
- FEMA flood zone
- X (shaded)
- Chance of flooding over 30 yrs
- 0.0%
- Est. flood insurance / yr
- $507 – $1,088
Fire risk 1/10 · Minimal
- Est. fire insurance / yr
- $947 – $1,759
Heat risk 9/10 · Severe
- Hot days now (above 107°F)
- 6 days/yr
- Hot days in 30 yrs
- 21 days/yr
Wind risk 10/10 · Severe
- Chance of severe wind over 30 yrs
- 99.0%
Air-quality risk 3/10 · Minor
- Unhealthy air days now
- 3 days/yr
- Unhealthy air days in 30 yrs
- 3 days/yr
Risk factors via First Street. Map © Google.
Why this score? — see what drove the B grade
The composite is a weighted blend of 9 inputs, each scored 0–100. Each bar is that input's sub-score; the figure is the points it added to the 100-point composite (weight × sub-score).
- Cash flow +30.0/30.0
- 1% rule +10.0/10.0
- DSCR +10.0/10.0
- ARV discount +7.5/15.0
- Schools +4.1/10.0
- Livability +3.7/5.0
- Appreciation +3.4/10.0
- Condition / age +2.5/5.0
- Rent growth +2.4/5.0
$106,660
🖨 Deal sheet 📄 Offer letter ✓ Due diligence
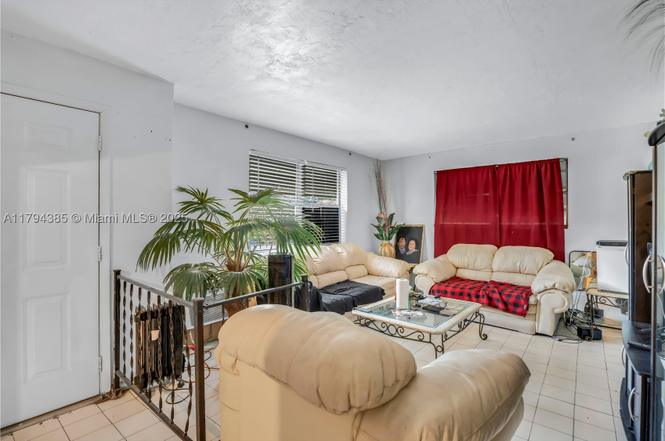
Listing remarks
Charming single-family home with new roof, included in a rare 3-parcel package offered in Pompano Beach for a total price of $2.4M. Property is being sold together with a church and adjacent vacant land, totaling 30,293 SF. WILL NOT BE SOLD SEPERATELY! Located on a high-visibility corridor zoned B-3, offering exceptional flexibility for redevelopment, live-work use, or investment. Home interior requires updates—ideal opportunity to renovate, expand, or incorporate into a broader commercial or mixed-use vision. Close to major highways, schools, and growing development zones. Property will not be sold separately. Showings by appointment with notice and NDA.
Key facts
- Zoned b-3
- New roof
- 0.26 acre lot
Tags
Neighborhood map
What this means for you Summary
Snapshot
- This is a 3-bed/2.0-bath single-family listed at $107k.
Deal economics
- At list price, monthly cash flow is $2k ($20k/yr) — positive.
- The deal already cash-flows at list — no discount required.
- Meets the 1% rule at list price ($3k rent vs $107k).
- Cap rate 25.2% vs local median 3.1% in Pompano Beach — top-decile yield for the area; either an underpriced asset or a hidden risk that comps aren't pricing in. Stress-test before assuming the spread holds.
Location & tenants
- Location reads 74/100 on livability (#284 in FL, #4,541 nationally) — a middle-class / working-renter tenant base. Strengths: commute A+, housing A+, cost of living B+; Watch: schools D+, employment D+, amenities F.
- Broward (suburban): math 42% / reading 53% proficiency, ranked #46 of 73 in FL (top 63%) — families likely to look elsewhere, expect single-tenant / working-renter base with shorter leases.
- Market conditions: Rents soft (-0.3%/yr); 438 active listings in the ZIP; 40 comparable units currently listed for rent nearby; rentals at typical pace (median 25d on market — plan ~3-4 weeks tenant-placement turnaround); 2,111 units permitted in Broward County in 2024 (1,265 in 5+ unit buildings).
- At $2,962/mo this rent would consume 60% of the median local household income ($60k/yr) (locally 1670% of renters already pay >50% of income on rent) — very limited rent-growth headroom before tenants either downsize or default.
Forward outlook
- Local home prices are declining (-3.0%/yr); year-one equity from $737 of loan paydown is wiped out by about $3k of value loss. Plan a longer hold.
- Broward County population projected at +34% by 2050 — long-run rental-demand tailwind backs the buy-and-hold thesis.
- At projected returns (-3.0% appreciation + 0.0% rent growth), your $30k cash investment doubles in ~2 years — after that, you're playing with house money.
Negotiation context
- Only 8 days on market — expect competitive offers; lowballing is unlikely to land.
- Current owner paid $12k; list at $107k implies a 789% gain — meaningful room to come down on a strong offer.
Risks & watch-outs
- Climate carrying-cost: severe wind risk, 99% chance of damaging wind over 30y; extreme-heat days projected 6→21/yr by 2055 (HVAC capex compounding) — expect insurance premiums to compound above CPI over the hold.
Questions for the listing agent
- Is there a deadline driving the sale (1031 exchange, divorce, estate, relocation)? That informs how much negotiation room exists.
- Schools are D-rated, which usually means shorter tenancies and higher turnover. Who's the typical renter profile here, and what's been the actual vacancy rate?
- What's the average days-on-market for RENTAL listings here right now (not sales)? A rising rental-DOM trend means longer vacancies and softer asking-rent achievability than the comps imply.
- What's the recent tenant-quality profile in this submarket — average credit score on applications, eviction rate, late-payment / NSF rate, and stable-employment percentage? A property-management company in the area should have these aggregated.
- How much new for-sale + rental construction is in the pipeline within 1–3 miles? Heavy new supply typically softens prices + rents 12–24 months out; constrained supply supports both.
Investment metrics
- 1% rule
- 2.78% ✓
- Cap rate
- 25.18%
- Cash-on-cash
- 67.45%
- DSCR
- 4.00
- GRM
- 3.0
CMA / ARV
- ARV (on-the-fly)
- $387,464
- Comps found
- 1
Show comp detail 1 sale within ~0.75 mi
| Address | Dist | Beds/Ba | Sqft | Sold | Price | $/sf | Match |
|---|---|---|---|---|---|---|---|
| 1901 NW 4th St | 0.62mi | 3/2.0 | 1,395 (+11%) | 11mo | $430,000 | $308 | 44 |
Match score weights: distance 35% · size 25% · config 20% · recency 20%. Top-matched comps best support the ARV.
Projected returns pro-forma
-3.0% appreciation · 0.0% rent growth · sell at horizon
- IRR
- 63.5%
- Equity multiple
- 3.71×
- Total profit
- $80,942
- Equity at exit
- $15,903
- IRR
- 67.0%
- Equity multiple
- 6.85×
- Total profit
- $174,591
- Equity at exit
- $9,222
Cash invested: $29,865 (down + closing). Projections, not guarantees.
Landlord ↔ Tenant lean methodology
- Overall (STATE)
- 87 Strongly Landlord-Friendly
- State Florida
- 87 Strongly Landlord-Friendly · R+3
- County
- — inherits STATE
- City
- — inherits STATE
ZIP-level market 33069
- Home prices YoY
- -1.1%
- Rents YoY
- -0.3%
- Active inventory
- 438
- Price-to-rent
- 3.0×
Monthly cashflow live
- Estimated rent
- $2,962 high interval (Pro) →
- Mortgage (P&I)
- −$559
- Tax from tax record
- −$58 /mo · $691/yr
- Insurance
- −$44
- HOA
- −$0
- Vacancy / Maint / Mgmt
- −$622
- Net cashflow
- $1,679
Break-even live
UW: 25.0% down · 7.5% · 30yr · 1.5% tax · 5.0% vac · 8.0% maint · 8.0% mgmt
Financing live
Cash to close
- Down payment
- $26,665
- Closing costs
- $3,200
- Reserves months
- —
- Total cash needed
- —
Loan-product check · same deal, 3 products live
Conventional
25% down · 7.5% · 30yr
- Down + closing
- —
- Monthly P&I
- —
- Monthly cashflow
- —
- DSCR
- —
- Eligible?
- —
Personal DTI + credit; lowest rate.
DSCR
20% down · 8.5% · 30yr
- Down + closing
- —
- Monthly P&I
- —
- Monthly cashflow
- —
- DSCR
- —
- Eligible?
- —
No personal income docs; deal must DSCR.
Hard money
10% down · 12.0% · 12mo
- Down + closing
- —
- Monthly P&I
- —
- Monthly cashflow
- —
- DSCR
- —
- Eligible?
- —
Short-term bridge; refi at stabilization.
Rent comps 40 comps
| Address | Beds | Baths | Sqft | Rent | $/sqft | DOM | Units | Dist |
|---|---|---|---|---|---|---|---|---|
| 2350 NW 12th Ct Pompano Beach, FL | 4.0 | 3.0 | 1319 | $4,114 | $3.12 | 11d | 1 | 0.11mi |
| 990 Powerline Rd Pompano Beach, FL | 1.0–2.0 | 1.0–2.0 | 833 | $2,388 | $2.87 | 2d | 14 | 0.15mi |
| 1880 NW 8th St Pompano Beach, FL | 3.0 | 2.0 | 1539 | $3,400 | $2.21 | 21d | 1 | 0.37mi |
| 1880 NW 8th St Unit 1880 Pompano Beach, FL | 3.0 | 2.0 | 1539 | $3,400 | $2.21 | 5d | 1 | 0.37mi |
| 2321 NW 6th St Pompano Beach, FL | 3.0 | 2.0 | 1404 | $3,300 | $2.35 | 24d | 1 | 0.41mi |
| 1305 NW 27th Ave Pompano Beach, FL | 3.0 | 2.5 | 1348 | $2,999 | $2.22 | 24d | 1 | 0.43mi |
| 1313 NW 27th Ave Pompano Beach, FL | 3.0 | 2.5 | 1348 | $3,200 | $2.37 | 24d | 1 | 0.43mi |
| 2691 NW 8th St Pompano Beach, FL | 4.0 | 2.0 | 1200 | $2,950 | $2.46 | 5d | 1 | 0.46mi |
| 2143 NW 4th St Unit 2 Pompano Beach, FL | 3.0 | 2.5 | 1415 | $3,200 | $2.26 | 24d | 1 | 0.55mi |
| 2713 NW 6th St Pompano Beach, FL | 3.0 | 2.0 | 1283 | $3,250 | $2.53 | 8d | 1 | 0.60mi |
| 2713 NW 6th St Pompano Beach, FL | 3.0 | 2.0 | 1283 | $3,250 | $2.53 | 24d | 1 | 0.60mi |
| 480 NW 27th Ave Pompano Beach, FL | 2.0 | 2.5 | 1260 | $2,800 | $2.22 | 24d | 1 | 0.62mi |
| 2900 NW 8th St Pompano Beach, FL | 3.0 | 2.0 | 1144 | $2,600 | $2.27 | 24d | 1 | 0.64mi |
| 635 NW 30th Ave Pompano Beach, FL | 3.0 | 2.5 | 1348 | $2,999 | $2.22 | 3d | 1 | 0.76mi |
| 2720 NW 2nd St Pompano Beach, FL | 3.0 | 2.0 | 1210 | $2,700 | $2.23 | 24d | 1 | 0.82mi |
| 650 NW 30th Ave Pompano Beach, FL | 3.0 | 2.5 | 1428 | $3,087 | $2.16 | 2d | 7 | 0.83mi |
| 355 NW 30th Ave Unit 0601 Pompano Beach, FL | 3.0 | 2.5 | 1348 | $3,275 | $2.43 | 24d | 1 | 0.89mi |
| 355 NW 30th Ter Pompano Beach, FL | 3.0 | 3.0 | 1355 | $3,275 | $2.42 | 11d | 1 | 0.89mi |
| 305 NW 30th Ave Unit 305 Pompano Beach, FL | 3.0 | 2.5 | 1348 | $2,999 | $2.22 | 24d | 1 | 0.90mi |
| 374 NW 31st Ave Pompano Beach, FL | 3.0 | 1.0 | 1066 | $2,600 | $2.44 | 24d | 1 | 0.98mi |
| 1605 Abaco Dr Coconut Creek, FL | 2.0 | 2.0 | 1362 | $2,200 | $1.61 | 24d | 2 | 1.03mi |
| 2829 N Course Dr #104 Pompano Beach, FL | 2.0 | 2.0 | 1020 | $1,950 | $1.91 | 21d | 1 | 1.07mi |
| 1601 Abaco Dr Unit F2 Coconut Creek, FL | 2.0 | 2.0 | 1275 | $2,099 | $1.65 | 12d | 1 | 1.09mi |
| 1501 Cayman Way Unit C4 Coconut Creek, FL | 2.0 | 2.0 | 1225 | $1,850 | $1.51 | 24d | 1 | 1.11mi |
| 4301 Martinique Cir Unit K1 Coconut Creek, FL | 2.0 | 2.0 | 1156 | $2,000 | $1.73 | 24d | 1 | 1.14mi |
| 1904 Bermuda Cir Unit G3 Coconut Creek, FL | 2.0 | 2.0 | 1000 | $1,600 | $1.60 | 24d | 1 | 1.14mi |
| 1212 Bahama Bnd Coconut Creek, FL | 2.0 | 2.0 | 938 | $2,000 | $2.13 | 24d | 1 | 1.16mi |
| 2801 N Course Dr Pompano Beach, FL | 1.0–2.0 | 1.0–2.0 | 991 | $2,325 | $2.35 | 24d | 12 | 1.17mi |
| 2803 N Course Dr #203 Pompano Beach, FL | 2.0 | 2.0 | 1120 | $2,100 | $1.88 | 21d | 1 | 1.19mi |
| 2803 N Course Dr #203 Pompano Beach, FL | 2.0 | 2.0 | 1120 | $2,050 | $1.83 | 4d | 1 | 1.19mi |
| 1203 Bahama Bnd Coconut Creek, FL | 2.0–3.0 | 2.0 | 1005 | $2,000 | $1.99 | 17d | 2 | 1.21mi |
| 4401 Martinique Ct Unit B2 Coconut Creek, FL | 2.0 | 2.0 | 1156 | $2,750 | $2.38 | 24d | 1 | 1.21mi |
| 455 NW 33rd Ln Pompano Beach, FL | 3.0 | 3.0 | 1800 | $3,700 | $2.06 | 24d | 1 | 1.22mi |
| 100 NW 33rd Ave Pompano Beach, FL | 1.0–3.0 | 1.0–2.0 | 1078 | $3,362 | $3.12 | 24d | 35 | 1.23mi |
| 100 NW 33rd Ave Pompano Beach, FL | 1.0–3.0 | 1.0–2.0 | 1078 | $3,503 | $3.25 | 2d | 20 | 1.23mi |
| 920 NW 8th Ave Unit 3 Pompano Beach, FL | 2.0 | 1.5 | 1150 | $1,900 | $1.65 | 11d | 1 | 1.25mi |
| 2900 N Course Dr #107 Pompano Beach, FL | 2.0 | 2.0 | 1216 | $2,150 | $1.77 | 15d | 1 | 1.25mi |
| 2900 N Course Dr #208 Pompano Beach, FL | 3.0 | 2.5 | 1620 | $2,695 | $1.66 | 19d | 1 | 1.25mi |
| 939 NW 3rd St Unit 939 Pompano Beach, FL | 3.0 | 2.5 | 1597 | $3,300 | $2.07 | 24d | 1 | 1.25mi |
| 3392 NW 5th St Pompano Beach, FL | 3.0 | 2.5 | 1446 | $3,550 | $2.46 | 3d | 1 | 1.26mi |
Listing history 4 events
-
2025-05-10status Pending
-
2025-05-02price $106,660
-
2025-05-01$1 Active
-
1983-09-01soldstatus $12,000
ⓘ Source: listings_history table (triggers on properties + properties_extension) + one-shot
backfill from property_details.listing_events for pre-trigger history.
Tax reassessment forecast FL · Resets to sale price
- Current annual tax
- $691 · $58/mo
- Projected year-2 tax
- $885 · $74/mo
- Expected delta
- +$194/yr (+$16/mo · 28.1%)
ⓘ Screening estimate from a state-policy table — verify with the county assessor before closing.
Climate risk First Street
- Flood 1/10 Low FEMA zone X (shaded) · 0% chance over 30 yrs
- Wildfire 1/10 Low
- Heat 9/10 Extreme 6 d/yr ≥107°F today · 21 d/yr by 30 yrs out
- Wind 10/10 Extreme 99% chance of damaging wind over 30 yrs
- Air quality 3/10 Moderate 3 unhealthy d/yr today · 3 by 30 yrs out
Nearby sold comps map
Loading sold comps map…
Walkable amenities ~0.75 mi
Loading nearby amenities…
Taxation est. · year 1
- Rental income
- $35,543
- − Mortgage interest
- −$5,975
- − Property taxes
- −$691
- − Insurance
- −$533
- − Repairs & maintenance
- −$2,843
- − Management
- −$2,843
- − Depreciation
- −$3,103
- Taxable income
- $19,554
- Est. tax owed @ 24.0%
- −$4,693
- After-tax cash flow
- $15,450/yr
For passive investors: Depreciation is non-cash, so a rental often shows a tax loss while cash-flowing — sheltering income. Rental losses are passive: they offset passive income freely, and up to $25,000/yr can offset ordinary (W-2) income if you actively participate and your MAGI is under $100k (phasing out to $0 by $150k); unused losses carry forward. On sale, claimed depreciation is recaptured at up to 25%, and gains may owe capital-gains tax (a 1031 exchange can defer both). Figures are a year-1 estimate at your 24.0% rate — not tax advice; consult a CPA.
Schools (NCES district)
- District
- Broward
- NCES district ID
- 1200180
- Math proficiency
- 42% ▼ -18.00%
- Reading proficiency
- 53% ▼ -5.00%
- Median HH income
- $52,139
- Composite
- 40.88/100
- National rank
- #3621
- State rank
- #46 of 73 in FL
Livability — Pompano Beach
- Score
- 74/100
- State rank
- #284
- US rank
- #4541
Category grades
Schools grade is shown separately in the Schools card above.
Census & demographics
- Census place
- Pompano Beach, FL
- County
- Broward County · 1,963,430 people
- City population
- 155,861
- Metro
- Miami-Fort Lauderdale-Pompano Beach, FL
- Population (ZIP)
- 29,145
- Household income
- $59,683
- Rent vs Own
- Severe rent burden
- 1670.0
Population outlook (Broward County) Hauer SSP2
- Today (2025)
- 2,207,033 people
- By 2030
- 2,360,704 · +7.0%
- By 2040
- 2,661,208 · +20.6%
- By 2050
- 2,946,698 · +33.5%
- By 2075
- 3,602,273 · +63.2%
- By 2100
- 3,970,984 · +79.9%
Race, ethnicity, and origin ACS 2023
- Neighborhood character
- Highly diverse neighborhood (Simpson 0.72)
- Race & ethnicity
- Black 33% White 32% Hispanic / Latino 26% Two or more races 21% Asian 3%
- Hispanic origin (detail)
- Mexican 5% Puerto Rican 3% Cuban 3% Dominican 2%
- Common ancestry
- Hispanic 9% Estonian 2% Romanian 2%
- Foreign-born
- 33% · Canada, Jamaica
- Languages at home
- 61% English-only · Spanish 23% French/Haitian/Cajun 9% Other Indo-European 5%
Political lean MEDSL · Broward
- 2024 margin
- D (+17.0) · D 58.0% · R 41.0%
- 2008→2024 swing
- -17.8pp toward R · 2008: 34.7pp · 2024: 17.0pp
- All cycles
- 2024: D+17.0 2020: D+29.8 2016: D+35.0 2012: D+34.9 2008: D+34.7
Not yet ingested
- Civics
- —
Market trends
- HPI YoY
- ▼ -3.16%
- Current HPI
- 297.1774
- Rent YoY
- ▼ -0.29%
- Metro
- Miami-Fort Lauderdale-Pompano Beach, FL
- State GDP YoY
- ▲ 3.28%
- F500 in state
- 36
Industry mix (Fortune 500 HQ in FL)
| Industry | F500 HQs | Revenue |
|---|---|---|
| Industrial Technology | 2 | $29B |
|
||
| Insurance | 2 | $17B |
|
||
| Retail | 1 | $60B |
|
||
| Technology Distribution | 1 | $58B |
|
||
| Homebuilding | 1 | $35B |
|
||
| Technology Manufacturing | 1 | $35B |
|
||
Price history
+788.8% since first listed4 events — show timeline
- 2025-05-10 Pending — MARMLS
- 2025-05-02 Price Changed $106,660 MARMLS
- 2025-05-01 Listed $1 MARMLS
- 1983-09-01 Sold (Public Records) $12,000 Public Records
Property tax history
-0.0%/yrLatest (2025): $691 · +6.6% YoY. Source: county tax records.
Cash-flow waterfall
monthlySold comps — $/sqft
last 12 mo · ≤1 miLoading sold comps…