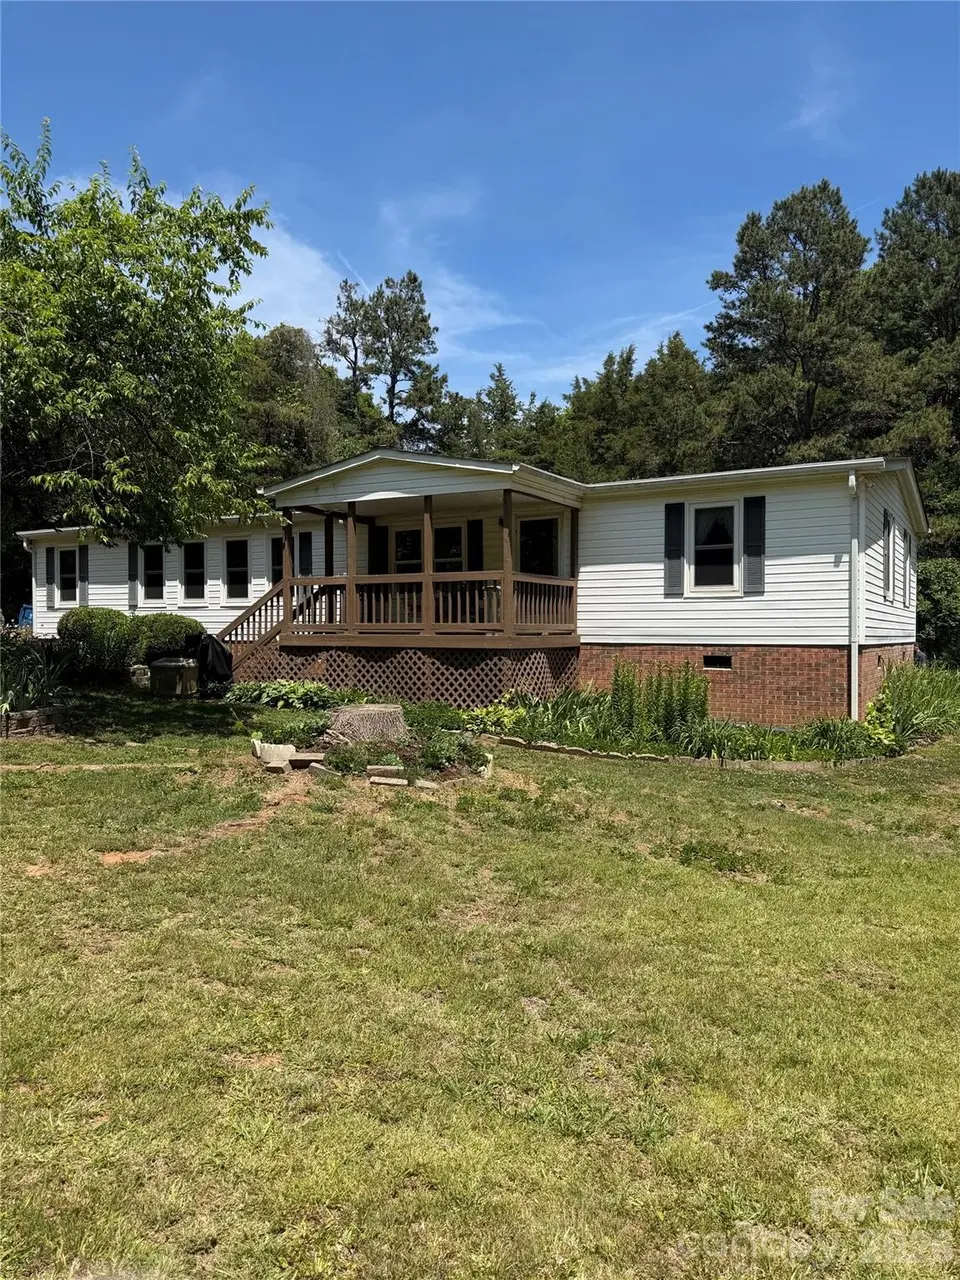
10372 Singletree Ln #21 · Kannapolis, NC
Flood risk 1/10 · Minimal
- FEMA flood zone
- X (unshaded)
- Chance of flooding over 30 yrs
- 0.0%
- Est. flood insurance / yr
- $507 – $1,088
Fire risk 4/10 · Minor
- Est. fire insurance / yr
- $906 – $1,684
Heat risk 5/10 · Moderate
- Hot days now (above 105°F)
- 7 days/yr
- Hot days in 30 yrs
- 17 days/yr
Wind risk 4/10 · Minor
- Chance of severe wind over 30 yrs
- 11.0%
Air-quality risk 3/10 · Minor
- Unhealthy air days now
- 2 days/yr
- Unhealthy air days in 30 yrs
- 4 days/yr
Risk factors via First Street. Map © Google.
Why this score? — see what drove the C+ grade
The composite is a weighted blend of 9 inputs, each scored 0–100. Each bar is that input's sub-score; the figure is the points it added to the 100-point composite (weight × sub-score).
- Cash flow +20.9/30.0
- ARV discount +15.0/15.0
- DSCR +6.7/10.0
- 1% rule +5.5/10.0
- Schools +4.7/10.0
- Rent growth +3.5/5.0
- Livability +3.2/5.0
- Condition / age +2.8/5.0
- Appreciation +0.0/10.0
$225,000
🖨 Deal sheet 📄 Offer letter ✓ Due diligence
Listing remarks
Charming country living with convenience close by! This 3 bedroom home is situated on a lovely 1-acre lot in a peaceful, rural setting on a private cul-de-sac, while also offering convenient access to I-77, downtown Davidson, and Lake Norman. Inside, you'll find an open floor plan with spacious living areas and great natural light. While some updates could make it truly shine, everything is in working order and ready for its next owner. Recent improvements include a new well, a brand-new side porch, and LVP flooring throughout the laundry room and kitchen. Outside has plenty of space for gardening, entertaining, or simply just relaxing. Come see the possibilities this property has to offer!
Key facts
- 1.01 acre lot
- Built 1997
- Listed 2 days
Property features AI
Finance
- HOA & community: No HOA
Exterior
- Parking: Driveway parking; 4 open parking spaces
- Security: Smoke detectors; Carbon monoxide detector(s)
- Utilities: Well water; Septic system
- Home design: Manufactured doublewide single-family residence; One story; Crawl space foundation
- Construction: Manufactured construction; Vinyl exterior
- Exterior features: Covered front, rear and side porches; Patios/porches include front porch, rear porch and side porch; Fire pit; Shed(s); Located on a cul-de-sac; Gravel and concrete road access on a privately maintained road
Interior
- Kitchen: Electric cooktop; Electric oven
- Bedrooms: 3 bedrooms (all on the main level)
- Flooring: Carpet; Vinyl
- Bathrooms: 2 full bathrooms (main level)
- Heating & cooling: Heat pump heating; Central air conditioning
- Interior features: Open floor plan; Garden tub; Ceiling fan(s); Wood-burning fireplace in the great room
- Laundry & utility: Laundry room with washer and electric dryer hookups
Neighborhood map
What this means for you Summary
Snapshot
- This is a 3-bed/2.0-bath single-family listed at $225k. Condition is rated average.
Deal economics
- At list price, monthly cash flow is $314 ($4k/yr) — positive.
- The deal already cash-flows at list — no discount required.
- Meets the 1% rule at list price ($2k rent vs $225k).
- Cap rate 8.0% vs local median 3.5% in Kannapolis — top-decile yield for the area; either an underpriced asset or a hidden risk that comps aren't pricing in. Stress-test before assuming the spread holds.
Location & tenants
- Location reads 64/100 on livability (#354 in NC) — a middle-class / working-renter tenant base. Strengths: cost of living A+, housing A+, crime B; Watch: employment D+, amenities F, commute F.
- Cabarrus County Schools (rural): math 54% / reading 55% proficiency, ranked #44 of 178 in NC (top 25%) — acceptable for families but not a draw, mixed tenant base, ~2y average lease.
- Zoned schools: Charles E Boger Elementary (math 52% / reading 48%, grade D+, #409 of 1,410 statewide, top 29%, 870 students, 46% FRL); Northwest Cabarrus High (math 74% / reading 72%, grade B+, #100 of 535 statewide, top 19%, 1,138 students, 35% FRL) — zoned schools at 40% FRL track the district average.
- Market conditions: Rents rising (+3.9%/yr); 243 active listings in the ZIP; high-income renter base; 2,485 units permitted in Cabarrus County in 2024 (677 in 5+ unit buildings).
Forward outlook
- Local home prices are declining (-3.0%/yr); year-one equity from $2k of loan paydown is wiped out by about $7k of value loss. Plan a longer hold.
- Cabarrus County population projected at +44% by 2050 — long-run rental-demand tailwind backs the buy-and-hold thesis.
Negotiation context
- Only 2 days on market — expect competitive offers; lowballing is unlikely to land.
Risks & watch-outs
- Climate carrying-cost: extreme-heat days projected 7→17/yr by 2055 (HVAC capex compounding) — expect insurance premiums to compound above CPI over the hold.
Questions for the listing agent
- Is there a deadline driving the sale (1031 exchange, divorce, estate, relocation)? That informs how much negotiation room exists.
- Schools are F-rated, which usually means shorter tenancies and higher turnover. Who's the typical renter profile here, and what's been the actual vacancy rate?
- What's the average days-on-market for RENTAL listings here right now (not sales)? A rising rental-DOM trend means longer vacancies and softer asking-rent achievability than the comps imply.
- What's the recent tenant-quality profile in this submarket — average credit score on applications, eviction rate, late-payment / NSF rate, and stable-employment percentage? A property-management company in the area should have these aggregated.
- How much new for-sale + rental construction is in the pipeline within 1–3 miles? Heavy new supply typically softens prices + rents 12–24 months out; constrained supply supports both.
Investment metrics
- 1% rule
- 1.05% ✓
- Cap rate
- 7.97%
- Cash-on-cash
- 5.99%
- DSCR
- 1.27
- GRM
- 7.9
CMA / ARV
- ARV (on-the-fly)
- $284,970
- Comps found
- 3
Show comp detail 3 sales within ~0.75 mi
| Address | Dist | Beds/Ba | Sqft | Sold | Price | $/sf | Match |
|---|---|---|---|---|---|---|---|
| 10372 Turnplow Dr | 0.08mi | 3/2.0 | 1,560 (-3%) | 3mo | $300,000 | $192 | 89 |
| 10393 Turnplow Dr | 0.15mi | 3/2.0 | 1,652 (+3%) | 23mo | $275,000 | $166 | 70 |
| 10386 Turnplow Dr | 0.16mi | 3/2.0 | 1,782 (+11%) | 14mo | $315,000 | $177 | 63 |
Match score weights: distance 35% · size 25% · config 20% · recency 20%. Top-matched comps best support the ARV.
Projected returns pro-forma
-3.0% appreciation · 3.87% rent growth · sell at horizon
- IRR
- -6.1%
- Equity multiple
- 0.77×
- Total profit
- $-14,306
- Equity at exit
- $33,548
- IRR
- 4.6%
- Equity multiple
- 1.35×
- Total profit
- $22,204
- Equity at exit
- $19,454
Cash invested: $63,000 (down + closing). Projections, not guarantees.
Landlord ↔ Tenant lean methodology
- Overall (STATE)
- 85 Strongly Landlord-Friendly
- State North Carolina
- 85 Strongly Landlord-Friendly · R+3
- County
- — inherits STATE
- City
- — inherits STATE
ZIP-level market 28036
- Rents YoY
- 3.9%
- Active inventory
- 243
- Price-to-rent
- 7.9×
Monthly cashflow live
- Estimated rent
- $2,366 medium interval (Pro) →
- Mortgage (P&I)
- −$1,180
- Tax est. 1.5%
- −$281 /mo · $3,375/yr
- Insurance
- −$94
- HOA
- −$0
- Vacancy / Maint / Mgmt
- −$497
- Net cashflow
- $314
Break-even live
UW: 25.0% down · 7.5% · 30yr · 1.5% tax · 5.0% vac · 8.0% maint · 8.0% mgmt
Financing live
Cash to close
- Down payment
- $56,250
- Closing costs
- $6,750
- Reserves months
- —
- Total cash needed
- —
Loan-product check · same deal, 3 products live
Conventional
25% down · 7.5% · 30yr
- Down + closing
- —
- Monthly P&I
- —
- Monthly cashflow
- —
- DSCR
- —
- Eligible?
- —
Personal DTI + credit; lowest rate.
DSCR
20% down · 8.5% · 30yr
- Down + closing
- —
- Monthly P&I
- —
- Monthly cashflow
- —
- DSCR
- —
- Eligible?
- —
No personal income docs; deal must DSCR.
Hard money
10% down · 12.0% · 12mo
- Down + closing
- —
- Monthly P&I
- —
- Monthly cashflow
- —
- DSCR
- —
- Eligible?
- —
Short-term bridge; refi at stabilization.
Listing history 11 events
-
2026-06-13statusdays on market $225,000 Pending 2 DOM
-
2026-06-09days on market $225,000 Coming Soon 20 DOM
-
2026-06-08days on market $225,000 Coming Soon 19 DOM
-
2026-06-07days on market $225,000 Coming Soon 18 DOM
-
2026-06-04remarks 699-char remark
-
2026-06-04days on market $225,000 Coming Soon 15 DOM
-
2026-06-03days on market $225,000 Coming Soon 14 DOM
-
2026-06-02days on market $225,000 Coming Soon 13 DOM
-
2026-06-01days on market $225,000 Coming Soon 12 DOM
-
2026-05-31days on market $225,000 Coming Soon 11 DOM
-
2026-05-20historical $225,000
ⓘ Source: listings_history table (triggers on properties + properties_extension) + one-shot
backfill from property_details.listing_events for pre-trigger history.
Climate risk First Street
- Flood 1/10 Low FEMA zone X (unshaded) · 0% chance over 30 yrs
- Wildfire 4/10 Moderate
- Heat 5/10 Major 7 d/yr ≥105°F today · 17 d/yr by 30 yrs out
- Wind 4/10 Moderate 11% chance of damaging wind over 30 yrs
- Air quality 3/10 Moderate 2 unhealthy d/yr today · 4 by 30 yrs out
Nearby sold comps map
Loading sold comps map…
Walkable amenities ~0.75 mi
Loading nearby amenities…
Taxation est. · year 1
- Rental income
- $28,396
- − Mortgage interest
- −$12,603
- − Property taxes
- −$3,375
- − Insurance
- −$1,125
- − Repairs & maintenance
- −$2,272
- − Management
- −$2,272
- − Depreciation
- −$6,545
- Taxable income
- $204
- Est. tax owed @ 24.0%
- −$49
- After-tax cash flow
- $3,725/yr
For passive investors: Depreciation is non-cash, so a rental often shows a tax loss while cash-flowing — sheltering income. Rental losses are passive: they offset passive income freely, and up to $25,000/yr can offset ordinary (W-2) income if you actively participate and your MAGI is under $100k (phasing out to $0 by $150k); unused losses carry forward. On sale, claimed depreciation is recaptured at up to 25%, and gains may owe capital-gains tax (a 1031 exchange can defer both). Figures are a year-1 estimate at your 24.0% rate — not tax advice; consult a CPA.
Condition & rehab AI · 1 photo
This 3-bedroom home in a rural setting has average condition and could benefit from moderate renovations to enhance its resale and rental value.
Repairs flagged
- Minor landscaping — Lawn needs trimming
- Minor exterior paint — No visible damage
Value-add opportunities
- Both paint exterior — Enhances curb appeal and resale value
- Both landscaping — Improves curb appeal and rental value
Renovation cost estimate screening
| Repair item | Severity | Est. cost |
|---|---|---|
| landscaping · Lawn needs trimming | Minor | $500–3,000 |
| exterior paint · No visible damage | Minor | $500–3,000 |
| Total estimated repair cost · 2 items | $1,000–6,000 |
Value-add ROI direction
- Both paint exterior — Enhances curb appeal and resale value ↑
- Both landscaping — Improves curb appeal and rental value ↑
ⓘ Cost ranges are severity-bucket heuristics (US national rule-of-thumb). Get contractor quotes + a written scope before underwriting a rehab budget.
Schools (NCES district)
- District
- Cabarrus County Schools
- NCES district ID
- 3700530
- Math proficiency
- 54% ▲ 4.00%
- Reading proficiency
- 55% ▲ 3.00%
- Median HH income
- $59,442
- Composite
- 47.42/100
- National rank
- #2282
- State rank
- #44 of 178 in NC
Livability — Kannapolis
- Score
- 64/100
- State rank
- #354
- US rank
- #14030
Category grades
Schools grade is shown separately in the Schools card above.
Census & demographics
- County
- Mecklenburg County · 1,167,319 people
- City population
- 57,170
- Metro
- Charlotte-Concord-Gastonia, NC-SC
- Population (ZIP)
- 22,963
- Household income
- $156,496
- Rent vs Own
- Severe rent burden
- 336.0
Population outlook (Cabarrus County) Hauer SSP2
- Today (2025)
- 239,273 people
- By 2030
- 260,754 · +9.0%
- By 2040
- 303,953 · +27.0%
- By 2050
- 344,827 · +44.1%
- By 2075
- 435,623 · +82.1%
- By 2100
- 490,119 · +104.8%
Race, ethnicity, and origin ACS 2023
- Neighborhood character
- Predominantly White (75%)
- Race & ethnicity
- White 75% Two or more races 11% Black 8% Hispanic / Latino 7% Asian 2%
- Hispanic origin (detail)
- Mexican 3%
- Common ancestry
- Romanian 4% Slovak 4% Iranian 3%
- Foreign-born
- 4% · Canada, China, South Korea
- Languages at home
- 94% English-only · Spanish 3% Chinese 1% Other Asian/Pacific 1%
Political lean MEDSL · Cabarrus
- 2024 margin
- Lean R (+7.7) · D 45.5% · R 53.2% · Other 1.3%
- 2008→2024 swing
- +10.7pp toward D · 2008: -18.4pp · 2024: -7.7pp
- All cycles
- 2024: R+7.7 2020: R+9.4 2016: R+20.0 2012: R+20.2 2008: R+18.4
Not yet ingested
- Civics
- —
Market trends
- HPI YoY
- ▼ -158.36%
- Current HPI
- 287.0837
- Rent YoY
- ▲ 3.87%
- Metro
- Charlotte-Concord-Gastonia, NC-SC
- State GDP YoY
- ▲ 3.28%
- F500 in state
- 26
Industry mix (Fortune 500 HQ in NC)
| Industry | F500 HQs | Revenue |
|---|---|---|
| Financial Services | 2 | $213B |
|
||
| Retail | 2 | $95B |
|
||
| Industrial Conglomerate | 1 | $38B |
|
||
| Metals / Steel | 1 | $35B |
|
||
| Utilities | 1 | $30B |
|
||
| Industrial Machinery | 1 | $19B |
|
||
Price history
1 event — show timeline
- 2026-05-20 Coming Soon $225,000 CANOPYMLS as Distributed by MLS Grid
Cash-flow waterfall
monthlySold comps — $/sqft
last 12 mo · ≤1 miLoading sold comps…