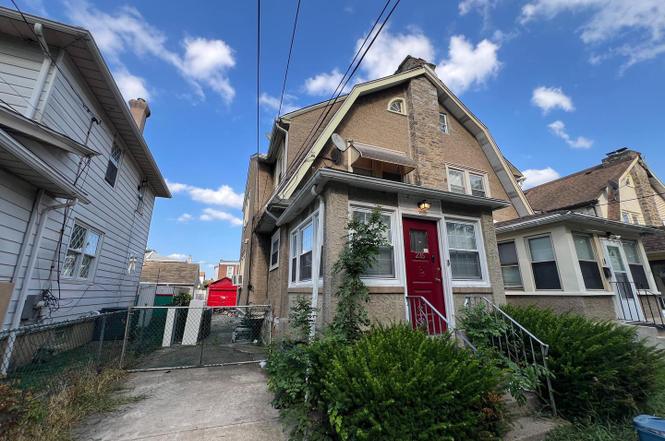
235 Felton Ave · Collingdale, PA
Flood risk 1/10 · Minimal
- FEMA flood zone
- X (unshaded)
- Chance of flooding over 30 yrs
- 0.0%
- Est. flood insurance / yr
- $473 – $860
Fire risk 1/10 · Minimal
- Est. fire insurance / yr
- $511 – $949
Heat risk 6/10 · Moderate
- Hot days now (above 103°F)
- 7 days/yr
- Hot days in 30 yrs
- 15 days/yr
Wind risk 6/10 · Moderate
- Chance of severe wind over 30 yrs
- 27.0%
Air-quality risk 4/10 · Minor
- Unhealthy air days now
- 3 days/yr
- Unhealthy air days in 30 yrs
- 6 days/yr
Risk factors via First Street. Map © Google.
Why this score? — see what drove the B- grade
The composite is a weighted blend of 9 inputs, each scored 0–100. Each bar is that input's sub-score; the figure is the points it added to the 100-point composite (weight × sub-score).
- Cash flow +24.8/30.0
- ARV discount +15.0/15.0
- DSCR +8.1/10.0
- 1% rule +8.0/10.0
- Rent growth +5.0/5.0
- Livability +4.2/5.0
- Condition / age +2.5/5.0
- Schools +2.0/10.0
- Appreciation +0.0/10.0
$148,600
🖨 Deal sheet 📄 Offer letter ✓ Due diligence
Listing remarks
Fantastic opportunity to own a 3-bedroom, 1-bath semi-detached home featuring a private backyard and a driveway. This is a bank owned property and is being sold in as-is condition. Buyer is responsible to order and pay for U & O Cert. Suitable for cash buyers or buyers using rehab/renovation loans only.
Key facts
- Driveway
- Private backyard
- Built 1920
Tags
Property features AI
Exterior
- Parking: Driveway
- Utilities: Public water; Public sewer; Natural gas for hot water
- Home design: Semi-detached structure
- Construction: Stucco exterior; Concrete perimeter foundation; Above-grade and below-grade structures
- Exterior features: Lot dimensions approximately 25 x 109; Semi-detached property
Interior
- Bedrooms: Three bedrooms on the upper level
- Bathrooms: One full bathroom
- Heating & cooling: Hot water heating; Natural gas heating
- Interior features: Full basement
Neighborhood map
What this means for you Summary
Snapshot
- This is a 3-bed/1.5-bath single-family listed at $149k.
Deal economics
- At list price, monthly cash flow is $316 ($4k/yr) — positive.
- The deal already cash-flows at list — no discount required.
- Meets the 1% rule at list price ($2k rent vs $149k).
- Recommended offer: $131k (12.0% below list) — sets the bar for market timing.
- Cap rate 8.8% vs local median 6.0% in Collingdale — top-decile yield for the area; either an underpriced asset or a hidden risk that comps aren't pricing in. Stress-test before assuming the spread holds.
Location & tenants
- Location reads 84/100 on livability (#105 in PA, #781 nationally) — a professional / high-income tenant draw. Strengths: commute A+, cost of living A+, housing A+; Watch: employment C-, amenities D.
- Southeast Delco SD (suburban): math 13% / reading 33% proficiency, ranked #478 of 539 in PA (top 89%) — low school quality limits family demand, transient renter base, plan for 1-2y turnover; 63% free/reduced lunch — lower-income household profile, screen leases tightly.
- Market conditions: Rents rising fast (+13.1%/yr); 99 active listings in the ZIP; 39 comparable units currently listed for rent nearby; rentals at typical pace (median 24d on market — plan ~3-4 weeks tenant-placement turnaround); 299 units permitted in Delaware County in 2024 (5 in 5+ unit buildings).
- At $1,927/mo this rent would consume 50% of the median local household income ($46k/yr) (locally 1468% of renters already pay >50% of income on rent) — very limited rent-growth headroom before tenants either downsize or default.
Forward outlook
- Local home prices are declining (-3.0%/yr); year-one equity from $1k of loan paydown is wiped out by about $4k of value loss. Plan a longer hold.
- At projected returns (-3.0% appreciation + 8.0% rent growth), your $42k cash investment doubles in ~8 years — after that, you're playing with house money.
Negotiation context
- It's been on market 154 days — a 12% lower offer ($131k) is reasonable based on typical stale-listing flexibility.
- 9 sale attempts since 29y ago with the ask held roughly flat each time — persistent listings suggest the price (not the market) is what's stuck; bring a comps-based counter.
- Current owner paid $75k; list at $149k implies a 98% gain — meaningful room to come down on a strong offer.
Risks & watch-outs
- Watch-outs: property tax is 3.0% of price; built in 1920 — expect roof / HVAC / electrical / plumbing capex.
- Climate carrying-cost: major wind risk, 27% chance of damaging wind over 30y; extreme-heat days projected 7→15/yr by 2055 (HVAC capex compounding) — expect insurance premiums to compound above CPI over the hold.
Questions for the listing agent
- It's been on market 154 days. Have you received any prior offers? Is the seller open to a 12% concession, seller financing, or rate buy-down credit?
- Built in 1920 — when were the roof, HVAC, electrical panel, plumbing, and water heater last replaced?
- Property tax is high relative to price — has the assessment been appealed recently, and will the sale trigger a re-assessment?
- Why hasn't it sold? Are there any deal-killer items the seller is aware of (foundation, flood, title, zoning, code violations)?
- Is there a deadline driving the sale (1031 exchange, divorce, estate, relocation)? That informs how much negotiation room exists.
- What's the average days-on-market for RENTAL listings here right now (not sales)? A rising rental-DOM trend means longer vacancies and softer asking-rent achievability than the comps imply.
- What's the recent tenant-quality profile in this submarket — average credit score on applications, eviction rate, late-payment / NSF rate, and stable-employment percentage? A property-management company in the area should have these aggregated.
- How much new for-sale + rental construction is in the pipeline within 1–3 miles? Heavy new supply typically softens prices + rents 12–24 months out; constrained supply supports both.
Investment metrics
- 1% rule
- 1.30% ✓
- Cap rate
- 8.84%
- Cash-on-cash
- 9.11%
- DSCR
- 1.41
- GRM
- 6.4
CMA / ARV
- ARV (on-the-fly)
- $270,480
- Comps found
- 12
Show comp detail 12 sales within ~0.75 mi
| Address | Dist | Beds/Ba | Sqft | Sold | Price | $/sf | Match |
|---|---|---|---|---|---|---|---|
| 230 Felton | 0.03mi | 3/1.5 | 1,288 (0%) | 6mo | $275,000 | $214 | 94 |
| 515 Beechwood | 0.09mi | 3/2.0 | 1,172 (-9%) | 14mo | $275,000 | $235 | 67 |
| 733 Eggleston | 0.58mi | 3/1.5 | 1,352 (+5%) | 1mo | $271,000 | $200 | 64 |
| 1025 Bartram Ave | 0.53mi | 3/1.0 | 1,334 (+4%) | 12mo | $232,000 | $174 | 57 |
| 101 S Glenwood Ave | 0.61mi | 3/2.0 | 1,375 (+7%) | 4mo | $350,000 | $255 | 55 |
| 811 Springfield Rd | 0.73mi | 3/2.0 | 1,218 (-5%) | 1mo | $190,000 | $156 | 54 |
| 1454 Watson Rd | 0.73mi | 3/2.0 | 1,214 (-6%) | 4mo | $255,000 | $210 | 51 |
| 1311 Spring St | 0.64mi | 3/2.0 | 1,152 (-11%) | 2mo | $255,000 | $221 | 49 |
| 123 Folcroft Ave | 0.75mi | 2/2.0 (-1) | 1,214 (-6%) | 10mo | $230,100 | $190 | 41 |
| 1190 Clifton Ave | 0.57mi | 2/1.0 (-1) | 1,159 (-10%) | 13mo | $207,000 | $179 | 39 |
| 437 E Magnolia Ave | 0.68mi | 3/1.5 | 1,470 (+14%) | 10mo | $327,500 | $223 | 36 |
| 905 Springfield Rd | 0.67mi | 4/2.0 (+1) | 1,428 (+11%) | 10mo | $155,000 | $109 | 35 |
Match score weights: distance 35% · size 25% · config 20% · recency 20%. Top-matched comps best support the ARV.
Projected returns pro-forma
-3.0% appreciation · 8.0% rent growth · sell at horizon
- IRR
- 3.7%
- Equity multiple
- 1.15×
- Total profit
- $6,368
- Equity at exit
- $22,157
- IRR
- 18.0%
- Equity multiple
- 2.88×
- Total profit
- $78,378
- Equity at exit
- $12,848
Cash invested: $41,608 (down + closing). Projections, not guarantees.
Landlord ↔ Tenant lean methodology
- Overall (STATE)
- 62 Landlord-Friendly
- State Pennsylvania
- 62 Landlord-Friendly · EVEN
- County
- — inherits STATE
- City
- — inherits STATE
ZIP-level market 19023
- Rents YoY
- 13.1%
- Active inventory
- 99
- Price-to-rent
- 6.4×
Monthly cashflow live
- Estimated rent
- $1,927 high interval (Pro) →
- Mortgage (P&I)
- −$779
- Tax from tax record
- −$365 /mo · $4,384/yr
- Insurance
- −$62
- HOA
- −$0
- Vacancy / Maint / Mgmt
- −$405
- Net cashflow
- $316
Break-even live
UW: 25.0% down · 7.5% · 30yr · 1.5% tax · 5.0% vac · 8.0% maint · 8.0% mgmt
Financing live
Cash to close
- Down payment
- $37,150
- Closing costs
- $4,458
- Reserves months
- —
- Total cash needed
- —
Loan-product check · same deal, 3 products live
Conventional
25% down · 7.5% · 30yr
- Down + closing
- —
- Monthly P&I
- —
- Monthly cashflow
- —
- DSCR
- —
- Eligible?
- —
Personal DTI + credit; lowest rate.
DSCR
20% down · 8.5% · 30yr
- Down + closing
- —
- Monthly P&I
- —
- Monthly cashflow
- —
- DSCR
- —
- Eligible?
- —
No personal income docs; deal must DSCR.
Hard money
10% down · 12.0% · 12mo
- Down + closing
- —
- Monthly P&I
- —
- Monthly cashflow
- —
- DSCR
- —
- Eligible?
- —
Short-term bridge; refi at stabilization.
Rent comps 39 comps
| Address | Beds | Baths | Sqft | Rent | $/sqft | DOM | Units | Dist |
|---|---|---|---|---|---|---|---|---|
| 118 Felton Ave Darby, PA | 3.0 | 1.0 | 1152 | $1,750 | $1.52 | 21d | 1 | 0.11mi |
| 112 Juliana Ter Darby, PA | 3.0 | 1.0 | 1020 | $2,450 | $2.40 | 24d | 1 | 0.14mi |
| 112 Juliana Ter Darby, PA | 3.0 | 1.0 | 1020 | $2,350 | $2.30 | 44d | 1 | 0.14mi |
| 2 Winthrop Rd Darby, PA | 3.0 | 1.5 | 1224 | $1,900 | $1.55 | 21d | 1 | 0.50mi |
| 66 Folcroft Ave Folcroft, PA | 3.0 | 1.0 | 1224 | $1,895 | $1.55 | 3d | 1 | 0.66mi |
| 909 Springfield Rd Unit D Darby, PA | 4.0 | 1.0 | 900 | $1,600 | $1.78 | 43d | 1 | 0.68mi |
| 601 Poplar St Sharon Hill, PA | 1.0–2.0 | 1.0 | 787 | $1,599 | $2.03 | 15d | 5 | 0.69mi |
| 209 Hamilton Ave Darby, PA | 4.0 | 1.0 | 1400 | $1,595 | $1.14 | 15d | 1 | 0.72mi |
| 1300 Main St Unit Basement Darby, PA | 2.0 | 1.0 | 1000 | $1,450 | $1.45 | 24d | 1 | 0.79mi |
| 304 Pine St Glenolden, PA | 3.0 | 2.0 | 1120 | $2,400 | $2.14 | 43d | 1 | 0.79mi |
| 306 Pine St Glenolden, PA | 3.0 | 2.0 | 1120 | $2,400 | $2.14 | 4d | 1 | 0.80mi |
| 132 Folcroft Ave Folcroft, PA | 2.0 | 1.0 | 725 | $1,679 | $2.32 | 2d | 3 | 0.81mi |
| 700 Pine St Unit 2F Darby, PA | 2.0 | 1.0 | 1100 | $1,250 | $1.14 | 18d | 1 | 0.87mi |
| 69 S 7th St Darby, PA | 3.0 | 2.0 | 1446 | $1,700 | $1.18 | 43d | 1 | 0.89mi |
| 1503 Elmwood Ave Folcroft, PA | 3.0 | 1.0 | 1025 | $1,699 | $1.66 | 24d | 1 | 0.94mi |
| 924 Maple Ter Darby, PA | 3.0 | 1.5 | 1190 | $2,000 | $1.68 | 5d | 1 | 0.95mi |
| 1513 Elmwood Ave Unit 4 Folcroft, PA | 3.0 | 1.0 | 1025 | $1,699 | $1.66 | 24d | 1 | 0.95mi |
| 37 Concord Rd Darby, PA | 3.0 | 1.0 | 1120 | $1,795 | $1.60 | 43d | 1 | 0.96mi |
| 935 Maple Ter Darby, PA | 3.0 | 1.0 | 1266 | $1,585 | $1.25 | 11d | 1 | 0.97mi |
| 935 Maple Ter Darby, PA | 3.0 | 1.0 | 1266 | $1,585 | $1.25 | 5d | 1 | 0.97mi |
| 94 S 6th St Darby, PA | 3.0 | 1.5 | 1666 | $2,000 | $1.20 | 24d | 1 | 1.01mi |
| 100 S Oak Ave Glenolden, PA | 1.0–2.0 | 1.0–2.0 | 830 | $1,500 | $1.81 | 24d | 3 | 1.03mi |
| 145 Isabel Ave Unit 145B Glenolden, PA | 2.0 | 1.0 | 890 | $1,525 | $1.71 | 43d | 1 | 1.06mi |
| 1074 N Academy Ave Glenolden, PA | 3.0 | 1.0 | 1152 | $1,850 | $1.61 | 5d | 1 | 1.08mi |
| 820 Greenhill Rd Sharon Hill, PA | 4.0 | 2.0 | 1184 | $2,600 | $2.20 | 5d | 1 | 1.10mi |
| 106 N 6th St Darby, PA | 2.0 | 1.0 | 1200 | $1,550 | $1.29 | 43d | 1 | 1.11mi |
| 304 S 3rd St Darby, PA | 3.0 | 1.0 | 1602 | $1,595 | $1.00 | 20d | 1 | 1.17mi |
| 304 S 3rd St Darby, PA | 3.0 | 1.0 | 1602 | $1,695 | $1.06 | 43d | 1 | 1.17mi |
| 412 S 2nd St Darby, PA | 3.0 | 1.0 | 1190 | $1,100 | $0.92 | 5d | 1 | 1.20mi |
| 902 Maple Ave Glenolden, PA | 3.0 | 1.0 | 1152 | $1,745 | $1.51 | 43d | 1 | 1.20mi |
| 417 S 2nd St Darby, PA | 3.0 | 1.0 | 1190 | $1,020 | $0.86 | 5d | 1 | 1.22mi |
| 925 Maple Ave Glenolden, PA | 3.0 | 2.0 | 1152 | $2,800 | $2.43 | 21d | 1 | 1.22mi |
| 96 E Berkley Ave Clifton Heights, PA | 2.0 | 1.5 | 1352 | $1,850 | $1.37 | 18d | 1 | 1.33mi |
| 201 Westbridge Rd Glenolden, PA | 3.0 | 1.5 | 1224 | $2,350 | $1.92 | 24d | 1 | 1.38mi |
| 116 W Berkley Ave Clifton Heights, PA | 4.0 | 2.0 | 1652 | $2,600 | $1.57 | 43d | 1 | 1.40mi |
| 319 S Church St Clifton Heights, PA | 3.0 | 1.0 | 1152 | $1,900 | $1.65 | 43d | 1 | 1.41mi |
| 60 W Broadway Ave Clifton Heights, PA | 3.0 | 1.0 | 1160 | $2,200 | $1.90 | 43d | 1 | 1.44mi |
| 312 E Baltimore Ave Clifton Heights, PA | 1.0–2.0 | 1.0 | 812 | $1,649 | $2.03 | 2d | 3 | 1.46mi |
| 1519 Roosevelt Dr Sharon Hill, PA | 3.0 | 1.5 | 1260 | $2,295 | $1.82 | 43d | 1 | 1.48mi |
Listing history 31 events
-
2026-06-18days on market $148,600 Active 154 DOM
-
2026-06-17days on market $148,600 Active 153 DOM
-
2026-06-16days on market $148,600 Active 152 DOM
-
2026-06-15days on market $148,600 Active 151 DOM
-
2026-06-13days on market $148,600 Active 149 DOM
-
2026-06-13days on market $148,600 Active 148 DOM
-
2026-06-09days on market $148,600 Active 145 DOM
-
2026-06-08days on market $148,600 Active 144 DOM
-
2026-06-07days on market $148,600 Active 143 DOM
-
2026-05-20status Active
-
2026-04-18status Pending
-
2026-03-03price $148,600
-
2026-03-03status Active
-
2026-03-03historical
-
2026-02-25$148,600 Active
-
2026-02-06historical
-
2025-12-06price $160,650
-
2025-11-08$178,500 Active
-
2008-05-28historical
-
2007-11-28$165,000
-
2007-02-01historical
-
2006-10-30$144,900
-
2005-04-07soldstatus $75,000
-
2005-04-01soldstatus $75,000
-
2005-02-21historical
-
2004-11-15$75,000
-
1998-11-05historical
-
1998-05-05$72,999
-
1997-12-17historical
-
1997-07-17$80,000
-
1993-10-22soldstatus $75,000
ⓘ Source: listings_history table (triggers on properties + properties_extension) + one-shot
backfill from property_details.listing_events for pre-trigger history.
Tax reassessment forecast PA · Partial reset (capped growth)
- Current annual tax
- $4,384 · $365/mo
- Projected year-2 tax
- $4,384 · $365/mo
- Expected delta
- $0/yr ($0/mo · 0.0%)
ⓘ Screening estimate from a state-policy table — verify with the county assessor before closing.
Climate risk First Street
- Flood 1/10 Low FEMA zone X (unshaded) · 0% chance over 30 yrs
- Wildfire 1/10 Low
- Heat 6/10 Major 7 d/yr ≥103°F today · 15 d/yr by 30 yrs out
- Wind 6/10 Major 27% chance of damaging wind over 30 yrs
- Air quality 4/10 Moderate 3 unhealthy d/yr today · 6 by 30 yrs out
Nearby sold comps map
Loading sold comps map…
Walkable amenities ~0.75 mi
Loading nearby amenities…
Taxation est. · year 1
- Rental income
- $23,126
- − Mortgage interest
- −$8,324
- − Property taxes
- −$4,384
- − Insurance
- −$743
- − Repairs & maintenance
- −$1,850
- − Management
- −$1,850
- − Depreciation
- −$4,323
- Taxable income
- $1,652
- Est. tax owed @ 24.0%
- −$397
- After-tax cash flow
- $3,395/yr
For passive investors: Depreciation is non-cash, so a rental often shows a tax loss while cash-flowing — sheltering income. Rental losses are passive: they offset passive income freely, and up to $25,000/yr can offset ordinary (W-2) income if you actively participate and your MAGI is under $100k (phasing out to $0 by $150k); unused losses carry forward. On sale, claimed depreciation is recaptured at up to 25%, and gains may owe capital-gains tax (a 1031 exchange can defer both). Figures are a year-1 estimate at your 24.0% rate — not tax advice; consult a CPA.
Schools (NCES district)
- District
- Southeast Delco SD
- NCES district ID
- 4222400
- Math proficiency
- 13% ▼ -8.00%
- Reading proficiency
- 33% ▼ -9.00%
- Median HH income
- $49,309
- Composite
- 20.25/100
- National rank
- #8623
- State rank
- #478 of 539 in PA
Livability — Collingdale
- Score
- 84/100
- State rank
- #105
- US rank
- #781
Category grades
Schools grade is shown separately in the Schools card above.
Census & demographics
- Census place
- Collingdale, PA
- County
- Delaware County · 399,863 people
- City population
- 22,247
- Metro
- Philadelphia-Camden-Wilmington, PA-NJ-DE-MD
- Population (ZIP)
- 22,247
- Household income
- $46,463
- Rent vs Own
- Severe rent burden
- 1468.0
Population outlook (Delaware County) Hauer SSP2
- Today (2025)
- 577,490 people
- By 2030
- 581,243 · +0.6%
- By 2040
- 584,700 · +1.2%
- By 2050
- 586,581 · +1.6%
- By 2075
- 598,706 · +3.7%
- By 2100
- 590,823 · +2.3%
Race, ethnicity, and origin ACS 2023
- Neighborhood character
- Predominantly Black (76%)
- Race & ethnicity
- Black 76% White 15% Two or more races 5% Hispanic / Latino 3% Asian 2%
- Common ancestry
- Swiss 5% Hispanic 1% Romanian 1%
- Foreign-born
- 18% · Canada
- Languages at home
- 84% English-only · French/Haitian/Cajun 4% Spanish 3% Other Asian/Pacific 1%
Political lean MEDSL · Delaware
- 2024 margin
- Strong D (+23.7) · D 61.4% · R 37.6% · Other 1.0%
- 2008→2024 swing
- +2.3pp toward D · 2008: 21.4pp · 2024: 23.7pp
- All cycles
- 2024: D+23.7 2020: D+26.7 2016: D+22.0 2012: D+21.8 2008: D+21.4
Not yet ingested
- Civics
- —
Market trends
- HPI YoY
- ▼ -190.50%
- Current HPI
- 277.7034
- Rent YoY
- ▲ 13.10%
- Metro
- Philadelphia-Camden-Wilmington, PA-NJ-DE-MD
- State GDP YoY
- ▲ 1.68%
- F500 in state
- 34
Industry mix (Fortune 500 HQ in PA)
| Industry | F500 HQs | Revenue |
|---|---|---|
| Healthcare | 2 | $309B |
|
||
| Insurance | 2 | $27B |
|
||
| Telecommunications / Media | 1 | $124B |
|
||
| Industrial Distribution | 1 | $22B |
|
||
| Financial Services | 1 | $20B |
|
||
| Chemicals / Materials | 1 | $18B |
|
||
Price history
+98.1% since first listed22 events — show timeline
- 2026-05-20 Relisted — BRIGHT MLS
- 2026-04-18 Pending — BRIGHT MLS
- 2026-03-03 Price Changed $148,600 BRIGHT MLS
- 2026-03-03 Relisted — BRIGHT MLS
- 2026-03-03 Listing Removed — BRIGHT MLS
- 2026-02-25 Listed $148,600 BRIGHT MLS
- 2026-02-06 Listing Removed — BRIGHT MLS
- 2025-12-06 Price Changed $160,650 BRIGHT MLS
- 2025-11-08 Listed $178,500 BRIGHT MLS
- 2008-05-28 Listing Removed — BRIGHT MLS
- 2007-11-28 Listed $165,000 BRIGHT MLS
- 2007-02-01 Listing Removed — BRIGHT MLS
- 2006-10-30 Listed $144,900 BRIGHT MLS
- 2005-04-07 Sold (Public Records) $75,000 Public Records
- 2005-04-01 Sold (MLS) $75,000 BRIGHT MLS
- 2005-02-21 Listing Removed — BRIGHT MLS
- 2004-11-15 Listed $75,000 BRIGHT MLS
- 1998-11-05 Listing Removed — BRIGHT MLS
- 1998-05-05 Listed $72,999 BRIGHT MLS
- 1997-12-17 Listing Removed — BRIGHT MLS
- 1997-07-17 Listed $80,000 BRIGHT MLS
- 1993-10-22 Sold (Public Records) $75,000 Public Records
Property tax history
+2.4%/yrLatest (2026): $4,384 · -5.9% YoY. Source: county tax records.
Cash-flow waterfall
monthlySold comps — $/sqft
last 12 mo · ≤1 miLoading sold comps…