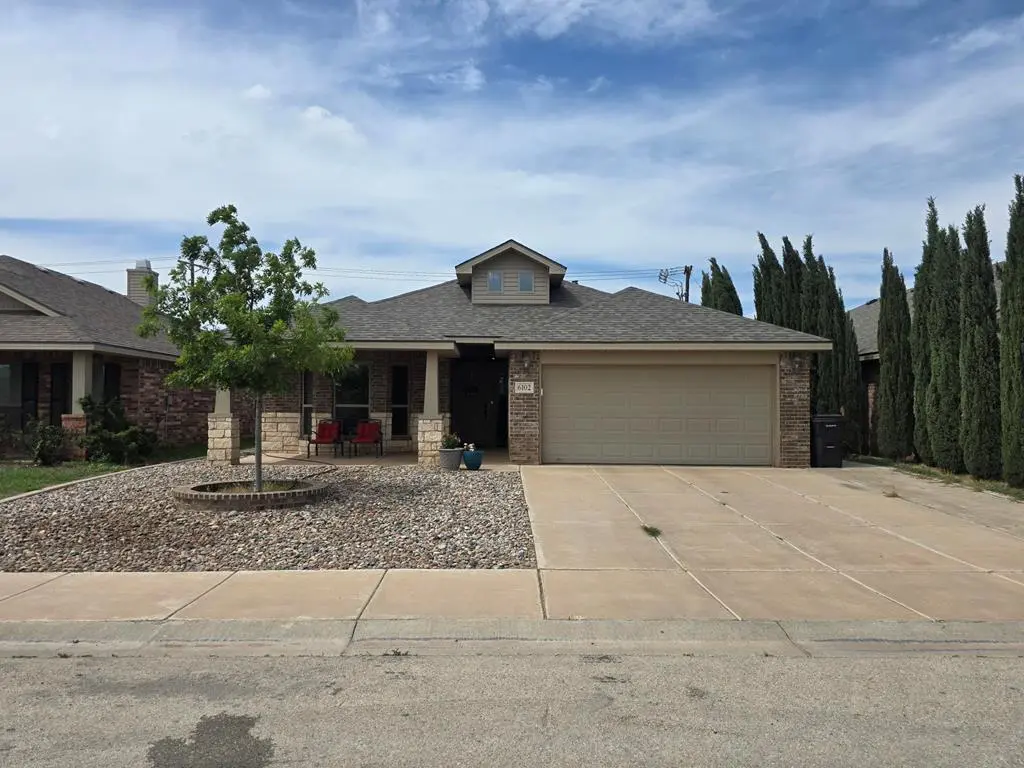
6102 Spahn St · Midland, TX
Flood risk 1/10 · Minimal
- FEMA flood zone
- X
- Chance of flooding over 30 yrs
- 0.0%
- Est. flood insurance / yr
- $507 – $1,088
Fire risk 8/10 · Major
- Est. fire insurance / yr
- $1,222 – $2,270
Heat risk 6/10 · Moderate
- Hot days now (above 102°F)
- 5 days/yr
- Hot days in 30 yrs
- 16 days/yr
Wind risk 2/10 · Minimal
- Chance of severe wind over 30 yrs
- 3.0%
Air-quality risk 1/10 · Minimal
- Unhealthy air days now
- 0 days/yr
- Unhealthy air days in 30 yrs
- 0 days/yr
Risk factors via First Street. Map © Google.
Why this score? — see what drove the D- grade
The composite is a weighted blend of 9 inputs, each scored 0–100. Each bar is that input's sub-score; the figure is the points it added to the 100-point composite (weight × sub-score).
- Cash flow +11.5/30.0
- ARV discount +7.7/15.0
- Livability +4.0/5.0
- DSCR +3.4/10.0
- 1% rule +3.3/10.0
- Rent growth +3.2/5.0
- Schools +3.2/10.0
- Condition / age +2.5/5.0
- Appreciation +0.0/10.0
$325,000
🖨 Deal sheet (PDF) 📄 Offer letter ✓ Due diligence
Listing remarks
Stop the car! This is pride in ownership you can't miss, so make this gorgeous home yours. Immaculate home, beautiful yard, covered patio, mature trees. All information herein is deemed reliable but not guaranteed. Buyer to verify all Schools, Taxes, boundary lines and zoning.
Key facts
- Covered patio
- Mature trees
- 6,229 sq ft lot
Tags
Property features AI
Finance
- HOA & community: Homeowners association with an annual fee of $360 (about $30/month)
Exterior
- Parking: 2 total parking spaces; 2 covered spaces; 2-car attached garage with garage door opener; Parking pad
- Utilities: Public water; Public sewer; Propane
- Home design: Single-family residence; Residential property
- Construction: Brick veneer construction; Composition roof; Slab foundation; Built area approximately 1,803
- Exterior features: Landscaped lot; Wood fencing; Paved road access; Solar panels
Interior
- Kitchen: Electric range; Microwave; Dishwasher; Garbage disposal; Gas water heater
- Flooring: Carpet; Tile
- Bathrooms: 2 full bathrooms
- Heating & cooling: Central heating (electric); Central air conditioning (electric)
- Interior features: Window blinds; Wood-burning fireplace in the living room
- Laundry & utility: Washer hookup
Neighborhood map
What this means for you Summary
Snapshot
- This is a 3-bed/2.0-bath single-family listed at $325k.
Deal economics
- At list price, monthly cash flow is $-106 ($-1k/yr) — negative.
- To cash-flow at today's rent, offer at most $306k (5.8% below list).
- To meet the 1% rule (rent ≥ 1% of price), the offer needs to be $268k (17.4% below list).
- Recommended offer: $268k (17.4% below list) — sets the bar for 1% rule.
- Cap rate 5.9% vs local median 4.7% in Midland — meaningfully above typical; check what's discounted (condition, days-on-market, listing class) to confirm the premium yield is real.
Location & tenants
- Location reads 79/100 on livability (#57 in TX, #2,192 nationally) — a middle-class / working-renter tenant base. Strengths: employment A+, housing A+, health & safety A+; Watch: crime C-, commute D+, amenities D.
- Midland ISD (urban): math 34% / reading 36% proficiency, ranked #477 of 826 in TX (top 58%) — families likely to look elsewhere, expect single-tenant / working-renter base with shorter leases.
- Zoned schools: Barbara Yarbrough El (math 43% / reading 33%, grade F, #1,709 of 4,322 statewide, top 40%, 750 students, 42% FRL); Alamo J H (math 23% / reading 32%, grade F, #1,156 of 1,662 statewide, top 71%, 865 students, 62% FRL); Midland H S (math 37% / reading 7%, grade F, #1,366 of 1,632 statewide, top 84%, 2,492 students, 44% FRL) — zoned schools at 50% FRL track the district average.
- Market conditions: Rents rising (+2.8%/yr); 380 active listings in the ZIP; 27 comparable units currently listed for rent nearby; rentals at typical pace (median 23d on market — plan ~3-4 weeks tenant-placement turnaround); 44% of comp listings sitting > 30 days — soft ceiling on asking rent; solid renter incomes; 1,504 units permitted in Midland County in 2024 (0 in 5+ unit buildings).
Forward outlook
- Local home prices are declining (-3.0%/yr); year-one equity from $2k of loan paydown is wiped out by about $10k of value loss. Plan a longer hold.
- Midland County population projected at +83% by 2050 — long-run rental-demand tailwind backs the buy-and-hold thesis.
Negotiation context
- It's been on market 15 days — a 2% lower offer ($320k) is reasonable based on typical stale-listing flexibility.
Risks & watch-outs
- Climate carrying-cost: severe wildfire risk; extreme-heat days projected 5→16/yr by 2055 (HVAC capex compounding) — expect insurance premiums to compound above CPI over the hold.
Questions for the listing agent
- What do current leases actually rent for vs. the listed asking? Can we see a recent rent roll and the last 12 months of T-12 income?
- What does the HOA fee cover, when was the last increase, and are there any pending special assessments or reserve-fund shortfalls?
- Is there a deadline driving the sale (1031 exchange, divorce, estate, relocation)? That informs how much negotiation room exists.
- The area grade is low — what's the realistic commute time and amenity access for the typical tenant pool here? Any planned neighborhood developments (good or bad) we should know about?
- What's the average days-on-market for RENTAL listings here right now (not sales)? A rising rental-DOM trend means longer vacancies and softer asking-rent achievability than the comps imply.
- What's the recent tenant-quality profile in this submarket — average credit score on applications, eviction rate, late-payment / NSF rate, and stable-employment percentage? A property-management company in the area should have these aggregated.
- How much new for-sale + rental construction is in the pipeline within 1–3 miles? Heavy new supply typically softens prices + rents 12–24 months out; constrained supply supports both.
Investment metrics
- 1% rule
- 0.83% ✗
- Cap rate
- 5.90%
- Cash-on-cash
- -1.40%
- DSCR
- 0.94
- GRM
- 10.1
CMA / ARV
- ARV (on-the-fly)
- $326,343
- Comps found
- 1
Show comp detail 1 sale within ~0.75 mi
| Address | Dist | Beds/Ba | Sqft | Sold | Price | $/sf | Match |
|---|---|---|---|---|---|---|---|
| 6803 Hall Of Fame Blvd | 0.58mi | 3/2.0 | 2,070 (+15%) | 1mo | $375,000 | $181 | 48 |
Match score weights: distance 35% · size 25% · config 20% · recency 20%. Top-matched comps best support the ARV.
Projected returns pro-forma
-3.0% appreciation · 2.75% rent growth · sell at horizon
- IRR
- -18.9%
- Equity multiple
- 0.34×
- Total profit
- $-60,076
- Equity at exit
- $48,459
- IRR
- -11.9%
- Equity multiple
- 0.30×
- Total profit
- $-63,660
- Equity at exit
- $28,100
Cash invested: $91,000 (down + closing). Projections, not guarantees.
Landlord ↔ Tenant lean methodology
- Overall (STATE)
- 87 Strongly Landlord-Friendly
- State Texas
- 87 Strongly Landlord-Friendly · R+5
- County
- — inherits STATE
- City
- — inherits STATE
ZIP-level market 79706
- Rents YoY
- 2.8%
- Active inventory
- 380
- Price-to-rent
- 10.1×
Monthly cashflow live
- Estimated rent
- $2,684 high interval (Pro) →
- Mortgage (P&I)
- −$1,704
- Tax from tax record
- −$357 /mo · $4,283/yr
- Insurance
- −$135
- HOA
- −$30
- Vacancy / Maint / Mgmt
- −$564
- Net cashflow
- $-106
Break-even live
Sensitivity live
| Price | -10% $78 | -5% $-14 | +0% $-106 | +5% $-198 | +10% $-290 |
|---|---|---|---|---|---|
| Rent | -10% $-318 | -5% $-212 | +0% $-106 | +5% $0 | +10% $106 |
| Rate | -1.0pp $57 | -0.5pp $-24 | base $-106 | +0.5pp $-190 | +1.0pp $-276 |
UW: 25.0% down · 7.5% · 30yr · 1.5% tax · 5.0% vac · 8.0% maint · 8.0% mgmt
Financing live
Cash to close
- Down payment
- $81,250
- Closing costs
- $9,750
- Reserves months
- —
- Total cash needed
- —
Loan-product check · same deal, 3 products live
Conventional
25% down · 7.5% · 30yr
- Down + closing
- —
- Monthly P&I
- —
- Monthly cashflow
- —
- DSCR
- —
- Eligible?
- —
Personal DTI + credit; lowest rate.
DSCR
20% down · 8.5% · 30yr
- Down + closing
- —
- Monthly P&I
- —
- Monthly cashflow
- —
- DSCR
- —
- Eligible?
- —
No personal income docs; deal must DSCR.
Hard money
10% down · 12.0% · 12mo
- Down + closing
- —
- Monthly P&I
- —
- Monthly cashflow
- —
- DSCR
- —
- Eligible?
- —
Short-term bridge; refi at stabilization.
Rent comps 27 comps
| Address | Beds | Baths | Sqft | Rent | $/sqft | DOM | Units | Dist |
|---|---|---|---|---|---|---|---|---|
| 6020 Spahn St Midland, TX | 4.0 | 2.0 | 1849 | $2,800 | $1.51 | 45d | 1 | 0.03mi |
| 6102 Mile High Ln Midland, TX | 3.0 | 2.0 | 1763 | $2,500 | $1.42 | 45d | 1 | 0.11mi |
| 6011 Mile High Ln Midland, TX | 3.0 | 2.0 | 1763 | $2,550 | $1.45 | 45d | 1 | 0.13mi |
| 5919 Mile High Ln Midland, TX | 3.0 | 2.0 | 1758 | $2,600 | $1.48 | 22d | 1 | 0.16mi |
| 509 Wagner Dr Midland, TX | 4.0 | 2.0 | 2085 | $3,000 | $1.44 | 45d | 1 | 0.18mi |
| 6406 Hall of Fame Blvd Midland, TX | 3.0 | 2.0 | 1718 | $2,850 | $1.66 | 15d | 1 | 0.30mi |
| 711 Candlestick Dr Midland, TX | 3.0 | 2.0 | 1512 | $2,400 | $1.59 | 22d | 1 | 0.31mi |
| 711 Candlestick Dr Midland, TX | 3.0 | 2.0 | 1512 | $2,400 | $1.59 | 45d | 1 | 0.31mi |
| 303 Koufax Ct Midland, TX | 4.0 | 2.0 | 2096 | $2,950 | $1.41 | 22d | 1 | 0.34mi |
| 619 Victory Pkwy Midland, TX | 4.0 | 2.0 | 1824 | $3,200 | $1.75 | 15d | 1 | 0.37mi |
| 704 Nolan Ryan Dr Midland, TX | 3.0 | 2.0 | 1454 | $2,500 | $1.72 | 45d | 1 | 0.38mi |
| 805 Nolan Ryan Dr Midland, TX | 3.0 | 2.0 | 1630 | $2,450 | $1.50 | 22d | 1 | 0.42mi |
| 6614 Jamestown St Midland, TX | 4.0 | 3.0 | 2284 | $3,000 | $1.31 | 45d | 1 | 0.42mi |
| 907 Candlestick Dr Midland, TX | 3.0 | 2.0 | 1715 | $2,500 | $1.46 | 15d | 1 | 0.43mi |
| 1008 Rangers Ct Midland, TX | 3.0 | 2.0 | 1662 | $2,250 | $1.35 | 15d | 1 | 0.45mi |
| 6418 Patriot Pkwy Midland, TX | 4.0 | 2.0 | 2178 | $3,200 | $1.47 | 45d | 1 | 0.54mi |
| 6606 Colony Rd Midland, TX | 3.0 | 2.0 | 1993 | $2,600 | $1.30 | 45d | 1 | 0.56mi |
| 6615 Colony Rd Midland, TX | 4.0 | 2.0 | 1916 | $2,900 | $1.51 | 45d | 1 | 0.57mi |
| 6612 Colony Rd Midland, TX | 4.0 | 2.5 | 2285 | $3,300 | $1.44 | 22d | 1 | 0.58mi |
| 719 Minuteman Midland, TX | 4.0 | 2.0 | 2525 | $2,950 | $1.17 | 15d | 1 | 0.72mi |
| 5202 Ric Dr Midland, TX | 3.0 | 2.0 | 1258 | $1,975 | $1.57 | 22d | 1 | 0.89mi |
| 7017 McPherson Ln Midland, TX | 4.0 | 3.0 | 2300 | $3,000 | $1.30 | 22d | 1 | 0.93mi |
| 7211 Thomas Paine Rd Midland, TX | 4.0 | 2.0 | 1783 | $2,800 | $1.57 | 22d | 1 | 1.09mi |
| 5109 Graceland Dr Unit A Midland, TX | 3.0 | 2.0 | 1365 | $2,250 | $1.65 | 45d | 1 | 1.29mi |
| 5205 Blue Haven Dr Midland, TX | 4.0 | 2.0 | 1539 | $6,000 | $3.90 | 45d | 1 | 1.30mi |
| 4732 Harvard Ave Midland, TX | 3.0 | 2.0 | 2248 | $2,600 | $1.16 | 22d | 1 | 1.30mi |
| 909 Beal Pkwy Midland, TX | 3.0 | 2.0 | 1670 | $2,200 | $1.32 | 22d | 1 | 1.36mi |
HOA detail
- Monthly dues
- $30 · $360/yr
Listing history 12 events
-
2026-06-19days on market $325,000 Active 15 DOM
-
2026-06-18days on market $325,000 Active 14 DOM
-
2026-06-17days on market $325,000 Active 13 DOM
-
2026-06-16days on market $325,000 Active 12 DOM
-
2026-06-15days on market $325,000 Active 11 DOM
-
2026-06-14days on market $325,000 Active 9 DOM
-
2026-06-13days on market $325,000 Active 8 DOM
-
2026-06-10days on market $325,000 Active 6 DOM
-
2026-06-09days on market $325,000 Active 5 DOM
-
2026-06-08days on market $325,000 Active 4 DOM
-
2026-06-07remarks 277-char remark
-
2026-06-07$325,000 Active 3 DOM
ⓘ Source: listings_history table (triggers on properties + properties_extension) + one-shot
backfill from property_details.listing_events for pre-trigger history.
Tax reassessment forecast TX · Resets to sale price
- Current annual tax
- $4,283 · $357/mo
- Projected year-2 tax
- $5,948 · $496/mo
- Expected delta
- +$1,664/yr (+$139/mo · 38.9%)
ⓘ Screening estimate from a state-policy table — verify with the county assessor before closing.
Climate risk First Street
- Flood 1/10 Low FEMA zone X · 0% chance over 30 yrs
- Wildfire 8/10 Severe
- Heat 6/10 Major 5 d/yr ≥102°F today · 16 d/yr by 30 yrs out
- Wind 2/10 Low 3% chance of damaging wind over 30 yrs
- Air quality 1/10 Low 0 unhealthy d/yr today · 0 by 30 yrs out
Nearby sold comps map
Loading sold comps map…
Walkable amenities ~0.75 mi
Loading nearby amenities…
Taxation est. · year 1
- Rental income
- $32,209
- − Mortgage interest
- −$18,205
- − Property taxes
- −$4,283
- − Insurance
- −$1,625
- − Repairs & maintenance
- −$2,577
- − Management
- −$2,577
- − HOA
- −$360
- − Depreciation
- −$9,455
- Taxable loss
- −$6,872
- Est. tax savings @ 24.0%
- +$1,649
- After-tax cash flow
- $374/yr
For passive investors: Depreciation is non-cash, so a rental often shows a tax loss while cash-flowing — sheltering income. Rental losses are passive: they offset passive income freely, and up to $25,000/yr can offset ordinary (W-2) income if you actively participate and your MAGI is under $100k (phasing out to $0 by $150k); unused losses carry forward. On sale, claimed depreciation is recaptured at up to 25%, and gains may owe capital-gains tax (a 1031 exchange can defer both). Figures are a year-1 estimate at your 24.0% rate — not tax advice; consult a CPA.
Schools (NCES district)
- District
- Midland ISD
- NCES district ID
- 4830570
- Math proficiency
- 34% ▼ -7.00%
- Reading proficiency
- 36% ▬ 0.00%
- Median HH income
- $63,457
- Composite
- 31.63/100
- National rank
- #5938
- State rank
- #477 of 826 in TX
Livability — Midland
- Score
- 79/100
- State rank
- #57
- US rank
- #2192
Category grades
Schools grade is shown separately in the Schools card above.
Census & demographics
- Census place
- Midland, TX
- County
- Midland County · 168,494 people
- City population
- 168,494
- Metro
- Midland, TX
- Population (ZIP)
- 34,281
- Household income
- $108,059
- Rent vs Own
- Severe rent burden
- 303.0
Population outlook (Midland County) Hauer SSP2
- Today (2025)
- 220,895 people
- By 2030
- 253,667 · +14.8%
- By 2040
- 325,498 · +47.4%
- By 2050
- 404,168 · +83.0%
- By 2075
- 609,802 · +176.1%
- By 2100
- 760,172 · +244.1%
Race, ethnicity, and origin ACS 2023
- Neighborhood character
- Diverse neighborhood (Simpson 0.58)
- Race & ethnicity
- Hispanic / Latino 48% White 44% Two or more races 13% Black 3% Asian 2%
- Hispanic origin (detail)
- Mexican 43% Cuban 1%
- Common ancestry
- Italian 1% Lithuanian 1% Swedish 1%
- Foreign-born
- 11% · Canada
- Languages at home
- 68% English-only · Spanish 30%
Political lean MEDSL · Midland
- 2024 margin
- Solid R (+60.5) · D 19.3% · R 79.8%
- 2008→2024 swing
- -3.3pp toward R · 2008: -57.3pp · 2024: -60.5pp
- All cycles
- 2024: R+60.5 2020: R+56.6 2016: R+55.2 2012: R+61.5 2008: R+57.3
Not yet ingested
- Civics
- —
Market trends
- HPI YoY
- ▼ -173.42%
- Current HPI
- 212.6467
- Rent YoY
- ▲ 2.75%
- Metro
- Midland, TX
- State GDP YoY
- ▲ 3.95%
- F500 in state
- 110
Industry mix (Fortune 500 HQ in TX)
| Industry | F500 HQs | Revenue |
|---|---|---|
| Energy | 16 | $1,198B |
|
||
| Technology | 5 | $198B |
|
||
| Engineering / Construction | 4 | $72B |
|
||
| Energy Services | 3 | $60B |
|
||
| Utilities | 3 | $41B |
|
||
| Healthcare | 2 | $330B |
|
||
Price history
1 event — show timeline
- 2026-06-04 Listed $325,000 ODMLS
Property tax history
+43.3%/yrLatest (2025): $4,283 · -4.4% YoY. Source: county tax records.
Cash-flow waterfall
monthlySold comps — $/sqft
last 12 mo · ≤1 miLoading sold comps…