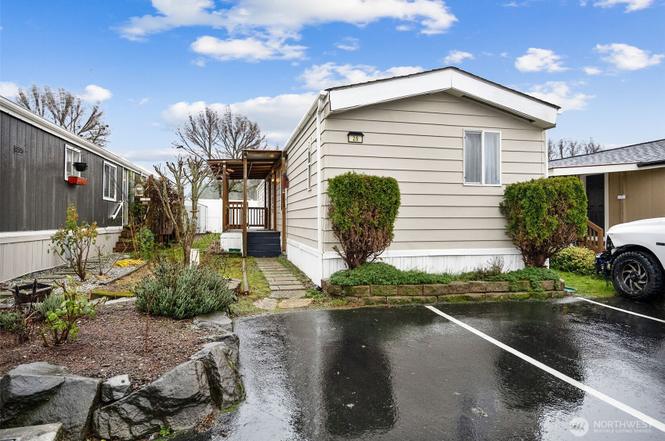
210 37th St SE #25 · Auburn, WA
Flood risk 1/10 · Minimal
- FEMA flood zone
- X (unshaded)
- Chance of flooding over 30 yrs
- 0.0%
- Est. flood insurance / yr
- $507 – $1,088
Fire risk 1/10 · Minimal
- Est. fire insurance / yr
- $604 – $1,122
Heat risk 3/10 · Minor
- Hot days now (above 88°F)
- 7 days/yr
- Hot days in 30 yrs
- 16 days/yr
Wind risk 1/10 · Minimal
- Chance of severe wind over 30 yrs
- —
Air-quality risk 7/10 · Major
- Unhealthy air days now
- 10 days/yr
- Unhealthy air days in 30 yrs
- 11 days/yr
Risk factors via First Street. Map © Google.
Why this score? — see what drove the B+ grade
The composite is a weighted blend of 9 inputs, each scored 0–100. Each bar is that input's sub-score; the figure is the points it added to the 100-point composite (weight × sub-score).
- Cash flow +30.0/30.0
- ARV discount +15.0/15.0
- 1% rule +10.0/10.0
- DSCR +10.0/10.0
- Schools +4.7/10.0
- Livability +4.0/5.0
- Rent growth +2.9/5.0
- Condition / age +2.5/5.0
- Appreciation +0.0/10.0
$59,500
🖨 Deal sheet 📄 Offer letter ✓ Due diligence
Listing remarks
Welcome home to effortless living in this thoughtfully updated 2-bed, 1.5-bath home located in a private gated community. Modern finishes include luxury vinyl plank floors and stylishly updated bathrooms with a tile shower. Whether you’re enjoying a morning workout in the gym, relaxing by the pool, or gathering with friends in the gaming room, this community has something for everyone. With easy access to the freeway and nearby shopping, restaurants, and parks, convenience is built into every day.
Key facts
- Gated community
- Updated bathrooms
- Gym
Tags
Property features AI
Finance
- Other: Mobile home remains
- Financial info: Land lease: $1,284; Listing terms: Cash or Conventional
- HOA & community: Auburn Manor community with clubhouse, pool, playground, exercise room, common area, BBQs, and security gate; 148 homes in the park; Park approved for sale
Exterior
- Parking: Uncovered parking; 2 open parking spaces
- Security: Security gate
- Utilities: Electric energy source; Electric water heater; Public water; Public sewer; Power: PSE; Cable: Comcast/CenturyLink; Internet: Comcast/CenturyLink
- Home design: Manufactured home (single wide); One level; Manufactured after 06/15/1976; Entry through gated community (Auburn Manor)
- Construction: Metal/vinyl construction materials; Composition roof; Tie down foundation; Manufactured house structure
- Exterior features: Metal/vinyl exterior; Patio/porch/deck; Landscaped; Paved lot; Sidewalk; Has view
Interior
- Kitchen: Kitchen with eating space
- Bedrooms: 2 bedrooms
- Flooring: Ceramic tile; Laminate; Stone; Carpet
- Bathrooms: 1 full bath; 1 half bath; 1 shower
- Heating & cooling: Forced air heating; No central cooling; Double pane windows
- Interior features: Water heater; Jetted/soaking tub; Bath off primary; Walk-in closet; Dining room; Entry; Kitchen with eating space; Living room; Utility room
- Laundry & utility: Utility room
Neighborhood map
What this means for you Summary
Snapshot
- This is a 2-bed/1.5-bath manufactured listed at $60k.
Deal economics
- At list price, monthly cash flow is $985 ($12k/yr) — positive.
- The deal already cash-flows at list — no discount required.
- Meets the 1% rule at list price ($2k rent vs $60k).
- Recommended offer: $52k (12.0% below list) — sets the bar for market timing.
- Cap rate 26.2% vs local median 2.7% in Auburn — top-decile yield for the area; either an underpriced asset or a hidden risk that comps aren't pricing in. Stress-test before assuming the spread holds.
Location & tenants
- Location reads 81/100 on livability (#75 in WA, #1,371 nationally) — a professional / high-income tenant draw. Strengths: amenities A+, commute A+, employment A+; Watch: crime F, cost of living F.
- Auburn School District (urban): math 47% / reading 56% proficiency, ranked #125 of 291 in WA (top 43%) — acceptable for families but not a draw, mixed tenant base, ~2y average lease.
- Zoned schools: Gildo Rey Elementary School (412 students, 76% FRL); Auburn Riverside High School (1,909 students, 50% FRL) — zoned schools average 63% FRL vs 44% district-wide (19 pts higher); higher-poverty schools than district average — tighter screening recommended.
- Market conditions: Rents rising (+1.5%/yr); 171 active listings in the ZIP; 12 comparable units currently listed for rent nearby; rentals leasing fast (median 13d on market — plan ~1-2 weeks tenant-placement turnaround); solid renter incomes; 10,555 units permitted in King County in 2024 (7,119 in 5+ unit buildings).
Forward outlook
- Local home prices are declining (-3.0%/yr); year-one equity from $411 of loan paydown is wiped out by about $2k of value loss. Plan a longer hold.
- King County population projected at +44% by 2050 — long-run rental-demand tailwind backs the buy-and-hold thesis.
- At projected returns (-3.0% appreciation + 1.5% rent growth), your $17k cash investment doubles in ~2 years — after that, you're playing with house money.
Negotiation context
- It's been on market 169 days — a 12% lower offer ($52k) is reasonable based on typical stale-listing flexibility.
- 3 sale attempts since 4y ago; this cycle's ask has dropped $30k (34%) from the opening price — seller is motivated, your offer sets the floor, not the list.
Questions for the listing agent
- It's been on market 169 days. Have you received any prior offers? Is the seller open to a 12% concession, seller financing, or rate buy-down credit?
- Why hasn't it sold? Are there any deal-killer items the seller is aware of (foundation, flood, title, zoning, code violations)?
- Is there a deadline driving the sale (1031 exchange, divorce, estate, relocation)? That informs how much negotiation room exists.
- Crime grade is F in this area — have there been break-ins, vandalism, or insurance claims at this property in the last 3 years? What carrier currently insures it and at what premium?
- What's the average days-on-market for RENTAL listings here right now (not sales)? A rising rental-DOM trend means longer vacancies and softer asking-rent achievability than the comps imply.
- What's the recent tenant-quality profile in this submarket — average credit score on applications, eviction rate, late-payment / NSF rate, and stable-employment percentage? A property-management company in the area should have these aggregated.
- How much new for-sale + rental construction is in the pipeline within 1–3 miles? Heavy new supply typically softens prices + rents 12–24 months out; constrained supply supports both.
Investment metrics
- 1% rule
- 2.97% ✓
- Cap rate
- 26.17%
- Cash-on-cash
- 70.98%
- DSCR
- 4.16
- GRM
- 2.8
CMA / ARV
- ARV (on-the-fly)
- $108,225
- Comps found
- 12
Show comp detail 12 sales within ~0.75 mi
| Address | Dist | Beds/Ba | Sqft | Sold | Price | $/sf | Match |
|---|---|---|---|---|---|---|---|
| 210 37th St SE #64 | 0.00mi | 2/2.0 | 960 (+4%) | 7mo | $72,000 | $75 | 86 |
| 418 37th St SE | 0.15mi | 3/2.0 (+1) | 924 (-0%) | 8mo | $225,000 | $244 | 79 |
| 4248 A St SE #205 | 0.27mi | 2/2.0 | 960 (+4%) | 1mo | $85,000 | $89 | 78 |
| 401 37th St SE #20 | 0.19mi | 2/1.0 | 896 (-3%) | 12mo | $100,000 | $112 | 74 |
| 4248 A St SE #317 | 0.26mi | 2/2.0 | 924 (-0%) | 14mo | $59,900 | $65 | 74 |
| 401 37th St SE #110 | 0.27mi | 3/1.0 (+1) | 980 (+6%) | 3mo | $127,000 | $130 | 68 |
| 401 37th St SE #112 | 0.19mi | 3/2.0 (+1) | 980 (+6%) | 11mo | $134,000 | $137 | 65 |
| 401 37th St SE #109 | 0.19mi | 3/2.0 (+1) | 980 (+6%) | 14mo | $126,500 | $129 | 63 |
| 800 29 TH St SE Unit G-12 | 0.67mi | 2/1.0 | 980 (+6%) | 0mo | $86,000 | $88 | 56 |
| 3225 M St SE #131 | 0.71mi | 2/2.0 | 900 (-3%) | 8mo | $105,000 | $117 | 54 |
| 900 29th St SE Unit D-11 | 0.73mi | 3/2.0 (+1) | 960 (+4%) | 3mo | $71,750 | $75 | 50 |
| 204 Cedar Ln | 0.69mi | 3/2.0 (+1) | 1,056 (+14%) | 13mo | $405,000 | $384 | 26 |
Match score weights: distance 35% · size 25% · config 20% · recency 20%. Top-matched comps best support the ARV.
Projected returns pro-forma
-3.0% appreciation · 1.51% rent growth · sell at horizon
- IRR
- 68.9%
- Equity multiple
- 4.03×
- Total profit
- $50,533
- Equity at exit
- $8,872
- IRR
- 72.5%
- Equity multiple
- 7.87×
- Total profit
- $114,525
- Equity at exit
- $5,144
Cash invested: $16,660 (down + closing). Projections, not guarantees.
Landlord ↔ Tenant lean methodology
- Overall (STATE)
- 28 Tenant-Leaning
- State Washington
- 28 Tenant-Leaning · D+8
- County
- — inherits STATE
- City
- — inherits STATE
ZIP-level market 98002
- Rents YoY
- 1.5%
- Active inventory
- 171
- Price-to-rent
- 2.8×
Monthly cashflow live
- Estimated rent
- $1,768 high interval (Pro) →
- Mortgage (P&I)
- −$312
- Tax est. 1.5%
- −$74 /mo · $892/yr
- Insurance
- −$25
- HOA
- −$0
- Vacancy / Maint / Mgmt
- −$371
- Net cashflow
- $985
Break-even live
UW: 25.0% down · 7.5% · 30yr · 1.5% tax · 5.0% vac · 8.0% maint · 8.0% mgmt
Financing live
Cash to close
- Down payment
- $14,875
- Closing costs
- $1,785
- Reserves months
- —
- Total cash needed
- —
Loan-product check · same deal, 3 products live
Conventional
25% down · 7.5% · 30yr
- Down + closing
- —
- Monthly P&I
- —
- Monthly cashflow
- —
- DSCR
- —
- Eligible?
- —
Personal DTI + credit; lowest rate.
DSCR
20% down · 8.5% · 30yr
- Down + closing
- —
- Monthly P&I
- —
- Monthly cashflow
- —
- DSCR
- —
- Eligible?
- —
No personal income docs; deal must DSCR.
Hard money
10% down · 12.0% · 12mo
- Down + closing
- —
- Monthly P&I
- —
- Monthly cashflow
- —
- DSCR
- —
- Eligible?
- —
Short-term bridge; refi at stabilization.
Rent comps 12 comps
| Address | Beds | Baths | Sqft | Rent | $/sqft | DOM | Units | Dist |
|---|---|---|---|---|---|---|---|---|
| 732 4th Ave NE Pacific, WA | 2.0 | 1.0 | 850 | $1,805 | $2.12 | 5d | 2 | 0.33mi |
| 1014 37th St SE Apt 4 Auburn, WA | 2.0 | 2.0 | 1005 | $1,780 | $1.77 | 5d | 1 | 0.52mi |
| 1120 37th St SE Auburn, WA | 2.0 | 1.0 | 788 | $1,695 | $2.15 | 12d | 1 | 0.59mi |
| 703 47th St SE Auburn, WA | 2.0 | 1.0–2.0 | 781 | $1,970 | $2.52 | 2d | 7 | 0.61mi |
| 404 27th St SE Unit 19-1 Auburn, WA | 2.0 | 1.0 | 1000 | $1,750 | $1.75 | 12d | 1 | 0.72mi |
| 2455 F St SE Auburn, WA | 1.0–3.0 | 1.0–2.0 | 757 | $1,678 | $2.21 | 3d | 6 | 0.90mi |
| 2952 O St SE Unit F Auburn, WA | 2.0 | 1.0 | 1051 | $1,495 | $1.42 | 2d | 1 | 0.92mi |
| 2952 O St SE Unit D Auburn, WA | 2.0 | 1.0 | 795 | $1,375 | $1.73 | 2d | 1 | 0.92mi |
| 1526 29th St SE Auburn, WA | 2.0 | 1.0 | 912 | $1,595 | $1.75 | 24d | 1 | 0.98mi |
| 402 21st St SE Auburn, WA | 1.0–2.0 | 1.0–1.5 | 747 | $1,695 | $2.27 | 15d | 4 | 1.08mi |
| 508 4th Ave SE Pacific, WA | 2.0 | 1.0 | 885 | $2,100 | $2.37 | 24d | 1 | 1.08mi |
| 2020 F St SE Auburn, WA | 1.0–2.0 | 1.0 | 725 | $1,599 | $2.21 | 24d | 1 | 1.18mi |
Listing history 15 events
-
2026-04-15price $59,500
-
2026-04-03price $65,000
-
2026-03-16price $69,000
-
2026-03-03price $80,000
-
2026-02-07price $86,000
-
2026-01-08price $88,000
-
2025-12-09$90,000 Active
-
2025-07-23soldstatus $73,000 Closed
-
2025-07-02status Pending
-
2025-06-01price $80,000
-
2025-02-26price $90,000
-
2025-02-06$95,000 Active
-
2022-11-29soldstatus $74,500 Closed
-
2022-11-15status Pending
-
2022-10-20$79,500 Active
ⓘ Source: listings_history table (triggers on properties + properties_extension) + one-shot
backfill from property_details.listing_events for pre-trigger history.
Climate risk First Street
- Flood 1/10 Low FEMA zone X (unshaded) · 0% chance over 30 yrs
- Wildfire 1/10 Low
- Heat 3/10 Moderate 7 d/yr ≥88°F today · 16 d/yr by 30 yrs out
- Wind 1/10 Low
- Air quality 7/10 Severe 10 unhealthy d/yr today · 11 by 30 yrs out
Nearby sold comps map
Loading sold comps map…
Walkable amenities ~0.75 mi
Loading nearby amenities…
Taxation est. · year 1
- Rental income
- $21,214
- − Mortgage interest
- −$3,333
- − Property taxes
- −$892
- − Insurance
- −$298
- − Repairs & maintenance
- −$1,697
- − Management
- −$1,697
- − Depreciation
- −$1,731
- Taxable income
- $11,566
- Est. tax owed @ 24.0%
- −$2,776
- After-tax cash flow
- $9,049/yr
For passive investors: Depreciation is non-cash, so a rental often shows a tax loss while cash-flowing — sheltering income. Rental losses are passive: they offset passive income freely, and up to $25,000/yr can offset ordinary (W-2) income if you actively participate and your MAGI is under $100k (phasing out to $0 by $150k); unused losses carry forward. On sale, claimed depreciation is recaptured at up to 25%, and gains may owe capital-gains tax (a 1031 exchange can defer both). Figures are a year-1 estimate at your 24.0% rate — not tax advice; consult a CPA.
Schools (NCES district)
- District
- Auburn School District
- NCES district ID
- 5300300
- Math proficiency
- 47% ▼ -3.00%
- Reading proficiency
- 56% ▼ -1.00%
- Median HH income
- $58,048
- Composite
- 46.73/100
- National rank
- #5240
- State rank
- #125 of 291 in WA
Livability — Auburn
- Score
- 81/100
- State rank
- #75
- US rank
- #1371
Category grades
Schools grade is shown separately in the Schools card above.
Census & demographics
- Census place
- Auburn, WA
- County
- King County · 2,251,916 people
- City population
- 74,969
- Metro
- Seattle-Tacoma-Bellevue, WA
- Population (ZIP)
- 37,509
- Household income
- $78,684
- Rent vs Own
- Severe rent burden
- 2202.0
Population outlook (King County) Hauer SSP2
- Today (2025)
- 2,576,485 people
- By 2030
- 2,803,316 · +8.8%
- By 2040
- 3,255,921 · +26.4%
- By 2050
- 3,706,444 · +43.9%
- By 2075
- 4,746,063 · +84.2%
- By 2100
- 5,407,730 · +109.9%
Race, ethnicity, and origin ACS 2023
- Neighborhood character
- Highly diverse neighborhood (Simpson 0.72)
- Race & ethnicity
- White 46% Hispanic / Latino 24% Two or more races 13% Black 12% Asian 6% Pacific Islander 4% Native American 2%
- Hispanic origin (detail)
- Mexican 20%
- Common ancestry
- Portuguese 4% Subsaharan African 4% Lithuanian 3%
- Foreign-born
- 24% · Canada, Vietnam
- Languages at home
- 63% English-only · Spanish 19% Russian/Polish/Slavic 6% Other Asian/Pacific 3%
Political lean MEDSL · King
- 2024 margin
- Solid D (+51.7) · D 74.2% · R 22.5% · Other 3.4%
- 2008→2024 swing
- +9.6pp toward D · 2008: 42.1pp · 2024: 51.7pp
- All cycles
- 2024: D+51.7 2020: D+52.7 2016: D+50.4 2012: D+39.9 2008: D+42.1
Not yet ingested
- Civics
- —
Market trends
- HPI YoY
- ▼ -677.96%
- Current HPI
- 298.0849
- Rent YoY
- ▲ 1.51%
- Metro
- Seattle-Tacoma-Bellevue, WA
- State GDP YoY
- ▲ 4.65%
- F500 in state
- 22
Industry mix (Fortune 500 HQ in WA)
| Industry | F500 HQs | Revenue |
|---|---|---|
| Retail | 2 | $269B |
|
||
| Technology / Retail | 1 | $638B |
|
||
| Technology | 1 | $245B |
|
||
| Telecommunications | 1 | $38B |
|
||
| Food / Beverage | 1 | $36B |
|
||
| Automotive / Trucks | 1 | $34B |
|
||
Price history
-25.2% since first listed15 events — show timeline
- 2026-04-15 Price Changed $59,500 NWMLS as Distributed by MLS Grid
- 2026-04-03 Price Changed $65,000 NWMLS as Distributed by MLS Grid
- 2026-03-16 Price Changed $69,000 NWMLS as Distributed by MLS Grid
- 2026-03-03 Price Changed $80,000 NWMLS as Distributed by MLS Grid
- 2026-02-07 Price Changed $86,000 NWMLS as Distributed by MLS Grid
- 2026-01-08 Price Changed $88,000 NWMLS as Distributed by MLS Grid
- 2025-12-09 Listed $90,000 NWMLS as Distributed by MLS Grid
- 2025-07-23 Sold (MLS) $73,000 NWMLS as Distributed by MLS Grid
- 2025-07-02 Pending — NWMLS as Distributed by MLS Grid
- 2025-06-01 Price Changed $80,000 NWMLS as Distributed by MLS Grid
- 2025-02-26 Price Changed $90,000 NWMLS as Distributed by MLS Grid
- 2025-02-06 Listed $95,000 NWMLS as Distributed by MLS Grid
- 2022-11-29 Sold (MLS) $74,500 NWMLS as Distributed by MLS Grid
- 2022-11-15 Pending — NWMLS as Distributed by MLS Grid
- 2022-10-20 Listed $79,500 NWMLS as Distributed by MLS Grid
Cash-flow waterfall
monthlySold comps — $/sqft
last 12 mo · ≤1 miLoading sold comps…