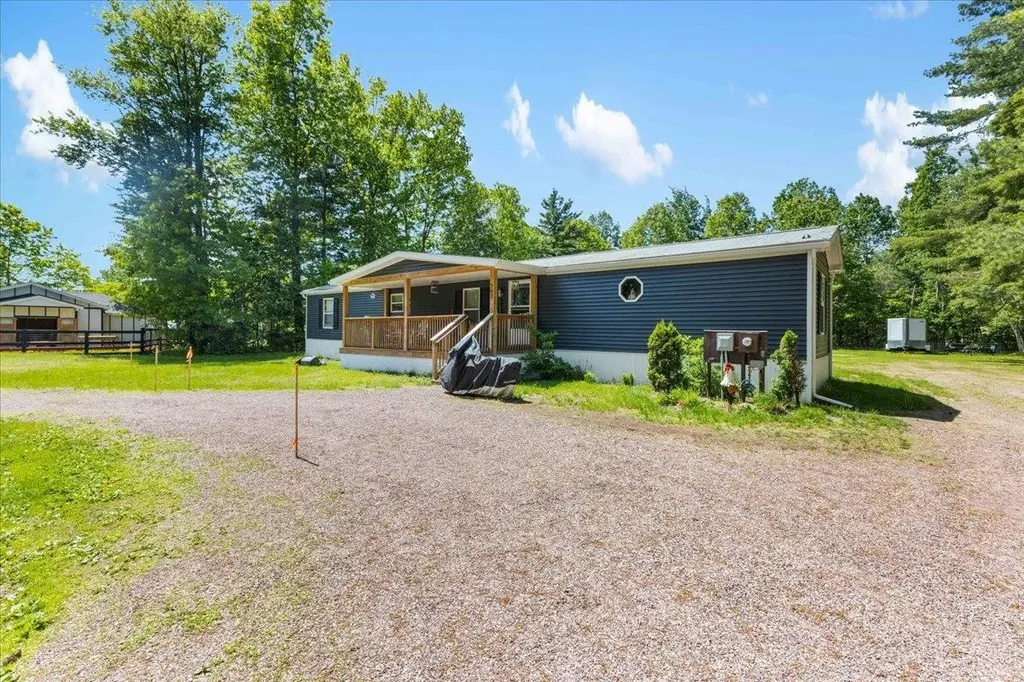
704 Bean Rd · Burlington, VT
Flood risk 1/10 · Minimal
- FEMA flood zone
- X (unshaded)
- Chance of flooding over 30 yrs
- 0.0%
- Est. flood insurance / yr
- $507 – $1,088
Fire risk 1/10 · Minimal
- Est. fire insurance / yr
- $480 – $892
Heat risk 3/10 · Minor
- Hot days now (above 93°F)
- 7 days/yr
- Hot days in 30 yrs
- 15 days/yr
Wind risk 2/10 · Minimal
- Chance of severe wind over 30 yrs
- 1.0%
Air-quality risk 2/10 · Minimal
- Unhealthy air days now
- 1 days/yr
- Unhealthy air days in 30 yrs
- 1 days/yr
Risk factors via First Street. Map © Google.
Why this score? — see what drove the A- grade
The composite is a weighted blend of 9 inputs, each scored 0–100. Each bar is that input's sub-score; the figure is the points it added to the 100-point composite (weight × sub-score).
- Cash flow +30.0/30.0
- 1% rule +10.0/10.0
- DSCR +10.0/10.0
- Appreciation +10.0/10.0
- ARV discount +7.5/15.0
- Schools +5.0/10.0
- Condition / age +3.8/5.0
- Livability +3.7/5.0
- Rent growth +2.5/5.0
$59,900
🖨 Deal sheet (PDF) 📄 Offer letter ✓ Due diligence
Listing remarks
Affordable housing opportunities like this are becoming harder and harder to find! Don’t miss your chance to own this well-maintained 2013 Commodore Astro single-wide mobile home offering 3 bedrooms, 1 bathroom, and approximately 1,086 sq ft of comfortable living space. With many recent improvements already completed, this home presents an outstanding value for anyone looking for an affordable primary residence, investment opportunity, or a move-in-ready home to place on their own land. This 14x72 home offers a functional and efficient layout with spacious living areas, great natural light, and practical everyday living. Whether you’re looking to downsize, create an affordable h
Key facts
- Built 2013
- Listed 15 days
Property features AI
Exterior
- Utilities: No public sewer; No public water; 100 Amp electric; No internet listed; No other utilities listed
- Home design: Manufactured/Mobile home; Existing construction
- Construction: Built in 2013; Shingle roof; Commodore Astro mobile
- Exterior features: Vinyl siding; Blue exterior color; Driveway: Other; Lot features: Other; Road frontage: Other
Interior
- Bathrooms: 1 full bathroom
- Heating & cooling: House unit heating
- Interior features: 5 total rooms
Neighborhood map
What this means for you Summary
Snapshot
- This is a 3-bed/1.0-bath manufactured listed at $60k. Condition is rated good.
Deal economics
- At list price, monthly cash flow is $2k ($19k/yr) — positive.
- The deal already cash-flows at list — no discount required.
- Meets the 1% rule at list price ($2k rent vs $60k).
- Recommended offer: $59k (1.5% below list) — sets the bar for market timing.
- Cap rate 37.3% vs local median 3.1% in Burlington — top-decile yield for the area; either an underpriced asset or a hidden risk that comps aren't pricing in. Stress-test before assuming the spread holds.
Location & tenants
- Location reads 74/100 on livability (#19 in VT, #4,619 nationally) — a middle-class / working-renter tenant base. Strengths: commute A+, health & safety A+, schools B; Watch: cost of living D, crime F, amenities F.
- Market conditions: 23 active listings in the ZIP; 2 comparable units currently listed for rent nearby; 898 units permitted in Chittenden County in 2024 (554 in 5+ unit buildings).
Forward outlook
- In year one you build about $6k of equity ($414 loan paydown + $6k appreciation (10.0% local appreciation)).
- Chittenden County population projected at +8% by 2050 — modest demand growth; plan on rents tracking national, not racing it.
- At projected returns (10.0% appreciation + 3.0% rent growth), your $17k cash investment doubles in ~1 year — after that, you're playing with house money.
- By year 6, paydown + projected appreciation supports a ~$38k cash-out refi (75% LTV) — recoverable capital for the next deal without selling this one.
Negotiation context
- It's been on market 16 days — a 2% lower offer ($59k) is reasonable based on typical stale-listing flexibility.
Questions for the listing agent
- Is there a deadline driving the sale (1031 exchange, divorce, estate, relocation)? That informs how much negotiation room exists.
- Schools are B-rated — typically a magnet for longer-tenancy family renters. What's the average tenant stay here, and is there a school-zone premium baked into asking?
- Crime grade is F in this area — have there been break-ins, vandalism, or insurance claims at this property in the last 3 years? What carrier currently insures it and at what premium?
- What's the average days-on-market for RENTAL listings here right now (not sales)? A rising rental-DOM trend means longer vacancies and softer asking-rent achievability than the comps imply.
- What's the recent tenant-quality profile in this submarket — average credit score on applications, eviction rate, late-payment / NSF rate, and stable-employment percentage? A property-management company in the area should have these aggregated.
- How much new for-sale + rental construction is in the pipeline within 1–3 miles? Heavy new supply typically softens prices + rents 12–24 months out; constrained supply supports both.
Investment metrics
- 1% rule
- 4.14% ✓
- Cap rate
- 37.27%
- Cash-on-cash
- 110.62%
- DSCR
- 5.92
- GRM
- 2.0
CMA / ARV
No comps found within radius.
Projected returns pro-forma
10.0% appreciation · 3.0% rent growth · sell at horizon
- IRR
- —
- Equity multiple
- 8.82×
- Total profit
- $131,129
- Equity at exit
- $53,963
- IRR
- —
- Equity multiple
- 19.41×
- Total profit
- $308,794
- Equity at exit
- $116,373
Cash invested: $16,772 (down + closing). Projections, not guarantees.
Landlord ↔ Tenant lean methodology
- Overall (STATE)
- 41 Moderately Tenant-Leaning
- State Vermont
- 41 Moderately Tenant-Leaning · D+15
- County
- — inherits STATE
- City
- — inherits STATE
ZIP-level market 05464
- Home prices YoY
- 9.2%
- Active inventory
- 23
- Price-to-rent
- 2.0×
Monthly cashflow live
- Estimated rent
- $2,481 medium interval (Pro) →
- Mortgage (P&I)
- −$314
- Tax est. 1.5%
- −$75 /mo · $898/yr
- Insurance
- −$25
- HOA
- −$0
- Vacancy / Maint / Mgmt
- −$521
- Net cashflow
- $1,546
Break-even live
Sensitivity live
| Price | -10% $1,587 | -5% $1,567 | +0% $1,546 | +5% $1,525 | +10% $1,505 |
|---|---|---|---|---|---|
| Rent | -10% $1,350 | -5% $1,448 | +0% $1,546 | +5% $1,644 | +10% $1,742 |
| Rate | -1.0pp $1,576 | -0.5pp $1,561 | base $1,546 | +0.5pp $1,531 | +1.0pp $1,515 |
UW: 25.0% down · 7.5% · 30yr · 1.5% tax · 5.0% vac · 8.0% maint · 8.0% mgmt
Financing live
Cash to close
- Down payment
- $14,975
- Closing costs
- $1,797
- Reserves months
- —
- Total cash needed
- —
Loan-product check · same deal, 3 products live
Conventional
25% down · 7.5% · 30yr
- Down + closing
- —
- Monthly P&I
- —
- Monthly cashflow
- —
- DSCR
- —
- Eligible?
- —
Personal DTI + credit; lowest rate.
DSCR
20% down · 8.5% · 30yr
- Down + closing
- —
- Monthly P&I
- —
- Monthly cashflow
- —
- DSCR
- —
- Eligible?
- —
No personal income docs; deal must DSCR.
Hard money
10% down · 12.0% · 12mo
- Down + closing
- —
- Monthly P&I
- —
- Monthly cashflow
- —
- DSCR
- —
- Eligible?
- —
Short-term bridge; refi at stabilization.
Rent comps 2 comps
| Address | Beds | Baths | Sqft | Rent | $/sqft | DOM | Units | Dist |
|---|---|---|---|---|---|---|---|---|
| 18 Valade St Burlington, VT | 2.0 | 1.0 | 1080 | $2,400 | $2.22 | 22d | 1 | 1.13mi |
| 1540 North Ave Burlington, VT | 3.0 | 1.5 | 1220 | $2,600 | $2.13 | 44d | 1 | 1.48mi |
Listing history 14 events
-
2026-06-19days on market $59,900 Active 16 DOM
-
2026-06-18price $59,900 Active 15 DOM
-
2026-06-18days on market $69,900 Active 15 DOM
-
2026-06-17days on market $69,900 Active 14 DOM
-
2026-06-16days on market $69,900 Active 13 DOM
-
2026-06-15days on market $69,900 Active 12 DOM
-
2026-06-14days on market $69,900 Active 10 DOM
-
2026-06-13days on market $69,900 Active 9 DOM
-
2026-06-10pricedays on market $69,900 Active 7 DOM
-
2026-06-09days on market $79,900 Active 6 DOM
-
2026-06-08days on market $79,900 Active 5 DOM
-
2026-06-07days on market $79,900 Active 4 DOM
-
2026-06-03remarks 687-char remark
-
2026-06-03$79,900 Active 1 DOM
ⓘ Source: listings_history table (triggers on properties + properties_extension) + one-shot
backfill from property_details.listing_events for pre-trigger history.
Climate risk First Street
- Flood 1/10 Low FEMA zone X (unshaded) · 0% chance over 30 yrs
- Wildfire 1/10 Low
- Heat 3/10 Moderate 7 d/yr ≥93°F today · 15 d/yr by 30 yrs out
- Wind 2/10 Low 100% chance of damaging wind over 30 yrs
- Air quality 2/10 Low 1 unhealthy d/yr today · 1 by 30 yrs out
Nearby sold comps map
Loading sold comps map…
Walkable amenities ~0.75 mi
Loading nearby amenities…
Taxation est. · year 1
- Rental income
- $29,772
- − Mortgage interest
- −$3,355
- − Property taxes
- −$898
- − Insurance
- −$300
- − Repairs & maintenance
- −$2,382
- − Management
- −$2,382
- − Depreciation
- −$1,743
- Taxable income
- $18,713
- Est. tax owed @ 24.0%
- −$4,491
- After-tax cash flow
- $14,062/yr
For passive investors: Depreciation is non-cash, so a rental often shows a tax loss while cash-flowing — sheltering income. Rental losses are passive: they offset passive income freely, and up to $25,000/yr can offset ordinary (W-2) income if you actively participate and your MAGI is under $100k (phasing out to $0 by $150k); unused losses carry forward. On sale, claimed depreciation is recaptured at up to 25%, and gains may owe capital-gains tax (a 1031 exchange can defer both). Figures are a year-1 estimate at your 24.0% rate — not tax advice; consult a CPA.
Condition & rehab AI · 13 photos
This 2013 Commodore Astro single-wide mobile home is in good condition with recent improvements, offering a move-in-ready living space.
Value-add opportunities
- Both Paint exterior — Enhances curb appeal and resale value
- Both Landscaping — Improves curb appeal and rental value
Renovation cost estimate screening
Value-add ROI direction
- Both Paint exterior — Enhances curb appeal and resale value ↑
- Both Landscaping — Improves curb appeal and rental value ↑
ⓘ Cost ranges are severity-bucket heuristics (US national rule-of-thumb). Get contractor quotes + a written scope before underwriting a rehab budget.
Schools (NCES district)
No district data.
Livability — Burlington
- Score
- 74/100
- State rank
- #19
- US rank
- #4619
Category grades
Schools grade is shown separately in the Schools card above.
Census & demographics
- City population
- 31,662
- Population (ZIP)
- 3,125
Population outlook (Chittenden County) Hauer SSP2
- Today (2025)
- 170,769 people
- By 2030
- 174,716 · +2.3%
- By 2040
- 180,337 · +5.6%
- By 2050
- 183,768 · +7.6%
- By 2075
- 194,646 · +14.0%
- By 2100
- 194,933 · +14.2%
Race, ethnicity, and origin ACS 2023
- Neighborhood character
- Predominantly White (92%)
- Race & ethnicity
- White 92% Two or more races 5% Black 2%
- Common ancestry
- Italian 6% Lithuanian 4% Romanian 3%
- Foreign-born
- 1%
Political lean MEDSL · Chittenden
- 2024 margin
- Solid D (+53.6) · D 75.4% · R 21.7% · Other 2.9%
- 2008→2024 swing
- +8.9pp toward D · 2008: 44.8pp · 2024: 53.6pp
- All cycles
- 2024: D+53.6 2020: D+54.5 2016: D+46.8 2012: D+41.9 2008: D+44.8
Not yet ingested
- Civics
- —
Market trends
- HPI YoY
- ▲ 26.25%
- Current HPI
- 310.9551
- Rent YoY
- —
- Metro
- —
- State GDP YoY
- —
- F500 in state
- 0
Price history
1 event — show timeline
- 2026-06-03 Listed $79,900 PrimeMLS
Cash-flow waterfall
monthlySold comps — $/sqft
last 12 mo · ≤1 miLoading sold comps…