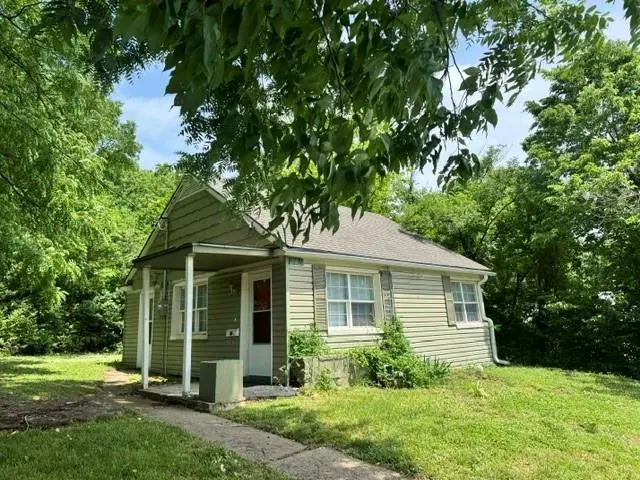
220 Corbin St · Liberty, MO
Flood risk 1/10 · Minimal
- FEMA flood zone
- X (unshaded)
- Chance of flooding over 30 yrs
- 0.0%
- Est. flood insurance / yr
- $507 – $1,088
Fire risk 3/10 · Minor
- Est. fire insurance / yr
- $1,054 – $1,958
Heat risk 4/10 · Minor
- Hot days now (above 107°F)
- 7 days/yr
- Hot days in 30 yrs
- 17 days/yr
Wind risk 2/10 · Minimal
- Chance of severe wind over 30 yrs
- —
Air-quality risk 3/10 · Minor
- Unhealthy air days now
- 4 days/yr
- Unhealthy air days in 30 yrs
- 4 days/yr
Risk factors via First Street. Map © Google.
Why this score? — see what drove the C grade
The composite is a weighted blend of 9 inputs, each scored 0–100. Each bar is that input's sub-score; the figure is the points it added to the 100-point composite (weight × sub-score).
- Cash flow +19.3/30.0
- ARV discount +15.0/15.0
- DSCR +6.1/10.0
- Schools +4.5/10.0
- 1% rule +4.3/10.0
- Livability +4.0/5.0
- Rent growth +3.7/5.0
- Condition / age +2.5/5.0
- Appreciation +0.0/10.0
$125,000
🖨 Deal sheet 📄 Offer letter ✓ Due diligence
Listing remarks MLS
The cutest little cottage on the hill. Owner-agent.
Key facts
- Vinyl windows
- Off street parking
- Updated kitchen
Tags
Property features AI
Finance
- Other: Living area reported as 625 (source: public records)
- Financial info: No investor or income/expense details provided
- HOA & community: No community maintenance provided
Exterior
- Parking: Off-street parking
- Security: No security features provided
- Utilities: Public water; Public sewer; High-speed internet available
- Home design: Single-family residence; One-story (ranch)
- Construction: Vinyl siding; Composition roof; Approximately 76–100 years old (age range)
- Exterior features: City lot within city limits; Paved road access; Shed(s) on the property; Lot maintenance not provided by community
Interior
- Kitchen: Kitchen on the first floor
- Bedrooms: 2 bedrooms (both on the first floor)
- Flooring: Carpet; Vinyl
- Bathrooms: 1 full bathroom (on the first floor)
- Heating & cooling: Natural gas heating; Electric cooling (has cooling)
- Interior features: Ranch floor plan; Crawl space basement
- Laundry & utility: No specific laundry details provided
Neighborhood map
What this means for you Summary
Snapshot
- This is a 2-bed/1.0-bath single-family listed at $125k.
Deal economics
- At list price, monthly cash flow is $137 ($2k/yr) — positive.
- The deal already cash-flows at list — no discount required.
- To meet the 1% rule (rent ≥ 1% of price), the offer needs to be $117k (6.6% below list).
- Recommended offer: $117k (6.6% below list) — sets the bar for 1% rule.
- Cap rate 7.6% vs local median 2.6% in Liberty — top-decile yield for the area; either an underpriced asset or a hidden risk that comps aren't pricing in. Stress-test before assuming the spread holds.
Location & tenants
- Location reads 81/100 on livability (#15 in MO, #1,487 nationally) — a professional / high-income tenant draw. Strengths: employment A+, cost of living A+, housing A+; Watch: commute F.
- Liberty 53 (suburban): math 41% / reading 59% proficiency, ranked #24 of 324 in MO (top 7%) — acceptable for families but not a draw, mixed tenant base, ~2y average lease; only 15% free/reduced lunch — higher-income household profile.
- Market conditions: Rents rising fast (+4.7%/yr); 189 active listings in the ZIP; 3 comparable units currently listed for rent nearby; rentals leasing fast (median 2d on market — plan ~1-2 weeks tenant-placement turnaround); solid renter incomes; 341 units permitted in Clay County in 2024 (40 in 5+ unit buildings).
- This rent is only 15% of the median local income ($92k/yr) — well below the 30% rent-burden line; pricing power to push rent on renewal without tenant pushback.
Forward outlook
- Local home prices are declining (-3.0%/yr); year-one equity from $864 of loan paydown is wiped out by about $4k of value loss. Plan a longer hold.
- Clay County population projected at +24% by 2050 — long-run rental-demand tailwind backs the buy-and-hold thesis.
Negotiation context
- Only 11 days on market — expect competitive offers; lowballing is unlikely to land.
- 6 sale attempts since 27y ago with the ask held roughly flat each time — persistent listings suggest the price (not the market) is what's stuck; bring a comps-based counter.
Risks & watch-outs
- Watch-outs: built in 1945 — expect roof / HVAC / electrical / plumbing capex.
Questions for the listing agent
- Built in 1945 — when were the roof, HVAC, electrical panel, plumbing, and water heater last replaced?
- Is there a deadline driving the sale (1031 exchange, divorce, estate, relocation)? That informs how much negotiation room exists.
- Schools are B-rated — typically a magnet for longer-tenancy family renters. What's the average tenant stay here, and is there a school-zone premium baked into asking?
- What's the average days-on-market for RENTAL listings here right now (not sales)? A rising rental-DOM trend means longer vacancies and softer asking-rent achievability than the comps imply.
- What's the recent tenant-quality profile in this submarket — average credit score on applications, eviction rate, late-payment / NSF rate, and stable-employment percentage? A property-management company in the area should have these aggregated.
- How much new for-sale + rental construction is in the pipeline within 1–3 miles? Heavy new supply typically softens prices + rents 12–24 months out; constrained supply supports both.
Investment metrics
- 1% rule
- 0.93% ✗
- Cap rate
- 7.60%
- Cash-on-cash
- 4.68%
- DSCR
- 1.21
- GRM
- 8.9
CMA / ARV
- ARV (on-the-fly)
- $151,250
- Comps found
- 1
Show comp detail 1 sale within ~0.75 mi
| Address | Dist | Beds/Ba | Sqft | Sold | Price | $/sf | Match |
|---|---|---|---|---|---|---|---|
| 315 W Franklin St | 0.39mi | 2/1.0 | 620 (-1%) | 12mo | $150,000 | $242 | 71 |
Match score weights: distance 35% · size 25% · config 20% · recency 20%. Top-matched comps best support the ARV.
Projected returns pro-forma
-3.0% appreciation · 4.69% rent growth · sell at horizon
- IRR
- -7.3%
- Equity multiple
- 0.73×
- Total profit
- $-9,569
- Equity at exit
- $18,638
- IRR
- 4.1%
- Equity multiple
- 1.32×
- Total profit
- $11,319
- Equity at exit
- $10,808
Cash invested: $35,000 (down + closing). Projections, not guarantees.
Landlord ↔ Tenant lean methodology
- Overall (STATE)
- 81 Strongly Landlord-Friendly
- State Missouri
- 81 Strongly Landlord-Friendly · R+10
- County
- — inherits STATE
- City
- — inherits STATE
ZIP-level market 64068
- Rents YoY
- 4.7%
- Active inventory
- 189
- Price-to-rent
- 8.9×
Monthly cashflow live
- Estimated rent
- $1,167 medium interval (Pro) →
- Mortgage (P&I)
- −$656
- Tax from tax record
- −$78 /mo · $938/yr
- Insurance
- −$52
- HOA
- −$0
- Vacancy / Maint / Mgmt
- −$245
- Net cashflow
- $137
Break-even live
UW: 25.0% down · 7.5% · 30yr · 1.5% tax · 5.0% vac · 8.0% maint · 8.0% mgmt
Financing live
Cash to close
- Down payment
- $31,250
- Closing costs
- $3,750
- Reserves months
- —
- Total cash needed
- —
Loan-product check · same deal, 3 products live
Conventional
25% down · 7.5% · 30yr
- Down + closing
- —
- Monthly P&I
- —
- Monthly cashflow
- —
- DSCR
- —
- Eligible?
- —
Personal DTI + credit; lowest rate.
DSCR
20% down · 8.5% · 30yr
- Down + closing
- —
- Monthly P&I
- —
- Monthly cashflow
- —
- DSCR
- —
- Eligible?
- —
No personal income docs; deal must DSCR.
Hard money
10% down · 12.0% · 12mo
- Down + closing
- —
- Monthly P&I
- —
- Monthly cashflow
- —
- DSCR
- —
- Eligible?
- —
Short-term bridge; refi at stabilization.
Rent comps 3 comps
| Address | Beds | Baths | Sqft | Rent | $/sqft | DOM | Units | Dist |
|---|---|---|---|---|---|---|---|---|
| 112 E Franklin St Unit 10 Liberty, MO | 1.0 | 1.0 | 750 | $1,080 | $1.44 | 43d | 1 | 0.44mi |
| 307 Forrest Ave Liberty, MO | 1.0–3.0 | 1.0 | 754 | $1,185 | $1.57 | 1d | 1 | 1.32mi |
| 1220 Missouri Ct Liberty, MO | 1.0–2.0 | 1.0 | 642 | $1,240 | $1.93 | 1d | 23 | 1.38mi |
Listing history 10 events
-
2026-05-18$125,000 Active
-
2026-01-23historical $900
-
2025-11-20$900
-
2015-02-10soldstatus 51-char remark
Show marketing remark (51 chars)
The cutest little cottage on the hill. Owner-agent.
-
2015-02-10soldstatus
Show marketing remark (51 chars)
The cutest little cottage on the hill. Owner-agent.
-
2015-01-26$45,000 51-char remark
Show marketing remark (51 chars)
The cutest little cottage on the hill. Owner-agent.
-
2012-09-22$46,500 244-char remark
Show marketing remark (244 chars)
Charming Cottage Type House on the Hill with Lots of Trees and a Little Privacy. Cute Master Bedroom with Corner Windows. Some Updating, Vinyl Siding and Windows. New Furnace in 2012. Come Take a Look and See What this Home Offers. Owner-Agent.
-
2007-10-13$62,000
-
1999-09-28soldstatus
-
1999-08-07$20,900
ⓘ Source: listings_history table (triggers on properties + properties_extension) + one-shot
backfill from property_details.listing_events for pre-trigger history.
Tax reassessment forecast MO · Resets to sale price
- Current annual tax
- $938 · $78/mo
- Projected year-2 tax
- $1,212 · $101/mo
- Expected delta
- +$275/yr (+$23/mo · 29.3%)
ⓘ Screening estimate from a state-policy table — verify with the county assessor before closing.
Climate risk First Street
- Flood 1/10 Low FEMA zone X (unshaded) · 0% chance over 30 yrs
- Wildfire 3/10 Moderate
- Heat 4/10 Moderate 7 d/yr ≥107°F today · 17 d/yr by 30 yrs out
- Wind 2/10 Low
- Air quality 3/10 Moderate 4 unhealthy d/yr today · 4 by 30 yrs out
Nearby sold comps map
Loading sold comps map…
Walkable amenities ~0.75 mi
Loading nearby amenities…
Taxation est. · year 1
- Rental income
- $14,010
- − Mortgage interest
- −$7,002
- − Property taxes
- −$938
- − Insurance
- −$625
- − Repairs & maintenance
- −$1,121
- − Management
- −$1,121
- − Depreciation
- −$3,636
- Taxable loss
- −$433
- Est. tax savings @ 24.0%
- +$104
- After-tax cash flow
- $1,743/yr
For passive investors: Depreciation is non-cash, so a rental often shows a tax loss while cash-flowing — sheltering income. Rental losses are passive: they offset passive income freely, and up to $25,000/yr can offset ordinary (W-2) income if you actively participate and your MAGI is under $100k (phasing out to $0 by $150k); unused losses carry forward. On sale, claimed depreciation is recaptured at up to 25%, and gains may owe capital-gains tax (a 1031 exchange can defer both). Figures are a year-1 estimate at your 24.0% rate — not tax advice; consult a CPA.
Schools (NCES district)
- District
- Liberty 53
- NCES district ID
- 2918540
- Math proficiency
- 41% ▼ -9.00%
- Reading proficiency
- 59% ▼ -3.00%
- Median HH income
- $78,226
- Composite
- 45.41/100
- National rank
- #2624
- State rank
- #24 of 324 in MO
Livability — Liberty
- Score
- 81/100
- State rank
- #15
- US rank
- #1487
Category grades
Schools grade is shown separately in the Schools card above.
Census & demographics
- Census place
- Liberty, MO
- County
- Clay County · 220,651 people
- City population
- 37,758
- Metro
- Kansas City, MO-KS
- Population (ZIP)
- 37,758
- Household income
- $92,297
- Rent vs Own
- Severe rent burden
- 695.0
Population outlook (Clay County) Hauer SSP2
- Today (2025)
- 266,022 people
- By 2030
- 280,057 · +5.3%
- By 2040
- 306,153 · +15.1%
- By 2050
- 328,630 · +23.5%
- By 2075
- 375,182 · +41.0%
- By 2100
- 392,861 · +47.7%
Race, ethnicity, and origin ACS 2023
- Neighborhood character
- Predominantly White (85%)
- Race & ethnicity
- White 85% Hispanic / Latino 5% Two or more races 5% Black 4% Asian 2%
- Hispanic origin (detail)
- Mexican 3%
- Common ancestry
- Lithuanian 3% Italian 3% Slovak 3%
- Foreign-born
- 2% · Canada, China
- Languages at home
- 97% English-only · Spanish 1%
Political lean MEDSL · Clay
- 2024 margin
- Lean R (+5.6) · D 46.4% · R 52.0% · Other 1.6%
- 2008→2024 swing
- -4.9pp toward R · 2008: -0.7pp · 2024: -5.6pp
- All cycles
- 2024: R+5.6 2020: R+4.1 2016: R+11.1 2012: R+8.4 2008: R+0.7
Not yet ingested
- Civics
- —
Market trends
- HPI YoY
- ▼ -233.70%
- Current HPI
- 223.1569
- Rent YoY
- ▲ 4.69%
- Metro
- Kansas City, MO-KS
- State GDP YoY
- ▲ 1.84%
- F500 in state
- 20
Industry mix (Fortune 500 HQ in MO)
| Industry | F500 HQs | Revenue |
|---|---|---|
| Healthcare | 1 | $163B |
|
||
| Insurance | 1 | $21B |
|
||
| Industrial Technology | 1 | $17B |
|
||
| Retail | 1 | $16B |
|
||
| Industrial Distribution | 1 | $10B |
|
||
| Utilities | 1 | $9B |
|
||
Price history
+498.1% since first listed10 events — show timeline
- 2026-05-18 Listed $125,000 Heartland MLS as Distributed by MLS Grid
- 2026-01-23 Rental Removed $900 RENTLY
- 2025-11-20 Listed for Rent $900 RENTLY
- 2015-02-10 Sold (Public Records) — Public Records
- 2015-02-10 Sold (MLS) — Heartland MLS as Distributed by MLS Grid
- 2015-01-26 Listed $45,000 Heartland MLS as Distributed by MLS Grid
- 2012-09-22 Listed $46,500 Heartland MLS as Distributed by MLS Grid
- 2007-10-13 Listed $62,000 Heartland MLS as Distributed by MLS Grid
- 1999-09-28 Sold (MLS) — Heartland MLS as Distributed by MLS Grid
- 1999-08-07 Listed $20,900 Heartland MLS as Distributed by MLS Grid
Property tax history
+2.6%/yrLatest (2025): $938 · +7.3% YoY. Source: county tax records.
Cash-flow waterfall
monthlySold comps — $/sqft
last 12 mo · ≤1 miLoading sold comps…