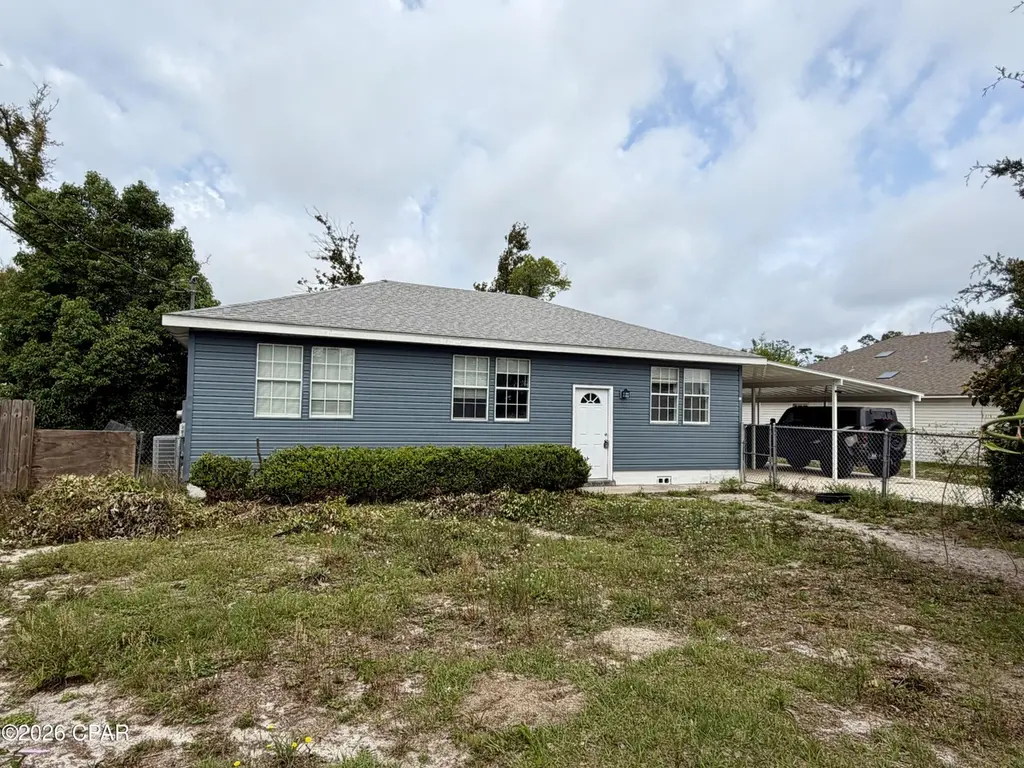
125 N Kimbrel Ave · Callaway, FL
Flood risk 1/10 · Minimal
- FEMA flood zone
- X (unshaded)
- Chance of flooding over 30 yrs
- 0.0%
- Est. flood insurance / yr
- $507 – $1,088
Fire risk 5/10 · Moderate
- Est. fire insurance / yr
- $947 – $1,759
Heat risk 10/10 · Severe
- Hot days now (above 104°F)
- 7 days/yr
- Hot days in 30 yrs
- 21 days/yr
Wind risk 9/10 · Severe
- Chance of severe wind over 30 yrs
- 99.0%
Air-quality risk 1/10 · Minimal
- Unhealthy air days now
- 0 days/yr
- Unhealthy air days in 30 yrs
- 0 days/yr
Risk factors via First Street. Map © Google.
Why this score? — see what drove the D+ grade
The composite is a weighted blend of 9 inputs, each scored 0–100. Each bar is that input's sub-score; the figure is the points it added to the 100-point composite (weight × sub-score).
- ARV discount +15.0/15.0
- Cash flow +13.7/30.0
- Schools +4.3/10.0
- DSCR +4.1/10.0
- Livability +3.2/5.0
- 1% rule +2.8/10.0
- Rent growth +2.8/5.0
- Condition / age +2.5/5.0
- Appreciation +0.0/10.0
$187,900
🖨 Deal sheet (PDF) 📄 Offer letter ✓ Due diligence
Listing remarks MLS
* * PERFECT INVESTOR PROPERTY * * 2 bedroom 1 bath home is ready for an investor to come and finish house. Sellers have had a new roof, HVAC roughed in, several new windows, oak hardwood flooring over diagonal 1x6 subfloor. Show to invertors today! All ages, sizes including sq. ft. are approximate measure in important.
Key facts
- Big back yard
- 0.25 acre lot
- 2 parking spots
Tags
Property features AI
Finance
- HOA & community: Short-term rentals allowed
Exterior
- Parking: Covered parking for 2 vehicles
- Utilities: Electricity available; Public sewer
- Home design: Single-family/mobile property; Mobile dimensions measured in feet
- Construction: Vinyl siding; Composition/shingle roof
- Exterior features: Partial fencing; Paved lot; City street frontage; Publicly maintained road
Interior
- Kitchen: Electric range
- Bedrooms: Two bedrooms on the first level (each about 22 x 12)
- Bathrooms: One full bathroom
- Heating & cooling: Central heating (electric); Central air conditioning; Ceiling fans
- Interior features: Central air conditioning; Ceiling fans
- Laundry & utility: Electric water heater
Neighborhood map
What this means for you Summary
Snapshot
- This is a 2-bed/1.0-bath single-family listed at $188k.
Deal economics
- At list price, monthly cash flow is $12 ($146/yr) — positive.
- The deal already cash-flows at list — no discount required.
- To meet the 1% rule (rent ≥ 1% of price), the offer needs to be $147k (21.7% below list).
- Recommended offer: $147k (21.7% below list) — sets the bar for 1% rule.
- Cap rate 6.4% vs local median 5.1% in Callaway — meaningfully above typical; check what's discounted (condition, days-on-market, listing class) to confirm the premium yield is real.
Location & tenants
- Location reads 64/100 on livability (#690 in FL) — a middle-class / working-renter tenant base. Strengths: cost of living A+, housing A+; Watch: employment D+, schools F, amenities F.
- Bay (suburban): math 51% / reading 51% proficiency, ranked #29 of 73 in FL (top 40%) — acceptable for families but not a draw, mixed tenant base, ~2y average lease.
- Market conditions: Rents rising (+1.1%/yr); 969 active listings in the ZIP; 31 comparable units currently listed for rent nearby; rentals at typical pace (median 22d on market — plan ~3-4 weeks tenant-placement turnaround); 2,473 units permitted in Bay County in 2024 (559 in 5+ unit buildings).
Forward outlook
- Local home prices are declining (-3.0%/yr); year-one equity from $1k of loan paydown is wiped out by about $6k of value loss. Plan a longer hold.
- Bay County population projected at +24% by 2050 — long-run rental-demand tailwind backs the buy-and-hold thesis.
Negotiation context
- It's been on market 49 days — a 3% lower offer ($182k) is reasonable based on typical stale-listing flexibility.
- 2 sale attempts since 4y ago; this cycle's ask has dropped $18k (9%) from the opening price — seller is motivated, your offer sets the floor, not the list.
- Current owner paid $70k; list at $188k implies a 168% gain — meaningful room to come down on a strong offer.
Risks & watch-outs
- Watch-outs: built in 1947 — expect roof / HVAC / electrical / plumbing capex.
- Climate carrying-cost: severe wind risk, 99% chance of damaging wind over 30y; moderate wildfire risk; extreme-heat days projected 7→21/yr by 2055 (HVAC capex compounding) — expect insurance premiums to compound above CPI over the hold.
Questions for the listing agent
- It's been on market 49 days. Have you received any prior offers? Is the seller open to a 22% concession, seller financing, or rate buy-down credit?
- Built in 1947 — when were the roof, HVAC, electrical panel, plumbing, and water heater last replaced?
- Is there a deadline driving the sale (1031 exchange, divorce, estate, relocation)? That informs how much negotiation room exists.
- Schools are F-rated, which usually means shorter tenancies and higher turnover. Who's the typical renter profile here, and what's been the actual vacancy rate?
- The area grade is low — what's the realistic commute time and amenity access for the typical tenant pool here? Any planned neighborhood developments (good or bad) we should know about?
- What's the average days-on-market for RENTAL listings here right now (not sales)? A rising rental-DOM trend means longer vacancies and softer asking-rent achievability than the comps imply.
- What's the recent tenant-quality profile in this submarket — average credit score on applications, eviction rate, late-payment / NSF rate, and stable-employment percentage? A property-management company in the area should have these aggregated.
- How much new for-sale + rental construction is in the pipeline within 1–3 miles? Heavy new supply typically softens prices + rents 12–24 months out; constrained supply supports both.
Investment metrics
- 1% rule
- 0.78% ✗
- Cap rate
- 6.37%
- Cash-on-cash
- 0.28%
- DSCR
- 1.01
- GRM
- 10.6
CMA / ARV
- ARV (median comp)
- $248,161
- List price
- $187,900
- Delta
- -24.28%
- Verdict
- UNDERPRICED
- Comps
- 20 within 1.0 mi
Show comp detail 12 sales within ~0.75 mi
| Address | Dist | Beds/Ba | Sqft | Sold | Price | $/sf | Match |
|---|---|---|---|---|---|---|---|
| 125 N Charlene Dr | 0.07mi | 2/2.0 | 1,053 (-2%) | 8mo | $205,000 | $195 | 81 |
| 165 Hill Dr | 0.32mi | 3/1.0 (+1) | 1,152 (+7%) | 8mo | $85,000 | $74 | 62 |
| 211 S Jan Dr Unit A | 0.33mi | 3/2.0 (+1) | 1,120 (+4%) | 9mo | $215,000 | $192 | 62 |
| 209 S Gay Ave | 0.34mi | 3/1.0 (+1) | 1,184 (+10%) | 8mo | $185,000 | $156 | 56 |
| 202 S Charlene Dr | 0.25mi | 3/1.5 (+1) | 1,215 (+12%) | 6mo | $200,000 | $165 | 55 |
| 523 Highline Dr | 0.72mi | 3/2.0 (+1) | 1,058 (-2%) | 3mo | $160,000 | $151 | 52 |
| 6408 Lenawee St | 0.45mi | 2/2.0 | 1,188 (+10%) | 9mo | $185,000 | $156 | 51 |
| 234 S Mary Ella Ave | 0.72mi | 3/2.0 (+1) | 1,118 (+4%) | 1mo | $224,000 | $200 | 51 |
| 209 S Mary Ella Ave | 0.72mi | 3/2.0 (+1) | 1,092 (+1%) | 8mo | $215,000 | $197 | 49 |
| 7009 Fox Ct | 0.74mi | 3/2.0 (+1) | 1,104 (+2%) | 4mo | $250,000 | $226 | 49 |
| 245 Hannover Cir | 0.55mi | 3/2.0 (+1) | 1,196 (+11%) | 2mo | $249,900 | $209 | 46 |
| 235 S Charlene Dr | 0.48mi | 3/2.0 (+1) | 1,215 (+12%) | 4mo | $250,000 | $206 | 45 |
Match score weights: distance 35% · size 25% · config 20% · recency 20%. Top-matched comps best support the ARV.
Projected returns pro-forma
-3.0% appreciation · 1.12% rent growth · sell at horizon
- IRR
- -17.8%
- Equity multiple
- 0.38×
- Total profit
- $-32,475
- Equity at exit
- $28,017
- IRR
- -13.6%
- Equity multiple
- 0.27×
- Total profit
- $-38,360
- Equity at exit
- $16,246
Cash invested: $52,612 (down + closing). Projections, not guarantees.
Landlord ↔ Tenant lean methodology
- Overall (STATE)
- 87 Strongly Landlord-Friendly
- State Florida
- 87 Strongly Landlord-Friendly · R+3
- County
- — inherits STATE
- City
- — inherits STATE
ZIP-level market 32404
- Home prices YoY
- -16.1%
- Rents YoY
- 1.1%
- Active inventory
- 969
- Price-to-rent
- 10.6×
Monthly cashflow live
- Estimated rent
- $1,472 high interval (Pro) →
- Mortgage (P&I)
- −$985
- Tax from tax record
- −$87 /mo · $1,043/yr
- Insurance
- −$78
- HOA
- −$0
- Vacancy / Maint / Mgmt
- −$309
- Net cashflow
- $12
Break-even live
Sensitivity live
| Price | -10% $119 | -5% $65 | +0% $12 | +5% $-41 | +10% $-94 |
|---|---|---|---|---|---|
| Rent | -10% $-104 | -5% $-46 | +0% $12 | +5% $70 | +10% $128 |
| Rate | -1.0pp $107 | -0.5pp $60 | base $12 | +0.5pp $-37 | +1.0pp $-86 |
UW: 25.0% down · 7.5% · 30yr · 1.5% tax · 5.0% vac · 8.0% maint · 8.0% mgmt
Financing live
Cash to close
- Down payment
- $46,975
- Closing costs
- $5,637
- Reserves months
- —
- Total cash needed
- —
Loan-product check · same deal, 3 products live
Conventional
25% down · 7.5% · 30yr
- Down + closing
- —
- Monthly P&I
- —
- Monthly cashflow
- —
- DSCR
- —
- Eligible?
- —
Personal DTI + credit; lowest rate.
DSCR
20% down · 8.5% · 30yr
- Down + closing
- —
- Monthly P&I
- —
- Monthly cashflow
- —
- DSCR
- —
- Eligible?
- —
No personal income docs; deal must DSCR.
Hard money
10% down · 12.0% · 12mo
- Down + closing
- —
- Monthly P&I
- —
- Monthly cashflow
- —
- DSCR
- —
- Eligible?
- —
Short-term bridge; refi at stabilization.
Rent comps 31 comps
| Address | Beds | Baths | Sqft | Rent | $/sqft | DOM | Units | Dist |
|---|---|---|---|---|---|---|---|---|
| 114 S Kimbrel Ave Panama City, FL | 3.0 | 2.0 | 1400 | $1,850 | $1.32 | 21d | 1 | 0.22mi |
| 6101 Harvey St #3 Panama City, FL | 2.0 | 1.5 | 1108 | $1,050 | $0.95 | 21d | 1 | 0.29mi |
| 168 N Comet Ave Panama City, FL | 2.0 | 2.0 | 950 | $1,100 | $1.16 | 21d | 1 | 0.30mi |
| 6121 Harvey St Unit 8 Panama City, FL | 2.0 | 1.5 | 1200 | $1,050 | $0.88 | 21d | 1 | 0.31mi |
| 6121 Harvey St Apt 16 Panama City, FL | 2.0 | 1.5 | 1000 | $1,090 | $1.09 | 21d | 1 | 0.31mi |
| 5805 Cherry St Panama City, FL | 2.0 | 1.0 | 1025 | $1,200 | $1.17 | 14d | 1 | 0.32mi |
| 108 N Anita Dr Callaway, FL | 1.0 | 1.0 | 700 | $1,200 | $1.71 | 21d | 1 | 0.33mi |
| 6328 Olokee St Panama City, FL | 3.0 | 2.0 | 1131 | $1,850 | $1.64 | 14d | 1 | 0.37mi |
| 229 Callaway Chase Ln Panama City, FL | 3.0 | 2.5 | 1200 | $1,650 | $1.38 | 14d | 1 | 0.42mi |
| 6724 Chipewa St Unit 6724 Panama City, FL | 2.0 | 1.0 | 1000 | $1,125 | $1.12 | 14d | 1 | 0.54mi |
| 322 S Burkett Dr Panama City, FL | 1.0–2.0 | 1.0–2.0 | 600 | $1,519 | $2.53 | 14d | 13 | 0.59mi |
| 116 Christie Ln Panama City, FL | 3.0 | 2.0 | 1092 | $1,550 | $1.42 | 21d | 1 | 0.60mi |
| 5813 Hickory St Panama City, FL | 3.0 | 2.0 | 1200 | $1,950 | $1.62 | 21d | 1 | 0.65mi |
| 420 Raven Ln Panama City, FL | 3.0 | 2.0 | 1251 | $1,750 | $1.40 | 21d | 1 | 0.71mi |
| 7006 Lois St Unit B Panama City, FL | 2.0 | 1.0 | 1000 | $1,000 | $1.00 | 21d | 1 | 0.72mi |
| 129 Seneca Ave Panama City, FL | 3.0 | 2.0 | 1449 | $1,495 | $1.03 | 14d | 1 | 0.75mi |
| 509 Phillips Ct Panama City, FL | 3.0 | 2.0 | 1411 | $1,700 | $1.20 | 14d | 1 | 0.90mi |
| 208 North Highway 22 A Unit 33 Panama City, FL | 3.0 | 2.0 | 1080 | $1,350 | $1.25 | 21d | 1 | 0.94mi |
| 526 Camellia Ave Panama City, FL | 3.0 | 2.0 | 1375 | $1,950 | $1.42 | 21d | 1 | 0.94mi |
| 5101 Willow St Panama City, FL | 3.0 | 2.0 | 1099 | $1,500 | $1.36 | 14d | 1 | 0.95mi |
| 149 North Highway 22 A Unit 5 Panama City, FL | 2.0 | 1.0 | 900 | $1,140 | $1.27 | 14d | 1 | 1.03mi |
| 719 S Berthe Ave Unit 8 Panama City, FL | 2.0 | 1.0 | 910 | $1,000 | $1.10 | 21d | 1 | 1.04mi |
| 4905 Alameda St Unit 1 Panama City, FL | 3.0 | 2.0 | 942 | $1,295 | $1.37 | 21d | 1 | 1.10mi |
| 263 Nelle Ave Panama City, FL | 3.0 | 2.0 | 1294 | $1,690 | $1.31 | 21d | 1 | 1.22mi |
| 4837 S Lakewood Dr Panama City, FL | 2.0 | 1.5 | 1116 | $1,500 | $1.34 | 21d | 1 | 1.25mi |
| 7727 Betty Louise Dr Panama City, FL | 3.0 | 2.0 | 1430 | $1,950 | $1.36 | 21d | 1 | 1.32mi |
| 543 N 9th St Unit 543 Panama City, FL | 2.0 | 1.0 | 850 | $1,195 | $1.41 | 14d | 1 | 1.34mi |
| 4828 Grimes St #3 Panama City, FL | 2.0 | 1.0 | 850 | $1,150 | $1.35 | 21d | 1 | 1.37mi |
| 7709 Betty Louise Dr Panama City, FL | 3.0 | 2.0 | 1310 | $1,800 | $1.37 | 21d | 1 | 1.37mi |
| 285 Sukoshi Dr Unit C Panama City, FL | 2.0 | 1.5 | 916 | $1,250 | $1.36 | 14d | 1 | 1.45mi |
| 291 Sukoshi Dr Unit A Panama City, FL | 2.0 | 1.5 | 918 | $1,495 | $1.63 | 21d | 1 | 1.45mi |
Listing history 23 events
-
2026-06-19days on market $187,900 Active 49 DOM
-
2026-06-18days on market $187,900 Active 48 DOM
-
2026-06-17days on market $187,900 Active 47 DOM
-
2026-06-16days on market $187,900 Active 46 DOM
-
2026-06-15days on market $187,900 Active 45 DOM
-
2026-06-14days on market $187,900 Active 43 DOM
-
2026-06-13days on market $187,900 Active 42 DOM
-
2026-06-10days on market $187,900 Active 40 DOM
-
2026-06-09days on market $187,900 Active 39 DOM
-
2026-06-08days on market $187,900 Active 38 DOM
-
2026-06-07days on market $187,900 Active 37 DOM
-
2026-06-05days on market $187,900 Active 34 DOM
-
2026-06-03days on market $187,900 Active 33 DOM
-
2026-06-02days on market $187,900 Active 32 DOM
-
2026-06-01days on market $187,900 Active 31 DOM
-
2026-05-31days on market $187,900 Active 30 DOM
-
2026-05-30days on market $187,900 Active 29 DOM
-
2026-05-07price $197,750 351-char remark
-
2026-05-01$205,900 Active 351-char remark
-
2022-10-10soldstatus $70,000
-
2022-10-07soldstatus $70,000 Closed 324-char remark
Show marketing remark (324 chars)
* * PERFECT INVESTOR PROPERTY * * 2 bedroom 1 bath home is ready for an investor to come and finish house. Sellers have had a new roof, HVAC roughed in, several new windows, oak hardwood flooring over diagonal 1x6 subfloor. Show to invertors today! All ages, sizes including sq. ft. are approximate measure in important.
-
2022-09-28historical Active Under Contract 324-char remark
Show marketing remark (324 chars)
* * PERFECT INVESTOR PROPERTY * * 2 bedroom 1 bath home is ready for an investor to come and finish house. Sellers have had a new roof, HVAC roughed in, several new windows, oak hardwood flooring over diagonal 1x6 subfloor. Show to invertors today! All ages, sizes including sq. ft. are approximate measure in important.
-
2022-09-23$70,000 Active 324-char remark
Show marketing remark (324 chars)
* * PERFECT INVESTOR PROPERTY * * 2 bedroom 1 bath home is ready for an investor to come and finish house. Sellers have had a new roof, HVAC roughed in, several new windows, oak hardwood flooring over diagonal 1x6 subfloor. Show to invertors today! All ages, sizes including sq. ft. are approximate measure in important.
ⓘ Source: listings_history table (triggers on properties + properties_extension) + one-shot
backfill from property_details.listing_events for pre-trigger history.
Tax reassessment forecast FL · Resets to sale price
- Current annual tax
- $1,043 · $87/mo
- Projected year-2 tax
- $1,560 · $130/mo
- Expected delta
- +$517/yr (+$43/mo · 49.6%)
ⓘ Screening estimate from a state-policy table — verify with the county assessor before closing.
Climate risk First Street
- Flood 1/10 Low FEMA zone X (unshaded) · 0% chance over 30 yrs
- Wildfire 5/10 Major
- Heat 10/10 Extreme 7 d/yr ≥104°F today · 21 d/yr by 30 yrs out
- Wind 9/10 Extreme 99% chance of damaging wind over 30 yrs
- Air quality 1/10 Low 0 unhealthy d/yr today · 0 by 30 yrs out
Nearby sold comps map
Loading sold comps map…
Walkable amenities ~0.75 mi
Loading nearby amenities…
Taxation est. · year 1
- Rental income
- $17,662
- − Mortgage interest
- −$10,525
- − Property taxes
- −$1,043
- − Insurance
- −$940
- − Repairs & maintenance
- −$1,413
- − Management
- −$1,413
- − Depreciation
- −$5,466
- Taxable loss
- −$3,138
- Est. tax savings @ 24.0%
- +$753
- After-tax cash flow
- $899/yr
For passive investors: Depreciation is non-cash, so a rental often shows a tax loss while cash-flowing — sheltering income. Rental losses are passive: they offset passive income freely, and up to $25,000/yr can offset ordinary (W-2) income if you actively participate and your MAGI is under $100k (phasing out to $0 by $150k); unused losses carry forward. On sale, claimed depreciation is recaptured at up to 25%, and gains may owe capital-gains tax (a 1031 exchange can defer both). Figures are a year-1 estimate at your 24.0% rate — not tax advice; consult a CPA.
Schools (NCES district)
- District
- Bay
- NCES district ID
- 1200090
- Math proficiency
- 51% ▼ -8.00%
- Reading proficiency
- 51% ▼ -7.00%
- Median HH income
- $47,740
- Composite
- 43.41/100
- National rank
- #3014
- State rank
- #29 of 73 in FL
Livability — Callaway
- Score
- 64/100
- State rank
- #690
- US rank
- #14384
Category grades
Schools grade is shown separately in the Schools card above.
Census & demographics
- Census place
- Callaway, FL
- County
- Bay County · 163,593 people
- Metro
- Panama City, FL
- Population (ZIP)
- 42,514
- Household income
- $74,708
- Rent vs Own
- Severe rent burden
- 1218.0
Population outlook (Bay County) Hauer SSP2
- Today (2025)
- 206,264 people
- By 2030
- 217,740 · +5.6%
- By 2040
- 238,738 · +15.7%
- By 2050
- 255,545 · +23.9%
- By 2075
- 288,295 · +39.8%
- By 2100
- 288,638 · +39.9%
Race, ethnicity, and origin ACS 2023
- Neighborhood character
- Predominantly White (69%)
- Race & ethnicity
- White 69% Black 12% Two or more races 10% Hispanic / Latino 9% Asian 3%
- Hispanic origin (detail)
- Mexican 2% Puerto Rican 3%
- Common ancestry
- Lithuanian 3% Slovak 2% Italian 2%
- Foreign-born
- 7% · Canada, Vietnam, Mexico
- Languages at home
- 90% English-only · Spanish 6% Vietnamese 1% Other Asian/Pacific 1%
Political lean MEDSL · Bay
- 2024 margin
- Solid R (+47.4) · D 25.8% · R 73.1% · Other 1.1%
- 2008→2024 swing
- -6.6pp toward R · 2008: -40.7pp · 2024: -47.4pp
- All cycles
- 2024: R+47.4 2020: R+43.5 2016: R+46.3 2012: R+43.6 2008: R+40.7
Not yet ingested
- Civics
- —
Market trends
- HPI YoY
- ▼ -50.59%
- Current HPI
- 263.7178
- Rent YoY
- ▲ 1.12%
- Metro
- Panama City, FL
- State GDP YoY
- ▲ 3.28%
- F500 in state
- 36
Industry mix (Fortune 500 HQ in FL)
| Industry | F500 HQs | Revenue |
|---|---|---|
| Industrial Technology | 2 | $29B |
|
||
| Insurance | 2 | $17B |
|
||
| Retail | 1 | $60B |
|
||
| Technology Distribution | 1 | $58B |
|
||
| Homebuilding | 1 | $35B |
|
||
| Technology Manufacturing | 1 | $35B |
|
||
Price history
+168.4% since first listed7 events — show timeline
- 2026-05-20 Price Changed $187,900 CPARMLS
- 2026-05-07 Price Changed $197,750 CPARMLS
- 2026-05-01 Listed $205,900 CPARMLS
- 2022-10-10 Sold (Public Records) $70,000 Public Records
- 2022-10-07 Sold (MLS) $70,000 CPARMLS
- 2022-09-28 Contingent — CPARMLS
- 2022-09-23 Listed $70,000 CPARMLS
Property tax history
+17.7%/yrLatest (2025): $1,043 · +13.8% YoY. Source: county tax records.
Cash-flow waterfall
monthlySold comps — $/sqft
last 12 mo · ≤1 miLoading sold comps…