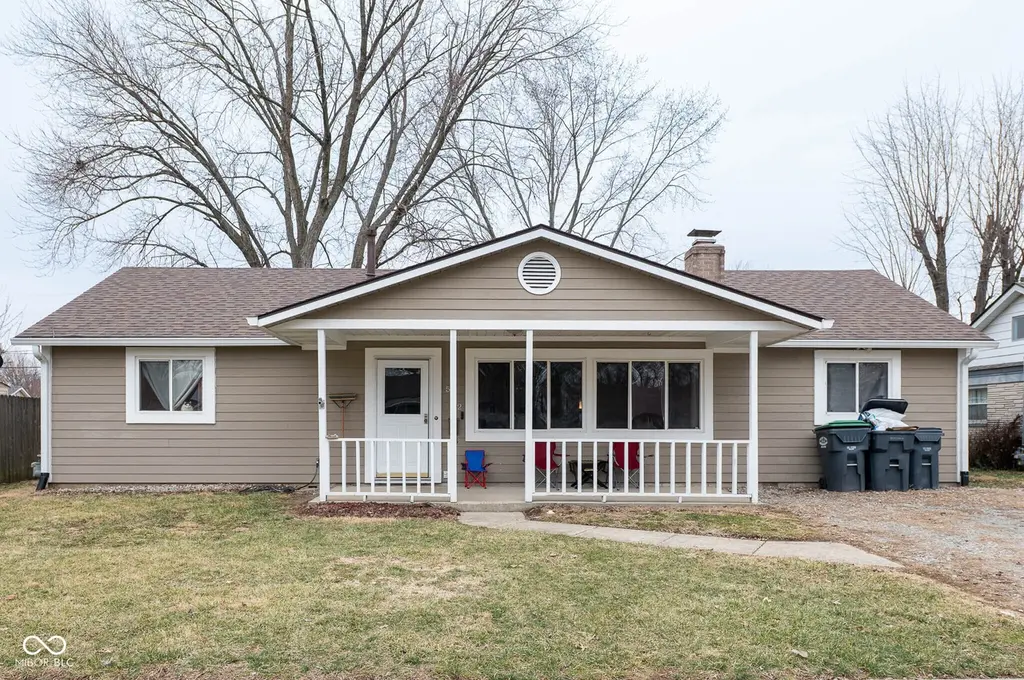
532 Northgate Dr · Greenwood, IN
Flood risk 1/10 · Minimal
- FEMA flood zone
- X (unshaded)
- Chance of flooding over 30 yrs
- 0.0%
- Est. flood insurance / yr
- $507 – $1,088
Fire risk 1/10 · Minimal
- Est. fire insurance / yr
- $717 – $1,331
Heat risk 4/10 · Minor
- Hot days now (above 101°F)
- 7 days/yr
- Hot days in 30 yrs
- 19 days/yr
Wind risk 2/10 · Minimal
- Chance of severe wind over 30 yrs
- 1.0%
Air-quality risk 2/10 · Minimal
- Unhealthy air days now
- 2 days/yr
- Unhealthy air days in 30 yrs
- 2 days/yr
Risk factors via First Street. Map © Google.
Why this score? — see what drove the D+ grade
The composite is a weighted blend of 9 inputs, each scored 0–100. Each bar is that input's sub-score; the figure is the points it added to the 100-point composite (weight × sub-score).
- Cash flow +18.3/30.0
- ARV discount +7.8/15.0
- DSCR +5.8/10.0
- 1% rule +4.6/10.0
- Schools +4.0/10.0
- Livability +3.7/5.0
- Rent growth +3.0/5.0
- Condition / age +2.5/5.0
- Appreciation +0.0/10.0
$229,000
🖨 Deal sheet (PDF) 📄 Offer letter ✓ Due diligence
Listing remarks MLS
Excellent investment opportunity with tenant already in place - lease active and tenant rights apply, providing immediate rental income. This 5-bedroom ranch home offers a desirable single-level layout with hardwood flooring, large windows, and a well-lit interior with ample natural sunlight throughout. The functional floor plan is attractive to long-term tenants. Conveniently located near grocery stores, shopping centers, and the mall, offering easy access to everyday amenities. The strong location, bright living spaces, and spacious layout make this property appealing for stable tenancy and consistent rental demand. Turn-key rental property ideal for investors seeking steady cash flow and a great addition to any rental portfolio.
Key facts
- Hardwood flooring
- Large windows
- Active lease
Tags
Neighborhood map
What this means for you Summary
Snapshot
- This is a 5-bed/1.0-bath single-family listed at $229k.
Deal economics
- At list price, monthly cash flow is $212 ($3k/yr) — positive.
- The deal already cash-flows at list — no discount required.
- To meet the 1% rule (rent ≥ 1% of price), the offer needs to be $221k (3.7% below list).
- Recommended offer: $208k (9.0% below list) — sets the bar for market timing.
- Cap rate 7.4% vs local median 4.5% in Greenwood — top-decile yield for the area; either an underpriced asset or a hidden risk that comps aren't pricing in. Stress-test before assuming the spread holds.
Location & tenants
- Location reads 73/100 on livability (#91 in IN) — a middle-class / working-renter tenant base. Strengths: cost of living A+, housing A+, crime A; Watch: amenities F, commute F, health & safety F.
- Greenwood Community School Corporation (suburban): math 41% / reading 52% proficiency, ranked #88 of 301 in IN (top 29%) — families likely to look elsewhere, expect single-tenant / working-renter base with shorter leases.
- Market conditions: Rents rising (+1.9%/yr); 80 active listings in the ZIP; solid renter incomes; 1,133 units permitted in Johnson County in 2024 (0 in 5+ unit buildings).
Forward outlook
- Local home prices are declining (-3.0%/yr); year-one equity from $2k of loan paydown is wiped out by about $7k of value loss. Plan a longer hold.
- Johnson County population projected at +26% by 2050 — long-run rental-demand tailwind backs the buy-and-hold thesis.
Negotiation context
- It's been on market 95 days — a 9% lower offer ($208k) is reasonable based on typical stale-listing flexibility.
- 3 sale attempts since 8y ago with the ask held roughly flat each time — persistent listings suggest the price (not the market) is what's stuck; bring a comps-based counter.
- Current owner paid $105k; list at $229k implies a 118% gain — meaningful room to come down on a strong offer.
Risks & watch-outs
- Watch-outs: built in 1957 — expect roof / HVAC / electrical / plumbing capex.
Questions for the listing agent
- It's been on market 95 days. Have you received any prior offers? Is the seller open to a 9% concession, seller financing, or rate buy-down credit?
- Built in 1957 — when were the roof, HVAC, electrical panel, plumbing, and water heater last replaced?
- Why hasn't it sold? Are there any deal-killer items the seller is aware of (foundation, flood, title, zoning, code violations)?
- Is there a deadline driving the sale (1031 exchange, divorce, estate, relocation)? That informs how much negotiation room exists.
- Schools are B-rated — typically a magnet for longer-tenancy family renters. What's the average tenant stay here, and is there a school-zone premium baked into asking?
- The area grade is low — what's the realistic commute time and amenity access for the typical tenant pool here? Any planned neighborhood developments (good or bad) we should know about?
- What's the average days-on-market for RENTAL listings here right now (not sales)? A rising rental-DOM trend means longer vacancies and softer asking-rent achievability than the comps imply.
- What's the recent tenant-quality profile in this submarket — average credit score on applications, eviction rate, late-payment / NSF rate, and stable-employment percentage? A property-management company in the area should have these aggregated.
- How much new for-sale + rental construction is in the pipeline within 1–3 miles? Heavy new supply typically softens prices + rents 12–24 months out; constrained supply supports both.
Investment metrics
- 1% rule
- 0.96% ✗
- Cap rate
- 7.40%
- Cash-on-cash
- 3.96%
- DSCR
- 1.18
- GRM
- 8.7
CMA / ARV
- ARV (median comp)
- $230,778
- List price
- $229,000
- Delta
- -0.77%
- Verdict
- FAIR
- Comps
- 20 within 1.0 mi
Show comp detail 9 sales within ~0.75 mi
| Address | Dist | Beds/Ba | Sqft | Sold | Price | $/sf | Match |
|---|---|---|---|---|---|---|---|
| 629 Gooseberry Ln | 0.12mi | 5/1.5 | 1,248 (0%) | 0mo | $199,900 | $160 | 92 |
| 123 Totten Dr | 0.36mi | 4/1.0 (-1) | 1,252 (+0%) | 0mo | $247,500 | $198 | 77 |
| 103 Bentwood Dr | 0.13mi | 4/1.5 (-1) | 1,254 (+0%) | 11mo | $209,000 | $167 | 77 |
| 654 Park Dr | 0.17mi | 4/1.0 (-1) | 1,300 (+4%) | 14mo | $216,000 | $166 | 69 |
| 624 Park Dr | 0.17mi | 4/1.5 (-1) | 1,300 (+4%) | 15mo | $220,000 | $169 | 66 |
| 46 Crestview Dr | 0.46mi | 4/2.0 (-1) | 1,248 (0%) | 15mo | $275,000 | $220 | 57 |
| 476 Southgate Dr | 0.32mi | 4/1.0 (-1) | 1,149 (-8%) | 13mo | $150,000 | $131 | 56 |
| 52 Crestview Dr | 0.49mi | 4/2.0 (-1) | 1,152 (-8%) | 3mo | $230,000 | $200 | 53 |
| 50 Crestview Dr | 0.48mi | 4/1.5 (-1) | 1,408 (+13%) | 11mo | $211,000 | $150 | 40 |
Match score weights: distance 35% · size 25% · config 20% · recency 20%. Top-matched comps best support the ARV.
Projected returns pro-forma
-3.0% appreciation · 1.95% rent growth · sell at horizon
- IRR
- -11.3%
- Equity multiple
- 0.60×
- Total profit
- $-25,935
- Equity at exit
- $34,145
- IRR
- -3.6%
- Equity multiple
- 0.77×
- Total profit
- $-14,489
- Equity at exit
- $19,800
Cash invested: $64,120 (down + closing). Projections, not guarantees.
Landlord ↔ Tenant lean methodology
- Overall (STATE)
- 90 Strongly Landlord-Friendly
- State Indiana
- 90 Strongly Landlord-Friendly · R+11
- County
- — inherits STATE
- City
- — inherits STATE
ZIP-level market 46143
- Rents YoY
- 1.9%
- Active inventory
- 80
- Price-to-rent
- 8.7×
Monthly cashflow live
- Estimated rent
- $2,206 medium interval (Pro) →
- Mortgage (P&I)
- −$1,201
- Tax from tax record
- −$235 /mo · $2,815/yr
- Insurance
- −$95
- HOA
- −$0
- Vacancy / Maint / Mgmt
- −$463
- Net cashflow
- $212
Break-even live
Sensitivity live
| Price | -10% $341 | -5% $276 | +0% $212 | +5% $147 | +10% $82 |
|---|---|---|---|---|---|
| Rent | -10% $37 | -5% $124 | +0% $212 | +5% $299 | +10% $386 |
| Rate | -1.0pp $327 | -0.5pp $270 | base $212 | +0.5pp $152 | +1.0pp $92 |
UW: 25.0% down · 7.5% · 30yr · 1.5% tax · 5.0% vac · 8.0% maint · 8.0% mgmt
Financing live
Cash to close
- Down payment
- $57,250
- Closing costs
- $6,870
- Reserves months
- —
- Total cash needed
- —
Loan-product check · same deal, 3 products live
Conventional
25% down · 7.5% · 30yr
- Down + closing
- —
- Monthly P&I
- —
- Monthly cashflow
- —
- DSCR
- —
- Eligible?
- —
Personal DTI + credit; lowest rate.
DSCR
20% down · 8.5% · 30yr
- Down + closing
- —
- Monthly P&I
- —
- Monthly cashflow
- —
- DSCR
- —
- Eligible?
- —
No personal income docs; deal must DSCR.
Hard money
10% down · 12.0% · 12mo
- Down + closing
- —
- Monthly P&I
- —
- Monthly cashflow
- —
- DSCR
- —
- Eligible?
- —
Short-term bridge; refi at stabilization.
Listing history 19 events
-
2026-06-21days on market $229,000 Active 95 DOM
-
2026-06-18days on market $229,000 Active 92 DOM
-
2026-06-17days on market $229,000 Active 91 DOM
-
2026-06-16days on market $229,000 Active 90 DOM
-
2026-06-15days on market $229,000 Active 89 DOM
-
2026-06-13days on market $229,000 Active 87 DOM
-
2026-06-13days on market $229,000 Active 86 DOM
-
2026-06-09days on market $229,000 Active 83 DOM
-
2026-06-08days on market $229,000 Active 82 DOM
-
2026-06-07days on market $229,000 Active 81 DOM
-
2026-06-03days on market $229,000 Active 77 DOM
-
2026-06-02days on market $229,000 Active 76 DOM
-
2026-06-01days on market $229,000 Active 75 DOM
-
2026-05-31days on market $229,000 Active 74 DOM
-
2026-05-04status Active 741-char remark
Show marketing remark (741 chars)
Excellent investment opportunity with tenant already in place - lease active and tenant rights apply, providing immediate rental income. This 5-bedroom ranch home offers a desirable single-level layout with hardwood flooring, large windows, and a well-lit interior with ample natural sunlight throughout. The functional floor plan is attractive to long-term tenants. Conveniently located near grocery stores, shopping centers, and the mall, offering easy access to everyday amenities. The strong location, bright living spaces, and spacious layout make this property appealing for stable tenancy and consistent rental demand. Turn-key rental property ideal for investors seeking steady cash flow and a great addition to any rental portfolio.
-
2026-04-21status Pending 741-char remark
Show marketing remark (741 chars)
Excellent investment opportunity with tenant already in place - lease active and tenant rights apply, providing immediate rental income. This 5-bedroom ranch home offers a desirable single-level layout with hardwood flooring, large windows, and a well-lit interior with ample natural sunlight throughout. The functional floor plan is attractive to long-term tenants. Conveniently located near grocery stores, shopping centers, and the mall, offering easy access to everyday amenities. The strong location, bright living spaces, and spacious layout make this property appealing for stable tenancy and consistent rental demand. Turn-key rental property ideal for investors seeking steady cash flow and a great addition to any rental portfolio.
-
2026-03-05$229,000 Active 741-char remark
Show marketing remark (741 chars)
Excellent investment opportunity with tenant already in place - lease active and tenant rights apply, providing immediate rental income. This 5-bedroom ranch home offers a desirable single-level layout with hardwood flooring, large windows, and a well-lit interior with ample natural sunlight throughout. The functional floor plan is attractive to long-term tenants. Conveniently located near grocery stores, shopping centers, and the mall, offering easy access to everyday amenities. The strong location, bright living spaces, and spacious layout make this property appealing for stable tenancy and consistent rental demand. Turn-key rental property ideal for investors seeking steady cash flow and a great addition to any rental portfolio.
-
2018-06-17soldstatus $105,000 13-char remark
Show marketing remark (13 chars)
List to sell.
-
2018-06-17$105,000 13-char remark
Show marketing remark (13 chars)
List to sell.
ⓘ Source: listings_history table (triggers on properties + properties_extension) + one-shot
backfill from property_details.listing_events for pre-trigger history.
Tax reassessment forecast IN · Partial reset (capped growth)
- Current annual tax
- $2,815 · $235/mo
- Projected year-2 tax
- $2,815 · $235/mo
- Expected delta
- $0/yr ($0/mo · 0.0%)
ⓘ Screening estimate from a state-policy table — verify with the county assessor before closing.
Climate risk First Street
- Flood 1/10 Low FEMA zone X (unshaded) · 0% chance over 30 yrs
- Wildfire 1/10 Low
- Heat 4/10 Moderate 7 d/yr ≥101°F today · 19 d/yr by 30 yrs out
- Wind 2/10 Low 100% chance of damaging wind over 30 yrs
- Air quality 2/10 Low 2 unhealthy d/yr today · 2 by 30 yrs out
Nearby sold comps map
Loading sold comps map…
Walkable amenities ~0.75 mi
Loading nearby amenities…
Taxation est. · year 1
- Rental income
- $26,468
- − Mortgage interest
- −$12,828
- − Property taxes
- −$2,815
- − Insurance
- −$1,145
- − Repairs & maintenance
- −$2,117
- − Management
- −$2,117
- − Depreciation
- −$6,662
- Taxable loss
- −$1,216
- Est. tax savings @ 24.0%
- +$292
- After-tax cash flow
- $2,831/yr
For passive investors: Depreciation is non-cash, so a rental often shows a tax loss while cash-flowing — sheltering income. Rental losses are passive: they offset passive income freely, and up to $25,000/yr can offset ordinary (W-2) income if you actively participate and your MAGI is under $100k (phasing out to $0 by $150k); unused losses carry forward. On sale, claimed depreciation is recaptured at up to 25%, and gains may owe capital-gains tax (a 1031 exchange can defer both). Figures are a year-1 estimate at your 24.0% rate — not tax advice; consult a CPA.
Schools (NCES district)
- District
- Greenwood Community School Corporation
- NCES district ID
- 1804110
- Math proficiency
- 41% ▼ -12.00%
- Reading proficiency
- 52% ▼ -7.00%
- Median HH income
- $48,589
- Composite
- 39.71/100
- National rank
- #3902
- State rank
- #88 of 301 in IN
Livability — Greenwood
- Score
- 73/100
- State rank
- #91
- US rank
- #5255
Category grades
Schools grade is shown separately in the Schools card above.
Census & demographics
- Census place
- Greenwood, IN
- County
- Johnson County · 154,261 people
- City population
- 96,151
- Metro
- Indianapolis-Carmel-Anderson, IN
- Population (ZIP)
- 61,803
- Household income
- $91,496
- Rent vs Own
- Severe rent burden
- 1513.0
Population outlook (Johnson County) Hauer SSP2
- Today (2025)
- 170,080 people
- By 2030
- 179,983 · +5.8%
- By 2040
- 198,580 · +16.8%
- By 2050
- 214,661 · +26.2%
- By 2075
- 247,990 · +45.8%
- By 2100
- 257,821 · +51.6%
Race, ethnicity, and origin ACS 2023
- Neighborhood character
- Predominantly White (79%)
- Race & ethnicity
- White 79% Asian 8% Black 5% Two or more races 5% Hispanic / Latino 5%
- Common ancestry
- Slovak 3% Romanian 2% Lithuanian 1%
- Foreign-born
- 8% · Canada, Jamaica
- Languages at home
- 88% English-only · Other Indo-European 6% Spanish 3% Other Asian/Pacific 1%
Political lean MEDSL · Johnson
- 2024 margin
- Solid R (+34.3) · D 32.0% · R 66.3% · Other 1.7%
- 2008→2024 swing
- -8.9pp toward R · 2008: -25.5pp · 2024: -34.3pp
- All cycles
- 2024: R+34.3 2020: R+34.1 2016: R+42.5 2012: R+38.5 2008: R+25.5
Not yet ingested
- Civics
- —
Market trends
- HPI YoY
- ▼ -206.72%
- Current HPI
- 204.3161
- Rent YoY
- ▲ 1.95%
- Metro
- Indianapolis-Carmel-Anderson, IN
- State GDP YoY
- ▲ 2.90%
- F500 in state
- 18
Industry mix (Fortune 500 HQ in IN)
| Industry | F500 HQs | Revenue |
|---|---|---|
| Industrial Machinery | 2 | $37B |
|
||
| Healthcare | 1 | $177B |
|
||
| Pharmaceuticals | 1 | $45B |
|
||
| Metals / Steel | 1 | $18B |
|
||
| Agriculture | 1 | $17B |
|
||
| Packaging | 1 | $12B |
|
||
Price history
+118.1% since first listed5 events — show timeline
- 2026-05-04 Relisted — MIBOR as Distributed by MLS Grid
- 2026-04-21 Pending — MIBOR as Distributed by MLS Grid
- 2026-03-05 Listed $229,000 MIBOR as Distributed by MLS Grid
- 2018-06-17 Listed $105,000 MIBOR as Distributed by MLS Grid
- 2018-06-17 Sold (MLS) $105,000 MIBOR as Distributed by MLS Grid
Property tax history
+22.6%/yrLatest (2024): $2,815 · +10.1% YoY. Source: county tax records.
Cash-flow waterfall
monthlySold comps — $/sqft
last 12 mo · ≤1 miLoading sold comps…