3340 Del Sol Blvd #218 · San Diego, CA
Flood risk 1/10 · Minimal
- FEMA flood zone
- X (unshaded)
- Chance of flooding over 30 yrs
- 0.0%
- Est. flood insurance / yr
- $507 – $1,088
Fire risk 2/10 · Minimal
- Est. fire insurance / yr
- $659 – $1,223
Heat risk 4/10 · Minor
- Hot days now (above 86°F)
- 5 days/yr
- Hot days in 30 yrs
- 14 days/yr
Wind risk 1/10 · Minimal
- Chance of severe wind over 30 yrs
- —
Air-quality risk 1/10 · Minimal
- Unhealthy air days now
- 0 days/yr
- Unhealthy air days in 30 yrs
- 0 days/yr
Risk factors via First Street. Map © Google.
Why this score? — see what drove the B+ grade
The composite is a weighted blend of 9 inputs, each scored 0–100. Each bar is that input's sub-score; the figure is the points it added to the 100-point composite (weight × sub-score).
- Cash flow +30.0/30.0
- ARV discount +15.0/15.0
- 1% rule +10.0/10.0
- DSCR +10.0/10.0
- Schools +3.9/10.0
- Livability +3.8/5.0
- Condition / age +2.5/5.0
- Rent growth +2.4/5.0
- Appreciation +0.0/10.0
$135,900
🖨 Deal sheet 📄 Offer letter ✓ Due diligence
Listing remarks
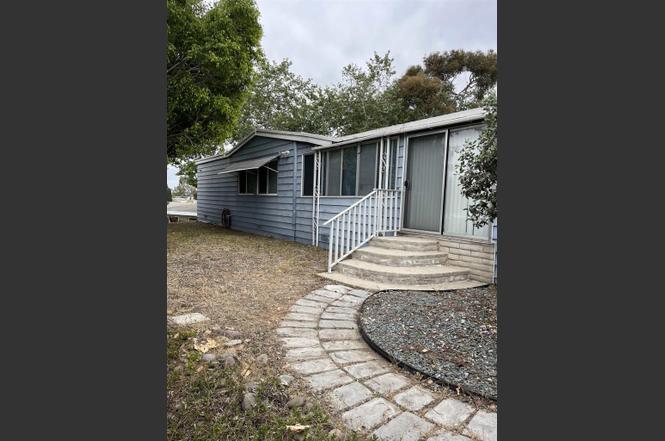
Priced to sell, huge price reduction! Ocean View Beauty! This charming triple-wide home offers breathtaking ocean views and is nestled in a peaceful cul-de-sac, providing the perfect blend of serenity and convenience. With two spacious bedrooms and two well-appointed bathrooms, this home is designed for comfort and relaxation. The large kitchen is ideal for culinary enthusiasts, while the expansive shed offers ample storage space. Located in a gated community, residents can enjoy exclusive access to amenities such as a community meeting room, a sparkling pool, and picturesque paths. The property is also conveniently situated near shopping centers, public transportation, and freeways, ensuri
Key facts
- Gated community
- Picturesque paths
- Large kitchen
Tags
Property features AI
Finance
- Other: Manager approval required for occupancy; Pets allowed (contact for details)
- Financial info: Land lease: $1,890 (land lease applies)
- HOA & community: Senior community; Suburban neighborhood; Park name: Ocean Bluffs Mobile Park
Exterior
- Parking: 2 total parking spaces; 2 carport spaces; Located in Ocean Bluffs Mobile Park
- Utilities: Public sewer
- Home design: Mobile home (remains on site); Single-story; Entry level: 1
- Construction: Mobile dimensions approximately 29 ft by 60 ft; Year built per assessor
- Exterior features: Patio; Community pool; Has view; 1 shed
Interior
- Kitchen: Kitchen
- Bedrooms: Primary bedroom
- Bathrooms: 2 full bathrooms
- Heating & cooling: Central furnace heating
- Interior features: One-level home; Entry accessed via steps to stairs; Great room; Family room; Jack & Jill layout; See remarks (additional room info)
- Laundry & utility: Laundry in an individual room
Neighborhood map
What this means for you Summary
Snapshot
- This is a 2-bed/2.0-bath manufactured listed at $136k.
Deal economics
- At list price, monthly cash flow is $2k ($23k/yr) — positive.
- The deal already cash-flows at list — no discount required.
- Meets the 1% rule at list price ($3k rent vs $136k).
- Recommended offer: $124k (9.0% below list) — sets the bar for market timing.
- Cap rate 22.9% vs local median 2.0% in San Diego — top-decile yield for the area; either an underpriced asset or a hidden risk that comps aren't pricing in. Stress-test before assuming the spread holds.
Location & tenants
- Location reads 75/100 on livability (#123 in CA, #4,206 nationally) — a middle-class / working-renter tenant base. Strengths: amenities A+, commute A+, employment A+; Watch: health & safety C-, crime D+, cost of living F.
- Sweetwater Union High (suburban): math 36% / reading 52% proficiency, ranked #187 of 517 in CA (top 36%) — families likely to look elsewhere, expect single-tenant / working-renter base with shorter leases.
- Market conditions: Rents soft (-0.5%/yr); 210 active listings in the ZIP; 12 comparable units currently listed for rent nearby; rentals leasing fast (median 3d on market — plan ~1-2 weeks tenant-placement turnaround); solid renter incomes; 11,759 units permitted in San Diego County in 2024 (7,244 in 5+ unit buildings).
- This rent runs 43% of the median local income ($95k/yr) — at the standard rent-burdened threshold; future hikes will face affordability resistance.
Forward outlook
- Local home prices are declining (-3.0%/yr); year-one equity from $940 of loan paydown is wiped out by about $4k of value loss. Plan a longer hold.
- San Diego County population projected at +20% by 2050 — long-run rental-demand tailwind backs the buy-and-hold thesis.
- At projected returns (-3.0% appreciation + 0.0% rent growth), your $38k cash investment doubles in ~2 years — after that, you're playing with house money.
Negotiation context
- It's been on market 97 days — a 9% lower offer ($124k) is reasonable based on typical stale-listing flexibility.
- 2 sale attempts; this cycle's ask has dropped $54k (28%) from the opening price — seller is motivated, your offer sets the floor, not the list.
Questions for the listing agent
- It's been on market 97 days. Have you received any prior offers? Is the seller open to a 9% concession, seller financing, or rate buy-down credit?
- Built in 1979 — when were the roof, HVAC, electrical panel, plumbing, and water heater last replaced?
- Why hasn't it sold? Are there any deal-killer items the seller is aware of (foundation, flood, title, zoning, code violations)?
- Is there a deadline driving the sale (1031 exchange, divorce, estate, relocation)? That informs how much negotiation room exists.
- Schools are B-rated — typically a magnet for longer-tenancy family renters. What's the average tenant stay here, and is there a school-zone premium baked into asking?
- Crime grade is D in this area — have there been break-ins, vandalism, or insurance claims at this property in the last 3 years? What carrier currently insures it and at what premium?
- What's the average days-on-market for RENTAL listings here right now (not sales)? A rising rental-DOM trend means longer vacancies and softer asking-rent achievability than the comps imply.
- What's the recent tenant-quality profile in this submarket — average credit score on applications, eviction rate, late-payment / NSF rate, and stable-employment percentage? A property-management company in the area should have these aggregated.
- How much new for-sale + rental construction is in the pipeline within 1–3 miles? Heavy new supply typically softens prices + rents 12–24 months out; constrained supply supports both.
Investment metrics
- 1% rule
- 2.53% ✓
- Cap rate
- 22.93%
- Cash-on-cash
- 59.41%
- DSCR
- 3.64
- GRM
- 3.3
CMA / ARV
- ARV (on-the-fly)
- $251,430
- Comps found
- 3
Show comp detail 3 sales within ~0.75 mi
| Address | Dist | Beds/Ba | Sqft | Sold | Price | $/sf | Match |
|---|---|---|---|---|---|---|---|
| 3340 Del Sol Blvd Spc 4 | 0.09mi | 2/2.0 | 1,536 (-11%) | 3mo | $80,000 | $52 | 74 |
| 3340 Del Sol Blvd Spc 143 | 0.00mi | 3/2.0 (+1) | 1,640 (-5%) | 22mo | $237,000 | $145 | 68 |
| 3340 Del Sol Blvd #95 | 0.00mi | 3/2.0 (+1) | 1,500 (-14%) | 19mo | $280,000 | $187 | 57 |
Match score weights: distance 35% · size 25% · config 20% · recency 20%. Top-matched comps best support the ARV.
Projected returns pro-forma
-3.0% appreciation · 0.0% rent growth · sell at horizon
- IRR
- 54.8%
- Equity multiple
- 3.31×
- Total profit
- $87,875
- Equity at exit
- $20,263
- IRR
- 58.8%
- Equity multiple
- 6.05×
- Total profit
- $192,015
- Equity at exit
- $11,750
Cash invested: $38,052 (down + closing). Projections, not guarantees.
Landlord ↔ Tenant lean methodology
- Overall (STATE)
- 18 Strongly Tenant-Friendly
- State California
- 18 Strongly Tenant-Friendly · D+13
- County
- — inherits STATE
- City
- — inherits STATE
ZIP-level market 92154
- Rents YoY
- -0.5%
- Active inventory
- 210
- Price-to-rent
- 3.3×
Monthly cashflow live
- Estimated rent
- $3,440 high interval (Pro) →
- Mortgage (P&I)
- −$713
- Tax from tax record
- −$64 /mo · $771/yr
- Insurance
- −$57
- HOA
- −$0
- Vacancy / Maint / Mgmt
- −$722
- Net cashflow
- $1,884
Break-even live
UW: 25.0% down · 7.5% · 30yr · 1.5% tax · 5.0% vac · 8.0% maint · 8.0% mgmt
Financing live
Cash to close
- Down payment
- $33,975
- Closing costs
- $4,077
- Reserves months
- —
- Total cash needed
- —
Loan-product check · same deal, 3 products live
Conventional
25% down · 7.5% · 30yr
- Down + closing
- —
- Monthly P&I
- —
- Monthly cashflow
- —
- DSCR
- —
- Eligible?
- —
Personal DTI + credit; lowest rate.
DSCR
20% down · 8.5% · 30yr
- Down + closing
- —
- Monthly P&I
- —
- Monthly cashflow
- —
- DSCR
- —
- Eligible?
- —
No personal income docs; deal must DSCR.
Hard money
10% down · 12.0% · 12mo
- Down + closing
- —
- Monthly P&I
- —
- Monthly cashflow
- —
- DSCR
- —
- Eligible?
- —
Short-term bridge; refi at stabilization.
Rent comps 12 comps
| Address | Beds | Baths | Sqft | Rent | $/sqft | DOM | Units | Dist |
|---|---|---|---|---|---|---|---|---|
| 3580 Marzo St San Diego, CA | 3.0 | 2.0 | 1700 | $3,500 | $2.06 | 16d | 1 | 0.32mi |
| 3624 Marzo St San Diego, CA | 3.0 | 2.0 | 1330 | $3,295 | $2.48 | 19d | 1 | 0.34mi |
| 3590 Arey Dr San Diego, CA | 3.0 | 2.0 | 1061 | $3,995 | $3.77 | 1d | 1 | 0.36mi |
| 813 Beyer Way San Diego, CA | 3.0 | 2.5 | 1495 | $3,500 | $2.34 | 2d | 1 | 0.38mi |
| 1515 Kenalan Dr San Diego, CA | 3.0 | 2.0 | 1140 | $3,500 | $3.07 | 1d | 1 | 0.74mi |
| 3763 Via del Bardo San Ysidro, CA | 3.0 | 2.5 | 1472 | $4,200 | $2.85 | 2d | 1 | 0.76mi |
| 2709 Elm Ave Unit B San Diego, CA | 3.0 | 3.0 | 1560 | $3,449 | $2.21 | 1d | 1 | 0.94mi |
| 2683 Caulfield Dr San Diego, CA | 3.0 | 2.0 | 1445 | $3,995 | $2.76 | 2d | 1 | 0.97mi |
| 1394 Oro Vista Rd San Diego, CA | 2.0–3.0 | 2.0 | 1088 | $2,725 | $2.50 | 1d | 4 | 1.19mi |
| 4483 Corona Borealis San Diego, CA | 2.0 | 2.5 | 1400 | $3,800 | $2.71 | 14d | 1 | 1.32mi |
| 217 Date St Unit B Chula Vista, CA | 3.0 | 2.5 | 1228 | $3,500 | $2.85 | 2d | 1 | 1.41mi |
| 4589 Casa Nova Ct San Diego, CA | 1.0 | 1.0 | 2224 | $1,150 | $0.52 | 24d | 1 | 1.49mi |
Listing history 20 events
-
2026-06-18days on market $135,900 Active 97 DOM
-
2026-06-17days on market $135,900 Active 96 DOM
-
2026-06-16days on market $135,900 Active 95 DOM
-
2026-06-15days on market $135,900 Active 94 DOM
-
2026-06-13days on market $135,900 Active 92 DOM
-
2026-06-13days on market $135,900 Active 91 DOM
-
2026-06-09days on market $135,900 Active 88 DOM
-
2026-06-08days on market $135,900 Active 87 DOM
-
2026-06-07days on market $135,900 Active 86 DOM
-
2026-06-04days on market $135,900 Active 83 DOM
-
2026-06-03days on market $135,900 Active 82 DOM
-
2026-06-02days on market $135,900 Active 81 DOM
-
2026-06-01days on market $135,900 Active 80 DOM
-
2026-05-31days on market $135,900 Active 79 DOM
-
2026-05-21price $135,900
-
2026-05-05price $150,000
-
2026-05-04price $169,000
-
2026-03-27status Active
-
2026-03-21status Pending Sale
-
2026-03-06$189,900 Active
ⓘ Source: listings_history table (triggers on properties + properties_extension) + one-shot
backfill from property_details.listing_events for pre-trigger history.
Tax reassessment forecast CA · Resets to sale price
- Current annual tax
- $771 · $64/mo
- Projected year-2 tax
- $1,033 · $86/mo
- Expected delta
- +$262/yr (+$22/mo · 34.0%)
ⓘ Screening estimate from a state-policy table — verify with the county assessor before closing.
Climate risk First Street
- Flood 1/10 Low FEMA zone X (unshaded) · 0% chance over 30 yrs
- Wildfire 2/10 Low
- Heat 4/10 Moderate 5 d/yr ≥86°F today · 14 d/yr by 30 yrs out
- Wind 1/10 Low
- Air quality 1/10 Low 0 unhealthy d/yr today · 0 by 30 yrs out
Nearby sold comps map
Loading sold comps map…
Walkable amenities ~0.75 mi
Loading nearby amenities…
Taxation est. · year 1
- Rental income
- $41,279
- − Mortgage interest
- −$7,613
- − Property taxes
- −$771
- − Insurance
- −$680
- − Repairs & maintenance
- −$3,302
- − Management
- −$3,302
- − Depreciation
- −$3,953
- Taxable income
- $21,658
- Est. tax owed @ 24.0%
- −$5,198
- After-tax cash flow
- $17,410/yr
For passive investors: Depreciation is non-cash, so a rental often shows a tax loss while cash-flowing — sheltering income. Rental losses are passive: they offset passive income freely, and up to $25,000/yr can offset ordinary (W-2) income if you actively participate and your MAGI is under $100k (phasing out to $0 by $150k); unused losses carry forward. On sale, claimed depreciation is recaptured at up to 25%, and gains may owe capital-gains tax (a 1031 exchange can defer both). Figures are a year-1 estimate at your 24.0% rate — not tax advice; consult a CPA.
Schools (NCES district)
- District
- Sweetwater Union High
- NCES district ID
- 0638640
- Math proficiency
- 36% ▲ 3.00%
- Reading proficiency
- 52% ▼ -2.00%
- Median HH income
- $59,051
- Composite
- 38.61/100
- National rank
- #4158
- State rank
- #187 of 517 in CA
Livability — San Diego
- Score
- 75/100
- State rank
- #123
- US rank
- #4206
Category grades
Schools grade is shown separately in the Schools card above.
Census & demographics
- Census place
- San Diego, CA
- County
- San Diego County · 3,178,799 people
- City population
- 1,397,612
- Metro
- San Diego-Chula Vista-Carlsbad, CA
- Population (ZIP)
- 80,445
- Household income
- $94,901
- Rent vs Own
- Severe rent burden
- 2959.0
Population outlook (San Diego County) Hauer SSP2
- Today (2025)
- 3,678,185 people
- By 2030
- 3,856,546 · +4.8%
- By 2040
- 4,171,407 · +13.4%
- By 2050
- 4,421,607 · +20.2%
- By 2075
- 4,831,599 · +31.4%
- By 2100
- 4,832,502 · +31.4%
Race, ethnicity, and origin ACS 2023
- Neighborhood character
- Predominantly Hispanic (68%)
- Race & ethnicity
- Hispanic / Latino 68% Two or more races 30% White 12% Asian 12% Black 5% Native American 1%
- Hispanic origin (detail)
- Mexican 65%
- Foreign-born
- 32% · Canada, China
- Languages at home
- 35% English-only · Spanish 56% Tagalog/Filipino 7% Chinese 1%
Political lean MEDSL · San Diego
- 2024 margin
- D (+16.8) · D 56.9% · R 40.1% · Other 2.9%
- 2008→2024 swing
- +6.6pp toward D · 2008: 10.2pp · 2024: 16.8pp
- All cycles
- 2024: D+16.8 2020: D+22.8 2016: D+17.8 2012: D+5.1 2008: D+10.2
Not yet ingested
- Civics
- —
Market trends
- HPI YoY
- ▼ -568.62%
- Current HPI
- 393.1836
- Rent YoY
- ▼ -0.52%
- Metro
- San Diego-Chula Vista-Carlsbad, CA
- State GDP YoY
- ▲ 3.21%
- F500 in state
- 116
Industry mix (Fortune 500 HQ in CA)
| Industry | F500 HQs | Revenue |
|---|---|---|
| Technology | 27 | $1,492B |
|
||
| Financial Services | 3 | $174B |
|
||
| Retail | 3 | $44B |
|
||
| Insurance | 3 | $26B |
|
||
| Media / Entertainment | 2 | $115B |
|
||
| Pharmaceuticals / Biotech | 2 | $62B |
|
||
Price history
-28.4% since first listed6 events — show timeline
- 2026-05-21 Price Changed $135,900 CRMLS
- 2026-05-05 Price Changed $150,000 CRMLS
- 2026-05-04 Price Changed $169,000 CRMLS
- 2026-03-27 Relisted — CRMLS
- 2026-03-21 Pending — CRMLS
- 2026-03-06 Listed $189,900 CRMLS
Property tax history
+3.2%/yrLatest (2013): $771 · +4.6% YoY. Source: county tax records.
Cash-flow waterfall
monthlySold comps — $/sqft
last 12 mo · ≤1 miLoading sold comps…