1219 Walnut St · Utica, NY
Flood risk 1/10 · Minimal
- FEMA flood zone
- X (unshaded)
- Chance of flooding over 30 yrs
- 0.0%
- Est. flood insurance / yr
- $473 – $860
Fire risk 1/10 · Minimal
- Est. fire insurance / yr
- $691 – $1,283
Heat risk 3/10 · Minor
- Hot days now (above 95°F)
- 7 days/yr
- Hot days in 30 yrs
- 16 days/yr
Wind risk 1/10 · Minimal
- Chance of severe wind over 30 yrs
- 1.0%
Air-quality risk 2/10 · Minimal
- Unhealthy air days now
- 0 days/yr
- Unhealthy air days in 30 yrs
- 2 days/yr
Risk factors via First Street. Map © Google.
Why this score? — see what drove the D grade
The composite is a weighted blend of 9 inputs, each scored 0–100. Each bar is that input's sub-score; the figure is the points it added to the 100-point composite (weight × sub-score).
- Cash flow +20.5/30.0
- DSCR +6.5/10.0
- 1% rule +4.9/10.0
- Livability +4.0/5.0
- Schools +2.9/10.0
- Rent growth +2.5/5.0
- Condition / age +2.5/5.0
- ARV discount +0.0/15.0
- Appreciation +0.0/10.0
$169,900
🖨 Deal sheet (PDF) 📄 Offer letter ✓ Due diligence
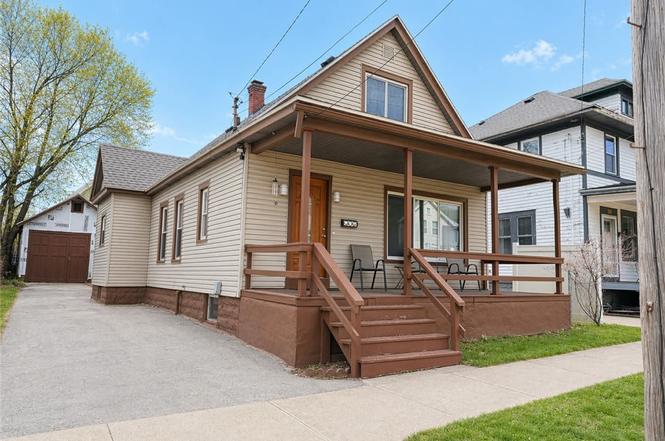
Listing remarks
This charming bungalow-style home offers the perfect blend of character, thoughtful updates, and exceptional value. From the moment you step inside, you’re welcomed by an inviting open-concept layout that creates a natural flow between the living and dining areas. Hardwood floors add warmth and continuity, while the sun-filled living room is enhanced by a tray ceiling and recessed lighting, delivering a clean, modern aesthetic. The kitchen is well-appointed with rich cherry cabinetry, durable ceramic tile flooring, and stainless steel appliances—ideal for both everyday functionality and entertaining. \ The upper level has been tastefully refreshed, featuring new vinyl flooring,
Key facts
- Tray ceiling
- Recessed lighting
- Cherry cabinetry
Tags
Property features AI
Exterior
- Parking: Detached garage (1 car)
- Utilities: Public water (connected); Sewer connected
- Home design: Single-story; Resale property
- Construction: Vinyl siding; Block foundation; Existing construction
- Exterior features: Blacktop driveway; Covered porch; Fully fenced yard; Rectangular residential lot; City street frontage
Interior
- Kitchen: Dishwasher; Gas oven; Gas range; Microwave; Refrigerator
- Bedrooms: 2 main-level bedrooms
- Flooring: Hardwood; Luxury vinyl; Varies
- Bathrooms: 1 full bathroom; 1 half bathroom; 1 main-level bathroom
- Heating & cooling: Gas forced-air heating
- Interior features: Attic; Ceiling fan(s); Main level primary; Bonus room; Full basement
- Laundry & utility: Gas water heater
Neighborhood map
What this means for you Summary
Snapshot
- This is a 3-bed/1.5-bath single-family listed at $170k.
Deal economics
- At list price, monthly cash flow is $225 ($3k/yr) — positive.
- The deal already cash-flows at list — no discount required.
- To meet the 1% rule (rent ≥ 1% of price), the offer needs to be $168k (0.9% below list).
- Recommended offer: $165k (3.0% below list) — sets the bar for market timing.
Location & tenants
- Location reads 80/100 on livability (#104 in NY, #1,589 nationally) — a professional / high-income tenant draw. Strengths: commute A+, cost of living A+, housing A+; Watch: employment D, crime F.
- Utica City School District (urban): math 33% / reading 38% proficiency, ranked #562 of 590 in NY (top 95%) — families likely to look elsewhere, expect single-tenant / working-renter base with shorter leases; 71% free/reduced lunch — lower-income household profile, screen leases tightly.
- Zoned schools: Kernan Elementary School (math 16% / reading 33%, grade F, #1,846 of 2,108 statewide, top 91%, 566 students, 81% FRL); Senator James H Donovan Middle School (math 19% / reading 30%, grade F, #611 of 729 statewide, top 88%, 730 students, 84% FRL); Thomas R Proctor High School (math 86% / reading 62%, grade B+, #659 of 1,100 statewide, top 60%, 2,675 students, 76% FRL).
- Market conditions: 150 active listings in the ZIP; 8 comparable units currently listed for rent nearby; rentals lingering (median 46d on market — plan ~5-8 weeks vacancy on turnover, expect pricing pressure); 100% of comp listings sitting > 30 days — soft ceiling on asking rent; 204 units permitted in Oneida County in 2024 (68 in 5+ unit buildings).
- This rent runs 35% of the median local income ($58k/yr) — at the standard rent-burdened threshold; future hikes will face affordability resistance.
Forward outlook
- Local home prices are declining (-3.0%/yr); year-one equity from $1k of loan paydown is wiped out by about $5k of value loss. Plan a longer hold.
- Oneida County population projected at -12% by 2050 — secular population decline; favor cash flow + early exit over multi-decade hold.
Negotiation context
- It's been on market 52 days — a 3% lower offer ($165k) is reasonable based on typical stale-listing flexibility.
- 2 sale attempts since 4y ago with the ask held roughly flat each time — persistent listings suggest the price (not the market) is what's stuck; bring a comps-based counter.
- Current owner paid $46k; list at $170k implies a 269% gain — meaningful room to come down on a strong offer.
Risks & watch-outs
- Watch-outs: built in 1920 — expect roof / HVAC / electrical / plumbing capex.
Questions for the listing agent
- It's been on market 52 days. Have you received any prior offers? Is the seller open to a 3% concession, seller financing, or rate buy-down credit?
- Built in 1920 — when were the roof, HVAC, electrical panel, plumbing, and water heater last replaced?
- Is there a deadline driving the sale (1031 exchange, divorce, estate, relocation)? That informs how much negotiation room exists.
- Schools are D-rated, which usually means shorter tenancies and higher turnover. Who's the typical renter profile here, and what's been the actual vacancy rate?
- Crime grade is F in this area — have there been break-ins, vandalism, or insurance claims at this property in the last 3 years? What carrier currently insures it and at what premium?
- The area grade is low — what's the realistic commute time and amenity access for the typical tenant pool here? Any planned neighborhood developments (good or bad) we should know about?
- What's the average days-on-market for RENTAL listings here right now (not sales)? A rising rental-DOM trend means longer vacancies and softer asking-rent achievability than the comps imply.
- What's the recent tenant-quality profile in this submarket — average credit score on applications, eviction rate, late-payment / NSF rate, and stable-employment percentage? A property-management company in the area should have these aggregated.
- How much new for-sale + rental construction is in the pipeline within 1–3 miles? Heavy new supply typically softens prices + rents 12–24 months out; constrained supply supports both.
Investment metrics
- 1% rule
- 0.99% ✗
- Cap rate
- 7.88%
- Cash-on-cash
- 5.67%
- DSCR
- 1.25
- GRM
- 8.4
CMA / ARV
- ARV (median comp)
- $130,097
- List price
- $169,900
- Delta
- 30.60%
- Verdict
- OVERPRICED
- Comps
- 20 within 1.0 mi
Show comp detail 12 sales within ~0.75 mi
| Address | Dist | Beds/Ba | Sqft | Sold | Price | $/sf | Match |
|---|---|---|---|---|---|---|---|
| 1310 Oak St | 0.15mi | 3/1.0 | 1,254 (+0%) | 7mo | $160,000 | $128 | 84 |
| 1216 Oak St | 0.12mi | 3/1.0 | 1,196 (-4%) | 3mo | $69,000 | $58 | 83 |
| 1209 Ney Ave | 0.63mi | 3/1.0 | 1,250 (+0%) | 1mo | $162,500 | $130 | 67 |
| 19 Genesee Ct #19 | 0.56mi | 2/2.0 (-1) | 1,260 (+1%) | 4mo | $75,000 | $60 | 62 |
| 1656 Bennett St | 0.56mi | 3/1.5 | 1,344 (+8%) | 2mo | $190,000 | $141 | 60 |
| 832 Waverly Pl | 0.35mi | 4/1.0 (+1) | 1,352 (+8%) | 5mo | $85,000 | $63 | 59 |
| 1005 Ney Ave | 0.68mi | 3/1.0 | 1,326 (+6%) | 1mo | $125,000 | $94 | 55 |
| 919 Lenox Ave | 0.36mi | 4/2.0 (+1) | 1,376 (+10%) | 8mo | $80,000 | $58 | 53 |
| 1405 Kellogg Ave | 0.60mi | 3/1.0 | 1,140 (-9%) | 7mo | $172,000 | $151 | 50 |
| 721 Bristol St | 0.54mi | 3/2.0 | 1,380 (+11%) | 7mo | $175,000 | $127 | 49 |
| 1413 Old Burrstone Rd | 0.74mi | 3/1.5 | 1,080 (-14%) | 1mo | $236,900 | $219 | 42 |
| 6 Bryant St | 0.71mi | 2/2.0 (-1) | 1,084 (-13%) | 1mo | $104,680 | $97 | 37 |
Match score weights: distance 35% · size 25% · config 20% · recency 20%. Top-matched comps best support the ARV.
Projected returns pro-forma
-3.0% appreciation · 3.0% rent growth · sell at horizon
- IRR
- -7.5%
- Equity multiple
- 0.72×
- Total profit
- $-13,224
- Equity at exit
- $25,333
- IRR
- 2.0%
- Equity multiple
- 1.14×
- Total profit
- $6,860
- Equity at exit
- $14,690
Cash invested: $47,572 (down + closing). Projections, not guarantees.
Landlord ↔ Tenant lean methodology
- Overall (STATE)
- 15 Strongly Tenant-Friendly
- State New York
- 15 Strongly Tenant-Friendly · D+10
- County
- — inherits STATE
- City
- — inherits STATE
ZIP-level market 13502
- Home prices YoY
- -12.1%
- Active inventory
- 150
- Price-to-rent
- 8.4×
Monthly cashflow live
- Estimated rent
- $1,684 high interval (Pro) →
- Mortgage (P&I)
- −$891
- Tax from tax record
- −$143 /mo · $1,720/yr
- Insurance
- −$71
- HOA
- −$0
- Vacancy / Maint / Mgmt
- −$354
- Net cashflow
- $225
Break-even live
Sensitivity live
| Price | -10% $321 | -5% $273 | +0% $225 | +5% $177 | +10% $129 |
|---|---|---|---|---|---|
| Rent | -10% $92 | -5% $158 | +0% $225 | +5% $291 | +10% $358 |
| Rate | -1.0pp $310 | -0.5pp $268 | base $225 | +0.5pp $181 | +1.0pp $136 |
UW: 25.0% down · 7.5% · 30yr · 1.5% tax · 5.0% vac · 8.0% maint · 8.0% mgmt
Financing live
Cash to close
- Down payment
- $42,475
- Closing costs
- $5,097
- Reserves months
- —
- Total cash needed
- —
Loan-product check · same deal, 3 products live
Conventional
25% down · 7.5% · 30yr
- Down + closing
- —
- Monthly P&I
- —
- Monthly cashflow
- —
- DSCR
- —
- Eligible?
- —
Personal DTI + credit; lowest rate.
DSCR
20% down · 8.5% · 30yr
- Down + closing
- —
- Monthly P&I
- —
- Monthly cashflow
- —
- DSCR
- —
- Eligible?
- —
No personal income docs; deal must DSCR.
Hard money
10% down · 12.0% · 12mo
- Down + closing
- —
- Monthly P&I
- —
- Monthly cashflow
- —
- DSCR
- —
- Eligible?
- —
Short-term bridge; refi at stabilization.
Rent comps 8 comps
| Address | Beds | Baths | Sqft | Rent | $/sqft | DOM | Units | Dist |
|---|---|---|---|---|---|---|---|---|
| 1224 Whitesboro St Unit 1 Utica, NY | 3.0 | 1.0 | 1100 | $1,125 | $1.02 | 45d | 1 | 0.52mi |
| 11 Noyes St Unit 4 Utica, NY | 2.0 | 1.0 | 1000 | $1,125 | $1.12 | 45d | 1 | 0.53mi |
| 1503 Fox Pl Utica, NY | 3.0 | 1.0 | 1119 | $2,000 | $1.79 | 45d | 1 | 0.83mi |
| 239 Genesee St Utica, NY | 1.0–2.0 | 1.0–2.0 | 1200 | $2,700 | $2.25 | 45d | 15 | 1.09mi |
| 4 1st St Yorkville, NY | 3.0 | 1.0 | 888 | $2,100 | $2.36 | 45d | 1 | 1.24mi |
| 221 Elizabeth St #2 Utica, NY | 2.0 | 1.0 | 1100 | $2,000 | $1.82 | 46d | 1 | 1.32mi |
| 1124 Dudley Ave Unit 1 Utica, NY | 3.0 | 1.0 | 1300 | $1,400 | $1.08 | 45d | 1 | 1.38mi |
| 119 Hotel St Utica, NY | 1.0–2.0 | 1.0–2.0 | 1053 | $2,300 | $2.18 | 45d | 14 | 1.40mi |
Listing history 19 events
-
2026-06-16status $169,900 Pending 52 DOM
-
2026-06-15days on market $169,900 Active Under Contract 52 DOM
-
2026-06-14days on market $169,900 Active Under Contract 50 DOM
-
2026-06-13days on market $169,900 Active Under Contract 49 DOM
-
2026-06-10days on market $169,900 Active Under Contract 47 DOM
-
2026-06-09days on market $169,900 Active Under Contract 46 DOM
-
2026-06-08days on market $169,900 Active Under Contract 45 DOM
-
2026-06-07days on market $169,900 Active Under Contract 44 DOM
-
2026-06-03days on market $169,900 Active Under Contract 40 DOM
-
2026-06-02days on market $169,900 Active Under Contract 39 DOM
-
2026-06-01days on market $169,900 Active Under Contract 38 DOM
-
2026-05-31days on market $169,900 Active Under Contract 37 DOM
-
2026-05-30days on market $169,900 Active Under Contract 36 DOM
-
2026-05-13historical Active Under Contract 1511-char remark
-
2026-04-24$169,900 Active 1511-char remark
-
2022-07-31historical
-
2022-04-13historical Continue to Show- Under Contract
-
2022-04-02$136,000 Active
-
1993-04-08soldstatus $46,000
ⓘ Source: listings_history table (triggers on properties + properties_extension) + one-shot
backfill from property_details.listing_events for pre-trigger history.
Tax reassessment forecast NY · Partial reset (capped growth)
- Current annual tax
- $1,720 · $143/mo
- Projected year-2 tax
- $2,296 · $191/mo
- Expected delta
- +$576/yr (+$48/mo · 33.5%)
ⓘ Screening estimate from a state-policy table — verify with the county assessor before closing.
Climate risk First Street
- Flood 1/10 Low FEMA zone X (unshaded) · 0% chance over 30 yrs
- Wildfire 1/10 Low
- Heat 3/10 Moderate 7 d/yr ≥95°F today · 16 d/yr by 30 yrs out
- Wind 1/10 Low 100% chance of damaging wind over 30 yrs
- Air quality 2/10 Low 0 unhealthy d/yr today · 2 by 30 yrs out
Nearby sold comps map
Loading sold comps map…
Walkable amenities ~0.75 mi
Loading nearby amenities…
Taxation est. · year 1
- Rental income
- $20,203
- − Mortgage interest
- −$9,517
- − Property taxes
- −$1,720
- − Insurance
- −$850
- − Repairs & maintenance
- −$1,616
- − Management
- −$1,616
- − Depreciation
- −$4,943
- Taxable loss
- −$59
- Est. tax savings @ 24.0%
- +$14
- After-tax cash flow
- $2,713/yr
For passive investors: Depreciation is non-cash, so a rental often shows a tax loss while cash-flowing — sheltering income. Rental losses are passive: they offset passive income freely, and up to $25,000/yr can offset ordinary (W-2) income if you actively participate and your MAGI is under $100k (phasing out to $0 by $150k); unused losses carry forward. On sale, claimed depreciation is recaptured at up to 25%, and gains may owe capital-gains tax (a 1031 exchange can defer both). Figures are a year-1 estimate at your 24.0% rate — not tax advice; consult a CPA.
Schools (NCES district)
- District
- Utica City School District
- NCES district ID
- 3629370
- Math proficiency
- 33% ▼ -7.00%
- Reading proficiency
- 38% ▲ 2.00%
- Median HH income
- $31,834
- Composite
- 29.01/100
- National rank
- #6613
- State rank
- #562 of 590 in NY
Livability — Utica
- Score
- 80/100
- State rank
- #104
- US rank
- #1589
Category grades
Schools grade is shown separately in the Schools card above.
Census & demographics
- Census place
- Utica, NY
- County
- Oneida County · 89,710 people
- City population
- 72,968
- Metro
- Utica-Rome, NY
- Population (ZIP)
- 34,037
- Household income
- $57,835
- Rent vs Own
- Severe rent burden
- 1604.0
Population outlook (Oneida County) Hauer SSP2
- Today (2025)
- 225,223 people
- By 2030
- 220,384 · -2.1%
- By 2040
- 209,071 · -7.2%
- By 2050
- 197,920 · -12.1%
- By 2075
- 175,541 · -22.1%
- By 2100
- 148,491 · -34.1%
Race, ethnicity, and origin ACS 2023
- Neighborhood character
- Predominantly White (71%)
- Race & ethnicity
- White 71% Hispanic / Latino 11% Black 9% Two or more races 7% Asian 5%
- Hispanic origin (detail)
- Mexican 2% Puerto Rican 5% Dominican 2%
- Common ancestry
- Romanian 11% Lithuanian 3% American 2%
- Foreign-born
- 12% · Canada, Philippines, China
- Languages at home
- 81% English-only · Spanish 7% Russian/Polish/Slavic 4% Other Asian/Pacific 3%
Political lean MEDSL · Oneida
- 2024 margin
- Strong R (+21.3) · D 39.4% · R 60.6%
- 2008→2024 swing
- -15.2pp toward R · 2008: -6.1pp · 2024: -21.3pp
- All cycles
- 2024: R+21.3 2020: R+15.5 2016: R+21.1 2012: R+5.3 2008: R+6.1
Not yet ingested
- Civics
- —
Market trends
- HPI YoY
- ▼ -50.76%
- Current HPI
- 368.3955
- Rent YoY
- —
- Metro
- Utica-Rome, NY
- State GDP YoY
- ▲ 2.60%
- F500 in state
- 92
Industry mix (Fortune 500 HQ in NY)
| Industry | F500 HQs | Revenue |
|---|---|---|
| Financial Services | 10 | $950B |
|
||
| Consumer Goods | 9 | $162B |
|
||
| Insurance | 4 | $225B |
|
||
| Telecommunications | 2 | $144B |
|
||
| Pharmaceuticals | 2 | $112B |
|
||
| Media / Entertainment | 2 | $69B |
|
||
Price history
+269.3% since first listed7 events — show timeline
- 2026-06-16 Pending — CNYIS
- 2026-05-13 Contingent — CNYIS
- 2026-04-24 Listed $169,900 CNYIS
- 2022-07-31 Listing Removed — CNYIS
- 2022-04-13 Contingent — CNYIS
- 2022-04-02 Listed $136,000 CNYIS
- 1993-04-08 Sold (Public Records) $46,000 Public Records
Property tax history
+4.0%/yrLatest (2025): $1,720 · +5.6% YoY. Source: county tax records.
Cash-flow waterfall
monthlySold comps — $/sqft
last 12 mo · ≤1 miLoading sold comps…