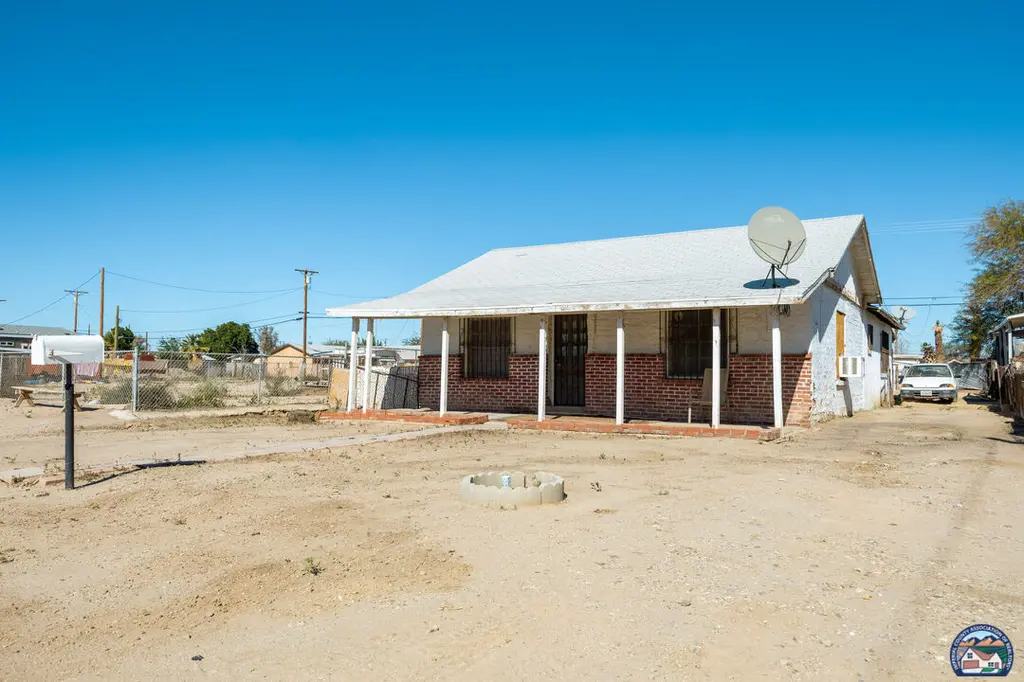
216 E 3rd St · Niland, CA
Flood risk 1/10 · Minimal
- FEMA flood zone
- X (unshaded)
- Chance of flooding over 30 yrs
- 0.0%
- Est. flood insurance / yr
- $507 – $1,088
Fire risk 3/10 · Minor
- Est. fire insurance / yr
- $659 – $1,223
Heat risk 10/10 · Severe
- Hot days now (above 114°F)
- 7 days/yr
- Hot days in 30 yrs
- 20 days/yr
Wind risk 1/10 · Minimal
- Chance of severe wind over 30 yrs
- —
Air-quality risk 2/10 · Minimal
- Unhealthy air days now
- 1 days/yr
- Unhealthy air days in 30 yrs
- 2 days/yr
Risk factors via First Street. Map © Google.
Why this score? — see what drove the B grade
The composite is a weighted blend of 9 inputs, each scored 0–100. Each bar is that input's sub-score; the figure is the points it added to the 100-point composite (weight × sub-score).
- Cash flow +30.0/30.0
- 1% rule +10.0/10.0
- DSCR +10.0/10.0
- ARV discount +7.5/15.0
- Appreciation +5.0/10.0
- Rent growth +2.5/5.0
- Condition / age +2.5/5.0
- Livability +1.9/5.0
- Schools +1.4/10.0
$120,000
🖨 Deal sheet 📄 Offer letter ✓ Due diligence
Listing remarks MLS
Excellent opportunity for investors or buyers looking to add value. This 3-bedroom, 2-bath home offers approximately 1,300 sq ft of living space and sits on a large lot with great potential. The property is a fixer-upper with active utilities in place, including gas, water, and electricity, making renovations more convenient and cost-effective. Ideal for a rehab project, rental investment, or future expansion. Plenty of room to reimagine the space, add outdoor features, or increase functionality. Located in the community of Niland, near the Salton Sea and desert recreation. Bring your vision and unlock the potential of this property.
Key facts
- Active utilities
- Large lot
- Rehab project
Tags
Neighborhood map
What this means for you Summary
Snapshot
- This is a 3-bed/2.0-bath single-family listed at $120k.
Deal economics
- At list price, monthly cash flow is $620 ($7k/yr) — positive.
- The deal already cash-flows at list — no discount required.
- Meets the 1% rule at list price ($2k rent vs $120k).
- Recommended offer: $106k (12.0% below list) — sets the bar for market timing.
Location & tenants
- Location reads 37/100 on livability (#1,426 in CA) — a limited-amenity area; tenant pool skews transient or value-seeking. Strengths: cost of living A; Watch: housing D, schools F, crime F.
- Calipatria Unified (town): math 9% / reading 27% proficiency, ranked #485 of 517 in CA (top 94%) — low school quality limits family demand, transient renter base, plan for 1-2y turnover; 85% free/reduced lunch — lower-income household profile, screen leases tightly.
- Market conditions: 40 active listings in the ZIP; 1 comparable units currently listed for rent nearby; 271 units permitted in Imperial County in 2024 (112 in 5+ unit buildings).
Forward outlook
- In year one you build about $4k of equity ($830 loan paydown + $4k appreciation (3.0% local appreciation)).
- Imperial County population projected at +7% by 2050 — modest demand growth; plan on rents tracking national, not racing it.
- At projected returns (3.0% appreciation + 3.0% rent growth), your $34k cash investment doubles in ~3 years — after that, you're playing with house money.
- By year 8, paydown + projected appreciation supports a ~$33k cash-out refi (75% LTV) — recoverable capital for the next deal without selling this one.
Negotiation context
- It's been on market 123 days — a 12% lower offer ($106k) is reasonable based on typical stale-listing flexibility.
- 3 sale attempts since 2y ago with the ask held roughly flat each time — persistent listings suggest the price (not the market) is what's stuck; bring a comps-based counter.
- Current owner paid $65k; list at $120k implies a 85% gain — meaningful room to come down on a strong offer.
Risks & watch-outs
- Climate carrying-cost: extreme-heat days projected 7→20/yr by 2055 (HVAC capex compounding) — expect insurance premiums to compound above CPI over the hold.
Questions for the listing agent
- It's been on market 123 days. Have you received any prior offers? Is the seller open to a 12% concession, seller financing, or rate buy-down credit?
- Built in 1967 — when were the roof, HVAC, electrical panel, plumbing, and water heater last replaced?
- Why hasn't it sold? Are there any deal-killer items the seller is aware of (foundation, flood, title, zoning, code violations)?
- Is there a deadline driving the sale (1031 exchange, divorce, estate, relocation)? That informs how much negotiation room exists.
- Schools are F-rated, which usually means shorter tenancies and higher turnover. Who's the typical renter profile here, and what's been the actual vacancy rate?
- Crime grade is F in this area — have there been break-ins, vandalism, or insurance claims at this property in the last 3 years? What carrier currently insures it and at what premium?
- What's the average days-on-market for RENTAL listings here right now (not sales)? A rising rental-DOM trend means longer vacancies and softer asking-rent achievability than the comps imply.
- What's the recent tenant-quality profile in this submarket — average credit score on applications, eviction rate, late-payment / NSF rate, and stable-employment percentage? A property-management company in the area should have these aggregated.
- How much new for-sale + rental construction is in the pipeline within 1–3 miles? Heavy new supply typically softens prices + rents 12–24 months out; constrained supply supports both.
Investment metrics
- 1% rule
- 1.54% ✓
- Cap rate
- 12.49%
- Cash-on-cash
- 22.14%
- DSCR
- 1.99
- GRM
- 5.4
CMA / ARV
- ARV (median comp)
- $75,057
- List price
- $120,000
- Delta
- 59.88%
- Verdict
- OVERPRICED
- Comps
- 7 within 1.0 mi
Show comp detail 2 sales within ~0.75 mi
| Address | Dist | Beds/Ba | Sqft | Sold | Price | $/sf | Match |
|---|---|---|---|---|---|---|---|
| 312 E 3rd St | 0.22mi | 3/2.0 | 1,150 (-12%) | 2mo | $248,000 | $216 | 69 |
| 261 E 4th St | 0.14mi | 3/2.0 | 1,486 (+14%) | 22mo | $52,000 | $35 | 51 |
Match score weights: distance 35% · size 25% · config 20% · recency 20%. Top-matched comps best support the ARV.
Projected returns pro-forma
3.0% appreciation · 3.0% rent growth · sell at horizon
- IRR
- 28.4%
- Equity multiple
- 2.61×
- Total profit
- $53,980
- Equity at exit
- $53,957
- IRR
- 28.9%
- Equity multiple
- 5.07×
- Total profit
- $136,888
- Equity at exit
- $83,154
Cash invested: $33,600 (down + closing). Projections, not guarantees.
Landlord ↔ Tenant lean methodology
- Overall (STATE)
- 18 Strongly Tenant-Friendly
- State California
- 18 Strongly Tenant-Friendly · D+13
- County
- — inherits STATE
- City
- — inherits STATE
ZIP-level market 92257
- Active inventory
- 40
- Price-to-rent
- 5.4×
Monthly cashflow live
- Estimated rent
- $1,850 medium interval (Pro) →
- Mortgage (P&I)
- −$629
- Tax from tax record
- −$162 /mo · $1,946/yr
- Insurance
- −$50
- HOA
- −$0
- Vacancy / Maint / Mgmt
- −$388
- Net cashflow
- $620
Break-even live
UW: 25.0% down · 7.5% · 30yr · 1.5% tax · 5.0% vac · 8.0% maint · 8.0% mgmt
Financing live
Cash to close
- Down payment
- $30,000
- Closing costs
- $3,600
- Reserves months
- —
- Total cash needed
- —
Loan-product check · same deal, 3 products live
Conventional
25% down · 7.5% · 30yr
- Down + closing
- —
- Monthly P&I
- —
- Monthly cashflow
- —
- DSCR
- —
- Eligible?
- —
Personal DTI + credit; lowest rate.
DSCR
20% down · 8.5% · 30yr
- Down + closing
- —
- Monthly P&I
- —
- Monthly cashflow
- —
- DSCR
- —
- Eligible?
- —
No personal income docs; deal must DSCR.
Hard money
10% down · 12.0% · 12mo
- Down + closing
- —
- Monthly P&I
- —
- Monthly cashflow
- —
- DSCR
- —
- Eligible?
- —
Short-term bridge; refi at stabilization.
Rent comps 1 comps
| Address | Beds | Baths | Sqft | Rent | $/sqft | DOM | Units | Dist |
|---|---|---|---|---|---|---|---|---|
| 114 E 5th St Niland, CA | 3.0 | 2.0 | 1156 | $1,850 | $1.60 | 3d | 1 | 0.21mi |
Listing history 22 events
-
2026-06-19days on market $120,000 Active 123 DOM
-
2026-06-18days on market $120,000 Active 122 DOM
-
2026-06-17days on market $120,000 Active 121 DOM
-
2026-06-16days on market $120,000 Active 120 DOM
-
2026-06-15days on market $120,000 Active 119 DOM
-
2026-06-14days on market $120,000 Active 117 DOM
-
2026-06-13days on market $120,000 Active 116 DOM
-
2026-06-10days on market $120,000 Active 114 DOM
-
2026-06-09days on market $120,000 Active 113 DOM
-
2026-06-08statusdays on market $120,000 Active 112 DOM
-
2026-06-03statusdays on market $120,000 Pending 111 DOM
-
2026-06-02days on market $120,000 Active 110 DOM
-
2026-06-01days on market $120,000 Active 109 DOM
-
2026-05-31days on market $120,000 Active 108 DOM
-
2026-05-30days on market $120,000 Active 107 DOM
-
2026-04-09status Active 641-char remark
Show marketing remark (641 chars)
Excellent opportunity for investors or buyers looking to add value. This 3-bedroom, 2-bath home offers approximately 1,300 sq ft of living space and sits on a large lot with great potential. The property is a fixer-upper with active utilities in place, including gas, water, and electricity, making renovations more convenient and cost-effective. Ideal for a rehab project, rental investment, or future expansion. Plenty of room to reimagine the space, add outdoor features, or increase functionality. Located in the community of Niland, near the Salton Sea and desert recreation. Bring your vision and unlock the potential of this property.
-
2026-04-01status Pending 641-char remark
Show marketing remark (641 chars)
Excellent opportunity for investors or buyers looking to add value. This 3-bedroom, 2-bath home offers approximately 1,300 sq ft of living space and sits on a large lot with great potential. The property is a fixer-upper with active utilities in place, including gas, water, and electricity, making renovations more convenient and cost-effective. Ideal for a rehab project, rental investment, or future expansion. Plenty of room to reimagine the space, add outdoor features, or increase functionality. Located in the community of Niland, near the Salton Sea and desert recreation. Bring your vision and unlock the potential of this property.
-
2026-02-06$120,000 Active 641-char remark
Show marketing remark (641 chars)
Excellent opportunity for investors or buyers looking to add value. This 3-bedroom, 2-bath home offers approximately 1,300 sq ft of living space and sits on a large lot with great potential. The property is a fixer-upper with active utilities in place, including gas, water, and electricity, making renovations more convenient and cost-effective. Ideal for a rehab project, rental investment, or future expansion. Plenty of room to reimagine the space, add outdoor features, or increase functionality. Located in the community of Niland, near the Salton Sea and desert recreation. Bring your vision and unlock the potential of this property.
-
2024-12-31historical
-
2024-10-10$125,000 Active
-
2024-10-07historical
-
2005-06-28soldstatus $65,000
ⓘ Source: listings_history table (triggers on properties + properties_extension) + one-shot
backfill from property_details.listing_events for pre-trigger history.
Tax reassessment forecast CA · Resets to sale price
- Current annual tax
- $1,946 · $162/mo
- Projected year-2 tax
- $1,946 · $162/mo
- Expected delta
- $0/yr ($0/mo · 0.0%)
ⓘ Screening estimate from a state-policy table — verify with the county assessor before closing.
Climate risk First Street
- Flood 1/10 Low FEMA zone X (unshaded) · 0% chance over 30 yrs
- Wildfire 3/10 Moderate
- Heat 10/10 Extreme 7 d/yr ≥114°F today · 20 d/yr by 30 yrs out
- Wind 1/10 Low
- Air quality 2/10 Low 1 unhealthy d/yr today · 2 by 30 yrs out
Nearby sold comps map
Loading sold comps map…
Walkable amenities ~0.75 mi
Loading nearby amenities…
Taxation est. · year 1
- Rental income
- $22,200
- − Mortgage interest
- −$6,722
- − Property taxes
- −$1,946
- − Insurance
- −$600
- − Repairs & maintenance
- −$1,776
- − Management
- −$1,776
- − Depreciation
- −$3,491
- Taxable income
- $5,889
- Est. tax owed @ 24.0%
- −$1,413
- After-tax cash flow
- $6,027/yr
For passive investors: Depreciation is non-cash, so a rental often shows a tax loss while cash-flowing — sheltering income. Rental losses are passive: they offset passive income freely, and up to $25,000/yr can offset ordinary (W-2) income if you actively participate and your MAGI is under $100k (phasing out to $0 by $150k); unused losses carry forward. On sale, claimed depreciation is recaptured at up to 25%, and gains may owe capital-gains tax (a 1031 exchange can defer both). Figures are a year-1 estimate at your 24.0% rate — not tax advice; consult a CPA.
Schools (NCES district)
- District
- Calipatria Unified
- NCES district ID
- 0606990
- Math proficiency
- 9% ▼ -18.00%
- Reading proficiency
- 27% ▼ -18.00%
- Median HH income
- $30,088
- Composite
- 14.28/100
- National rank
- #9446
- State rank
- #485 of 517 in CA
Livability — Niland
- Score
- 37/100
- State rank
- #1426
- US rank
- #27602
Category grades
Schools grade is shown separately in the Schools card above.
Census & demographics
- Census place
- Niland, CA
- Population (ZIP)
- 2,185
Population outlook (Imperial County) Hauer SSP2
- Today (2025)
- 186,713 people
- By 2030
- 190,022 · +1.8%
- By 2040
- 195,993 · +5.0%
- By 2050
- 199,534 · +6.9%
- By 2075
- 216,878 · +16.2%
- By 2100
- 352,705 · +88.9%
Race, ethnicity, and origin ACS 2023
- Neighborhood character
- Diverse neighborhood (Simpson 0.58)
- Race & ethnicity
- Hispanic / Latino 60% Two or more races 23% White 21% Black 12% Asian 3%
- Hispanic origin (detail)
- Mexican 59%
- Common ancestry
- Lithuanian 2% Iranian 1% Portuguese 1%
- Foreign-born
- 17% · Canada
- Languages at home
- 45% English-only · Spanish 52% Other Indo-European 3%
Political lean MEDSL · Imperial
- 2024 margin
- Toss-up / Even · D 48.3% · R 49.1% · Other 2.6%
- 2008→2024 swing
- -27.0pp toward R · 2008: 26.2pp · 2024: -0.9pp
- All cycles
- 2024: R+0.9 2020: D+24.4 2016: D+41.1 2012: D+28.8 2008: D+26.2
Not yet ingested
- Civics
- —
Market trends
- HPI YoY
- —
- Current HPI
- —
- Rent YoY
- —
- Metro
- —
- State GDP YoY
- ▲ 3.21%
- F500 in state
- 116
Industry mix (Fortune 500 HQ in CA)
| Industry | F500 HQs | Revenue |
|---|---|---|
| Technology | 27 | $1,492B |
|
||
| Financial Services | 3 | $174B |
|
||
| Retail | 3 | $44B |
|
||
| Insurance | 3 | $26B |
|
||
| Media / Entertainment | 2 | $115B |
|
||
| Pharmaceuticals / Biotech | 2 | $62B |
|
||
Price history
+84.6% since first listed7 events — show timeline
- 2026-04-09 Relisted — ICAOR
- 2026-04-01 Pending — ICAOR
- 2026-02-06 Listed $120,000 ICAOR
- 2024-12-31 Listing Removed — CRMLS
- 2024-10-10 Listed $125,000 CRMLS
- 2024-10-07 Coming Soon — CRMLS
- 2005-06-28 Sold (Public Records) $65,000 Public Records
Property tax history
+2.5%/yrLatest (2025): $1,946 · -3.4% YoY. Source: county tax records.
Cash-flow waterfall
monthlySold comps — $/sqft
last 12 mo · ≤1 miLoading sold comps…