 60-Plex
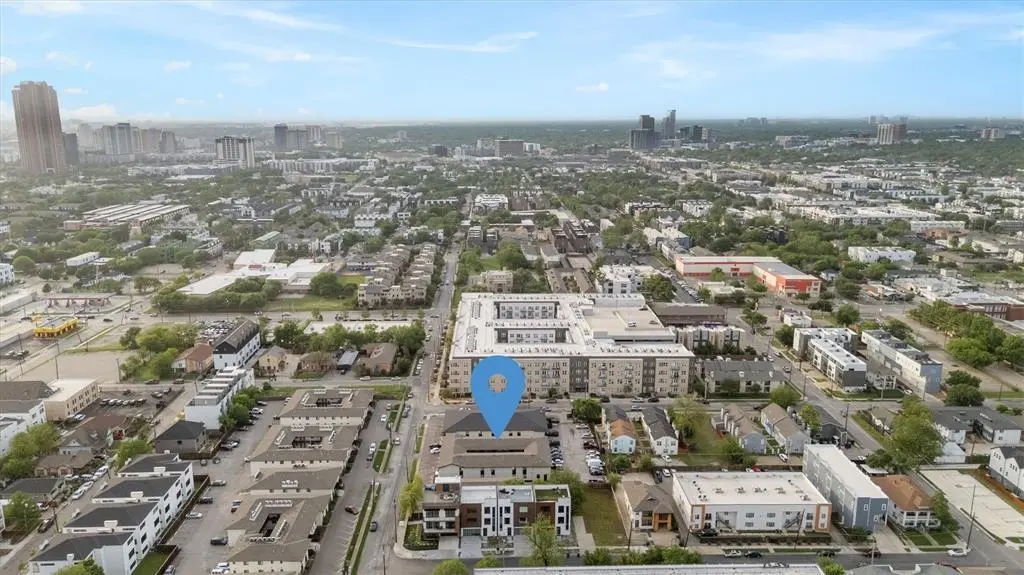
1516 Annex Ave · Dallas, TX
Flood risk 1/10 · Minimal
- FEMA flood zone
- X (unshaded)
- Chance of flooding over 30 yrs
- 0.0%
- Est. flood insurance / yr
- $507 – $1,088
Fire risk 1/10 · Minimal
- Est. fire insurance / yr
- $1,222 – $2,270
Heat risk 7/10 · Major
- Hot days now (above 109°F)
- 7 days/yr
- Hot days in 30 yrs
- 23 days/yr
Wind risk 6/10 · Moderate
- Chance of severe wind over 30 yrs
- 27.0%
Air-quality risk 3/10 · Minor
- Unhealthy air days now
- 2 days/yr
- Unhealthy air days in 30 yrs
- 3 days/yr
Risk factors via First Street. Map © Google.
Why this score? — see what drove the B- grade
The composite is a weighted blend of 9 inputs, each scored 0–100. Each bar is that input's sub-score; the figure is the points it added to the 100-point composite (weight × sub-score).
- Cash flow +30.0/30.0
- DSCR +10.0/10.0
- 1% rule +9.6/10.0
- ARV discount +7.3/15.0
- Livability +4.0/5.0
- Rent growth +3.2/5.0
- Schools +2.8/10.0
- Condition / age +2.5/5.0
- Appreciation +0.0/10.0
$6,350,000
🖨 Deal sheet 📄 Offer letter ✓ Due diligence
Multi-family units
County records classify this as Multi-Family (5+ Unit). Listing-text estimate: 60 units. confirmed
5+ unit building — per-unit beds/baths from public records are typically unavailable; the breakdown below (if shown) is an estimate from the listing text.
Listing remarks MLS
Stabilizing 60 Unit Vaue-Add Asset Opportunity - ~$416K NOI - Strong Upside - Prime East Dallas Location Main Description This is a rare opportunity to acquire a recently stabilized, cash-flowing 60-unit multifamily asset in the highly desirable East Dallas submarket, one of Dallas' strongest rental corridors with continued population and job growth. The property has undergone significant operational improvements, with occupancy now approaching stabilization and current NOI of ~$415,872, providing immediate in-place cash flow with additional upside remaining. Investment Highlights - Strong In-Place Cash Flow - Current NOI: ~$415K - Stabilizing occupancy (~88-90%) - Immediate yield with continued upside - Value-Add Completed or Near Completion - Operational improvements already executed - Reduced execution risk compared to typical value-add deals - Remaining Upside Potential - Rental increases through continued stabilization - Opportunity to further optimize operations - Attractive Basis vs Replacement Cost - Well below new construction pricing - Ideal for long-term investors - Prime East Dallas Location - Minutes from Downtown Dallas - Strong renter demand - Excellent access to employment centers
Key facts
- New lighting
- Completed repairs
- Excellent location
Tags
Neighborhood map
What this means for you Summary
Snapshot
- This is a 60 × 1-bed/1-bath units multifamily listed at $6.35M.
Deal economics
- At list price, monthly cash flow is $26k ($312k/yr) — positive. Per door: $433/mo.
- The deal already cash-flows at list — no discount required.
- Meets the 1% rule at list price ($92k rent vs $6.35M).
- Recommended offer: $5.78M (9.0% below list) — sets the bar for market timing.
- Cap rate 11.2% vs local median 2.3% in Dallas — top-decile yield for the area; either an underpriced asset or a hidden risk that comps aren't pricing in. Stress-test before assuming the spread holds.
Location & tenants
- Location reads 81/100 on livability (#24 in TX, #1,380 nationally) — a professional / high-income tenant draw. Strengths: amenities A+, commute A+, housing A+; Watch: schools C-, crime F.
- Dallas ISD (urban): math 31% / reading 36% proficiency, ranked #559 of 826 in TX (top 68%) — families likely to look elsewhere, expect single-tenant / working-renter base with shorter leases; 83% free/reduced lunch — lower-income household profile, screen leases tightly.
- Market conditions: Rents rising (+3.0%/yr); 291 active listings in the ZIP; 3 comparable units currently listed for rent nearby; rentals leasing fast (median 13d on market — plan ~1-2 weeks tenant-placement turnaround); solid renter incomes; 12,577 units permitted in Dallas County in 2024 (6,829 in 5+ unit buildings).
- At $92,482/mo this rent would consume 1203% of the median local household income ($92k/yr) (locally 2640% of renters already pay >50% of income on rent) — very limited rent-growth headroom before tenants either downsize or default.
Forward outlook
- Local home prices are declining (-3.0%/yr); year-one equity from $44k of loan paydown is wiped out by about $190k of value loss. Plan a longer hold.
- Dallas County population projected at +35% by 2050 — long-run rental-demand tailwind backs the buy-and-hold thesis.
- At projected returns (-3.0% appreciation + 3.0% rent growth), your $1.78M cash investment doubles in ~7 years — after that, you're playing with house money.
Negotiation context
- It's been on market 94 days — a 9% lower offer ($5.78M) is reasonable based on typical stale-listing flexibility.
- 4 sale attempts since 10y ago; this cycle's ask has dropped $350k (5%) from the opening price — seller is motivated, your offer sets the floor, not the list.
Risks & watch-outs
- Climate carrying-cost: major wind risk, 27% chance of damaging wind over 30y; extreme-heat days projected 7→23/yr by 2055 (HVAC capex compounding) — expect insurance premiums to compound above CPI over the hold.
Questions for the listing agent
- It's been on market 94 days. Have you received any prior offers? Is the seller open to a 9% concession, seller financing, or rate buy-down credit?
- Can we see the unit-by-unit rent roll, current vacancy, and any below-market leases? What's the average tenancy length?
- What capital expenditures (roof, boiler, parking lot, exteriors) have been made in the last 5 years, and what's planned in the next 2?
- Built in 1963 — when were the roof, HVAC, electrical panel, plumbing, and water heater last replaced?
- Why hasn't it sold? Are there any deal-killer items the seller is aware of (foundation, flood, title, zoning, code violations)?
- Is there a deadline driving the sale (1031 exchange, divorce, estate, relocation)? That informs how much negotiation room exists.
- Crime grade is F in this area — have there been break-ins, vandalism, or insurance claims at this property in the last 3 years? What carrier currently insures it and at what premium?
- What's the average days-on-market for RENTAL listings here right now (not sales)? A rising rental-DOM trend means longer vacancies and softer asking-rent achievability than the comps imply.
- What's the recent tenant-quality profile in this submarket — average credit score on applications, eviction rate, late-payment / NSF rate, and stable-employment percentage? A property-management company in the area should have these aggregated.
- How much new apartment / multifamily construction is in the pipeline within 1–3 miles? Heavy new supply (>2% of stock underway) typically softens rents 12–24 months out; light construction supports rent growth.
Investment metrics
- 1% rule
- 1.46% ✓
- Cap rate
- 11.20%
- Cash-on-cash
- 17.54%
- DSCR
- 1.78
- GRM
- 5.7
CMA / ARV
- ARV (median comp)
- $6,320,893
- List price
- $6,350,000
- Delta
- 0.46%
- Verdict
- FAIR
- Comps
- 1 within 2.0 mi
Show comp detail 3 sales within ~0.75 mi
| Address | Dist | Beds/Ba | Sqft | Sold | Price | $/sf | Match |
|---|---|---|---|---|---|---|---|
| 4514 Cabell Dr | 0.41mi | 10/12.5 | 8,240 (+4%) | 14mo | $2,750,000 | $334 | 63 |
| 5003 Bryan St #12 | 0.32mi | 12/12.0 | 8,452 (+7%) | 20mo | $2,299,000 | $272 | 57 |
| 4710 Munger Ave | 0.23mi | —/— | 9,102 (+15%) | 12mo | $1,689,000 | $186 | 54 |
Match score weights: distance 35% · size 25% · config 20% · recency 20%. Top-matched comps best support the ARV.
Projected returns pro-forma
-3.0% appreciation · 2.98% rent growth · sell at horizon
- IRR
- 9.0%
- Equity multiple
- 1.35×
- Total profit
- $627,289
- Equity at exit
- $946,806
- IRR
- 18.2%
- Equity multiple
- 2.51×
- Total profit
- $2,683,021
- Equity at exit
- $549,032
Cash invested: $1,778,000 (down + closing). Projections, not guarantees.
Landlord ↔ Tenant lean methodology
- Overall (STATE)
- 87 Strongly Landlord-Friendly
- State Texas
- 87 Strongly Landlord-Friendly · R+5
- County
- — inherits STATE
- City
- — inherits STATE
ZIP-level market 75204
- Home prices YoY
- -17.2%
- Rents YoY
- 3.0%
- Active inventory
- 291
- Price-to-rent
- 343.3×
Monthly cashflow live
- Estimated rent
- $92,482 high interval (Pro) →
- Mortgage (P&I)
- −$33,300
- Tax from tax record
- −$11,134 /mo · $133,603/yr
- Insurance
- −$2,646
- HOA
- −$0
- Vacancy / Maint / Mgmt
- −$19,421
- Net cashflow
- $25,981
Break-even live
60-unit breakdown (identical units grouped — click to expand)
| Units | Beds | Baths | Est. rent |
|---|---|---|---|
| 60× units | 1 | 1 | $92,460 |
| #1 | 1 | 1 | $1,541 |
| #2 | 1 | 1 | $1,541 |
| #3 | 1 | 1 | $1,541 |
| #4 | 1 | 1 | $1,541 |
| #5 | 1 | 1 | $1,541 |
| #6 | 1 | 1 | $1,541 |
| #7 | 1 | 1 | $1,541 |
| #8 | 1 | 1 | $1,541 |
| #9 | 1 | 1 | $1,541 |
| #10 | 1 | 1 | $1,541 |
| #11 | 1 | 1 | $1,541 |
| #12 | 1 | 1 | $1,541 |
| #13 | 1 | 1 | $1,541 |
| #14 | 1 | 1 | $1,541 |
| #15 | 1 | 1 | $1,541 |
| #16 | 1 | 1 | $1,541 |
| #17 | 1 | 1 | $1,541 |
| #18 | 1 | 1 | $1,541 |
| #19 | 1 | 1 | $1,541 |
| #20 | 1 | 1 | $1,541 |
| #21 | 1 | 1 | $1,541 |
| #22 | 1 | 1 | $1,541 |
| #23 | 1 | 1 | $1,541 |
| #24 | 1 | 1 | $1,541 |
| #25 | 1 | 1 | $1,541 |
| #26 | 1 | 1 | $1,541 |
| #27 | 1 | 1 | $1,541 |
| #28 | 1 | 1 | $1,541 |
| #29 | 1 | 1 | $1,541 |
| #30 | 1 | 1 | $1,541 |
| #31 | 1 | 1 | $1,541 |
| #32 | 1 | 1 | $1,541 |
| #33 | 1 | 1 | $1,541 |
| #34 | 1 | 1 | $1,541 |
| #35 | 1 | 1 | $1,541 |
| #36 | 1 | 1 | $1,541 |
| #37 | 1 | 1 | $1,541 |
| #38 | 1 | 1 | $1,541 |
| #39 | 1 | 1 | $1,541 |
| #40 | 1 | 1 | $1,541 |
| #41 | 1 | 1 | $1,541 |
| #42 | 1 | 1 | $1,541 |
| #43 | 1 | 1 | $1,541 |
| #44 | 1 | 1 | $1,541 |
| #45 | 1 | 1 | $1,541 |
| #46 | 1 | 1 | $1,541 |
| #47 | 1 | 1 | $1,541 |
| #48 | 1 | 1 | $1,541 |
| #49 | 1 | 1 | $1,541 |
| #50 | 1 | 1 | $1,541 |
| #51 | 1 | 1 | $1,541 |
| #52 | 1 | 1 | $1,541 |
| #53 | 1 | 1 | $1,541 |
| #54 | 1 | 1 | $1,541 |
| #55 | 1 | 1 | $1,541 |
| #56 | 1 | 1 | $1,541 |
| #57 | 1 | 1 | $1,541 |
| #58 | 1 | 1 | $1,541 |
| #59 | 1 | 1 | $1,541 |
| #60 | 1 | 1 | $1,541 |
| Total (60 units) | $92,482 | ||
UW: 25.0% down · 7.5% · 30yr · 1.5% tax · 5.0% vac · 8.0% maint · 8.0% mgmt
Financing live
Cash to close
- Down payment
- $1,587,500
- Closing costs
- $190,500
- Reserves months
- —
- Total cash needed
- —
Loan-product check · same deal, 3 products live
Conventional
25% down · 7.5% · 30yr
- Down + closing
- —
- Monthly P&I
- —
- Monthly cashflow
- —
- DSCR
- —
- Eligible?
- —
Personal DTI + credit; lowest rate.
DSCR
20% down · 8.5% · 30yr
- Down + closing
- —
- Monthly P&I
- —
- Monthly cashflow
- —
- DSCR
- —
- Eligible?
- —
No personal income docs; deal must DSCR.
Hard money
10% down · 12.0% · 12mo
- Down + closing
- —
- Monthly P&I
- —
- Monthly cashflow
- —
- DSCR
- —
- Eligible?
- —
Short-term bridge; refi at stabilization.
Rent comps 3 comps
| Address | Beds | Baths | Sqft | Rent | $/sqft | DOM | Units | Dist |
|---|---|---|---|---|---|---|---|---|
| 316 N Carroll Ave Dallas, TX | 1.0 | 1.0 | 7399 | $1,025 | $0.14 | 44d | 1 | 0.79mi |
| 264 N Walton St Unit 1289466P Dallas, TX | 1.0 | 1.0 | 8363 | $3,372 | $0.40 | 6d | 1 | 1.22mi |
| 2922 Elm St Unit 1289462P Dallas, TX | 1.0 | 1.0 | 8880 | $3,965 | $0.45 | 13d | 1 | 1.26mi |
Listing history 12 events
-
2026-04-13price $6,350,000 1272-char remark
Show marketing remark (1272 chars)
Stabilizing 60 Unit Vaue-Add Asset Opportunity - ~$416K NOI - Strong Upside - Prime East Dallas Location Main Description This is a rare opportunity to acquire a recently stabilized, cash-flowing 60-unit multifamily asset in the highly desirable East Dallas submarket, one of Dallas' strongest rental corridors with continued population and job growth. The property has undergone significant operational improvements, with occupancy now approaching stabilization and current NOI of ~$415,872, providing immediate in-place cash flow with additional upside remaining. Investment Highlights - Strong In-Place Cash Flow - Current NOI: ~$415K - Stabilizing occupancy (~88-90%) - Immediate yield with continued upside - Value-Add Completed or Near Completion - Operational improvements already executed - Reduced execution risk compared to typical value-add deals - Remaining Upside Potential - Rental increases through continued stabilization - Opportunity to further optimize operations - Attractive Basis vs Replacement Cost - Well below new construction pricing - Ideal for long-term investors - Prime East Dallas Location - Minutes from Downtown Dallas - Strong renter demand - Excellent access to employment centers
-
2026-02-24$6,700,000 Active 1272-char remark
Show marketing remark (1272 chars)
Stabilizing 60 Unit Vaue-Add Asset Opportunity - ~$416K NOI - Strong Upside - Prime East Dallas Location Main Description This is a rare opportunity to acquire a recently stabilized, cash-flowing 60-unit multifamily asset in the highly desirable East Dallas submarket, one of Dallas' strongest rental corridors with continued population and job growth. The property has undergone significant operational improvements, with occupancy now approaching stabilization and current NOI of ~$415,872, providing immediate in-place cash flow with additional upside remaining. Investment Highlights - Strong In-Place Cash Flow - Current NOI: ~$415K - Stabilizing occupancy (~88-90%) - Immediate yield with continued upside - Value-Add Completed or Near Completion - Operational improvements already executed - Reduced execution risk compared to typical value-add deals - Remaining Upside Potential - Rental increases through continued stabilization - Opportunity to further optimize operations - Attractive Basis vs Replacement Cost - Well below new construction pricing - Ideal for long-term investors - Prime East Dallas Location - Minutes from Downtown Dallas - Strong renter demand - Excellent access to employment centers
-
2025-08-09historical $975
-
2025-07-02$975
-
2024-03-22soldstatus
-
2024-03-20soldstatus Closed 237-char remark
Show marketing remark (237 chars)
Investment opportunity in excellent location near Henderson Avenue. 3 buildings compromising a total of 58 units. Completed and ongoing repairs include roof, new lighting, painting, newly laid asphalt parking lot, and upgrades to units.
-
2024-01-31status Pending 237-char remark
Show marketing remark (237 chars)
Investment opportunity in excellent location near Henderson Avenue. 3 buildings compromising a total of 58 units. Completed and ongoing repairs include roof, new lighting, painting, newly laid asphalt parking lot, and upgrades to units.
-
2024-01-13historical Active Option Contract 237-char remark
Show marketing remark (237 chars)
Investment opportunity in excellent location near Henderson Avenue. 3 buildings compromising a total of 58 units. Completed and ongoing repairs include roof, new lighting, painting, newly laid asphalt parking lot, and upgrades to units.
-
2023-12-13$6,500,000 Active 237-char remark
Show marketing remark (237 chars)
Investment opportunity in excellent location near Henderson Avenue. 3 buildings compromising a total of 58 units. Completed and ongoing repairs include roof, new lighting, painting, newly laid asphalt parking lot, and upgrades to units.
-
2018-03-07soldstatus
-
2016-07-21historical
-
2016-07-11$3,690,000 Active
ⓘ Source: listings_history table (triggers on properties + properties_extension) + one-shot
backfill from property_details.listing_events for pre-trigger history.
Tax reassessment forecast TX · Resets to sale price
- Current annual tax
- $133,603 · $11,134/mo
- Projected year-2 tax
- $133,603 · $11,134/mo
- Expected delta
- $0/yr ($0/mo · 0.0%)
ⓘ Screening estimate from a state-policy table — verify with the county assessor before closing.
Climate risk First Street
- Flood 1/10 Low FEMA zone X (unshaded) · 0% chance over 30 yrs
- Wildfire 1/10 Low
- Heat 7/10 Severe 7 d/yr ≥109°F today · 23 d/yr by 30 yrs out
- Wind 6/10 Major 27% chance of damaging wind over 30 yrs
- Air quality 3/10 Moderate 2 unhealthy d/yr today · 3 by 30 yrs out
Nearby sold comps map
Loading sold comps map…
Walkable amenities ~0.75 mi
Loading nearby amenities…
Taxation est. · year 1
- Rental income
- $1,109,784
- − Mortgage interest
- −$355,699
- − Property taxes
- −$133,603
- − Insurance
- −$31,750
- − Repairs & maintenance
- −$88,783
- − Management
- −$88,783
- − Depreciation
- −$184,727
- Taxable income
- $226,440
- Est. tax owed @ 24.0%
- −$54,346
- After-tax cash flow
- $257,430/yr
For passive investors: Depreciation is non-cash, so a rental often shows a tax loss while cash-flowing — sheltering income. Rental losses are passive: they offset passive income freely, and up to $25,000/yr can offset ordinary (W-2) income if you actively participate and your MAGI is under $100k (phasing out to $0 by $150k); unused losses carry forward. On sale, claimed depreciation is recaptured at up to 25%, and gains may owe capital-gains tax (a 1031 exchange can defer both). Figures are a year-1 estimate at your 24.0% rate — not tax advice; consult a CPA.
Schools (NCES district)
- District
- Dallas ISD
- NCES district ID
- 4816230
- Math proficiency
- 31% ▼ -16.00%
- Reading proficiency
- 36% ▼ -4.00%
- Median HH income
- $42,881
- Composite
- 28.41/100
- National rank
- #6763
- State rank
- #559 of 826 in TX
Livability — Dallas
- Score
- 81/100
- State rank
- #24
- US rank
- #1380
Category grades
Schools grade is shown separately in the Schools card above.
Census & demographics
- Census place
- Dallas, TX
- County
- Dallas County · 2,612,404 people
- City population
- 1,168,437
- Metro
- Dallas-Fort Worth-Arlington, TX
- Population (ZIP)
- 34,666
- Household income
- $92,253
- Rent vs Own
- Severe rent burden
- 2640.0
Population outlook (Dallas County) Hauer SSP2
- Today (2025)
- 2,979,839 people
- By 2030
- 3,191,823 · +7.1%
- By 2040
- 3,619,611 · +21.5%
- By 2050
- 4,026,915 · +35.1%
- By 2075
- 4,957,073 · +66.4%
- By 2100
- 5,508,725 · +84.9%
Race, ethnicity, and origin ACS 2023
- Neighborhood character
- Diverse neighborhood (Simpson 0.63)
- Race & ethnicity
- White 55% Hispanic / Latino 20% Black 15% Two or more races 9% Asian 7%
- Hispanic origin (detail)
- Mexican 14% Puerto Rican 1%
- Common ancestry
- Romanian 3% Slovak 2% Lithuanian 2%
- Foreign-born
- 16% · Canada, China, Vietnam
- Languages at home
- 77% English-only · Spanish 15% Other Indo-European 2% Other Asian/Pacific 2%
Political lean MEDSL · Dallas
- 2024 margin
- Strong D (+22.2) · D 60.2% · R 38.0% · Other 1.8%
- 2008→2024 swing
- +6.9pp toward D · 2008: 15.3pp · 2024: 22.2pp
- All cycles
- 2024: D+22.2 2020: D+31.6 2016: D+26.2 2012: D+15.4 2008: D+15.3
Not yet ingested
- Civics
- —
Market trends
- HPI YoY
- ▼ -53.52%
- Current HPI
- 257.1264
- Rent YoY
- ▲ 2.98%
- Metro
- Dallas-Fort Worth-Arlington, TX
- State GDP YoY
- ▲ 3.95%
- F500 in state
- 110
Industry mix (Fortune 500 HQ in TX)
| Industry | F500 HQs | Revenue |
|---|---|---|
| Energy | 16 | $1,198B |
|
||
| Technology | 5 | $198B |
|
||
| Engineering / Construction | 4 | $72B |
|
||
| Energy Services | 3 | $60B |
|
||
| Utilities | 3 | $41B |
|
||
| Healthcare | 2 | $330B |
|
||
Price history
+72.1% since first listed12 events — show timeline
- 2026-04-13 Price Changed $6,350,000 NTREIS
- 2026-02-24 Listed $6,700,000 NTREIS
- 2025-08-09 Rental Removed $975 SHOWMOJO
- 2025-07-02 Listed for Rent $975 SHOWMOJO
- 2024-03-22 Sold (Public Records) — Public Records
- 2024-03-20 Sold (MLS) — NTREIS
- 2024-01-31 Pending — NTREIS
- 2024-01-13 Contingent — NTREIS
- 2023-12-13 Listed $6,500,000 NTREIS
- 2018-03-07 Sold (Public Records) — Public Records
- 2016-07-21 Listing Removed — NTREIS
- 2016-07-11 Listed $3,690,000 NTREIS
Property tax history
+12.1%/yrLatest (2025): $133,603 · +8.5% YoY. Source: county tax records.
Cash-flow waterfall
monthlySold comps — $/sqft
last 12 mo · ≤1 miLoading sold comps…