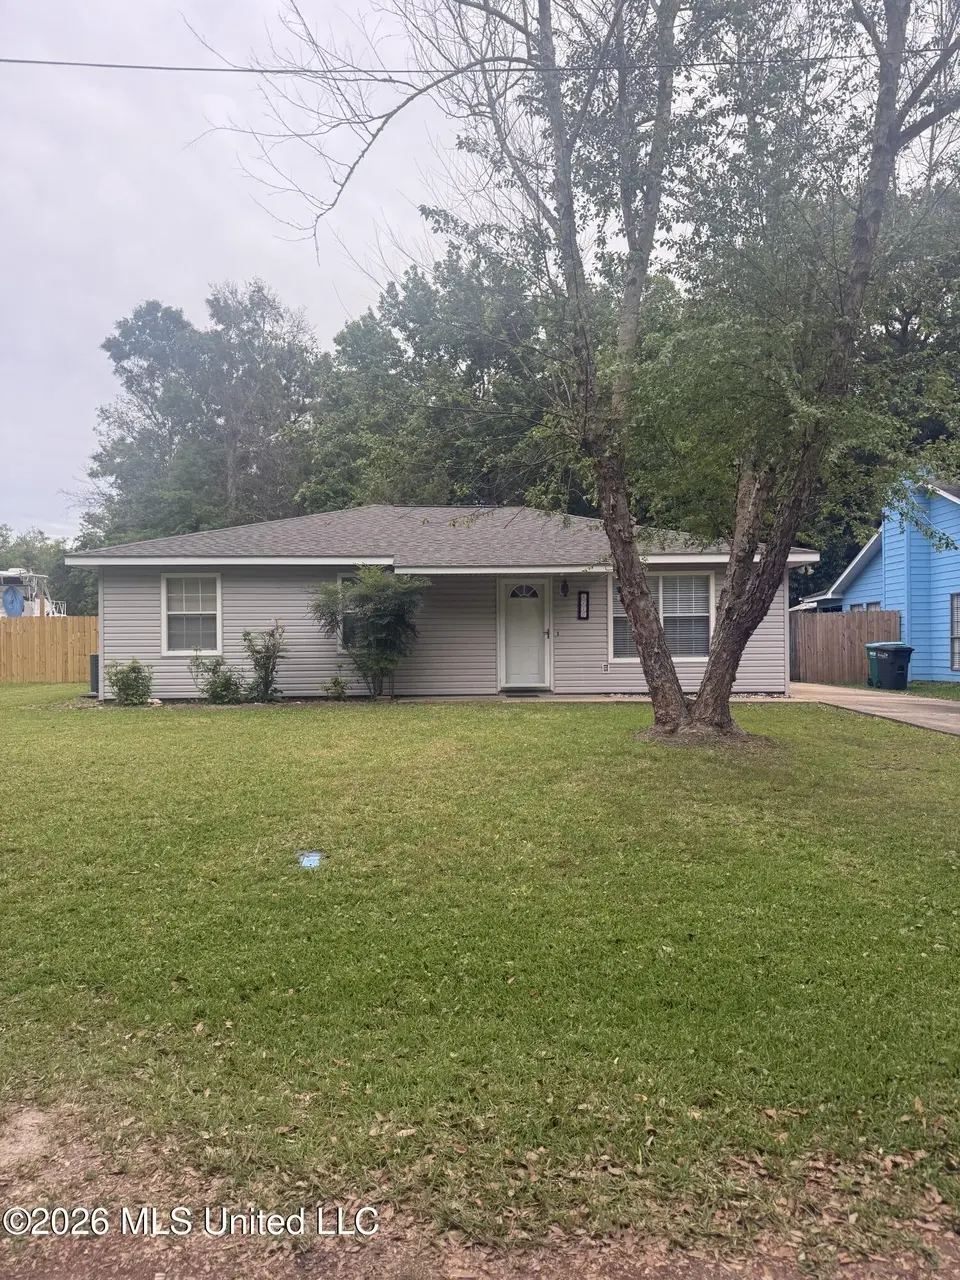
1716 Tradewinds Dr · Gautier, MS
Flood risk 5/10 · Moderate
- FEMA flood zone
- X (shaded)
- Chance of flooding over 30 yrs
- 0.24%
- Est. flood insurance / yr
- $507 – $1,088
Fire risk 5/10 · Moderate
- Est. fire insurance / yr
- $1,241 – $2,305
Heat risk 10/10 · Severe
- Hot days now (above 106°F)
- 7 days/yr
- Hot days in 30 yrs
- 23 days/yr
Wind risk 10/10 · Severe
- Chance of severe wind over 30 yrs
- 99.0%
Air-quality risk 2/10 · Minimal
- Unhealthy air days now
- 1 days/yr
- Unhealthy air days in 30 yrs
- 2 days/yr
Risk factors via First Street. Map © Google.
Why this score? — see what drove the D- grade
The composite is a weighted blend of 9 inputs, each scored 0–100. Each bar is that input's sub-score; the figure is the points it added to the 100-point composite (weight × sub-score).
- Cash flow +13.4/30.0
- DSCR +4.0/10.0
- 1% rule +3.8/10.0
- Schools +3.3/10.0
- Livability +3.3/5.0
- ARV discount +2.8/15.0
- Rent growth +2.5/5.0
- Condition / age +2.5/5.0
- Appreciation +0.0/10.0
$190,000
🖨 Deal sheet 📄 Offer letter ✓ Due diligence
Listing remarks
Well - Maintain 3 bedroom 1.5 bath home located in Gautier , MS. The property offer offers a functional layout with open floor plan . Conventiontly located near local shopping , schools and dining. THIS IS A MUST SEE !
Key facts
- Open floor plan
- Schools
- Dining
Tags
Property features AI
Exterior
- Parking: Driveway (concrete); Parking for 3 vehicles
- Utilities: Public water; Public sewer and septic tank; Electricity connected; Cable available; Water connected; Sewer connected
- Home design: Single-family house; One story
- Construction: Siding construction; Shingle roof; Slab foundation; Assessor-reported living area
- Exterior features: Enclosed rear porch; Back yard fencing; Shed(s)
Interior
- Kitchen: Dishwasher; Free-standing electric range
- Bathrooms: 1 full bathroom; 1 half bathroom (1.5 total)
- Heating & cooling: Central heating; Central air conditioning
- Interior features: Move-in ready; See remarks (exterior details referenced)
- Laundry & utility: Washer and dryer included; Water heater
Neighborhood map
What this means for you Summary
Snapshot
- This is a 3-bed/2.0-bath single-family listed at $190k.
Deal economics
- At list price, monthly cash flow is $4 ($53/yr) — positive.
- The deal already cash-flows at list — no discount required.
- To meet the 1% rule (rent ≥ 1% of price), the offer needs to be $167k (12.2% below list).
- Recommended offer: $167k (12.2% below list) — sets the bar for 1% rule.
- Cap rate 6.3% vs local median 4.2% in Gautier — top-decile yield for the area; either an underpriced asset or a hidden risk that comps aren't pricing in. Stress-test before assuming the spread holds.
Location & tenants
- Location reads 66/100 on livability (#89 in MS) — a middle-class / working-renter tenant base. Strengths: cost of living A+, housing A+; Watch: health & safety D+, schools D, employment D.
- Pascagoula-Gautier School District (urban): math 40% / reading 38% proficiency, ranked #41 of 130 in MS (top 32%) — families likely to look elsewhere, expect single-tenant / working-renter base with shorter leases; 78% free/reduced lunch — lower-income household profile, screen leases tightly.
- Market conditions: 208 active listings in the ZIP; 1 comparable units currently listed for rent nearby; 516 units permitted in Jackson County in 2024 (6 in 5+ unit buildings).
- This rent runs 35% of the median local income ($57k/yr) — at the standard rent-burdened threshold; future hikes will face affordability resistance.
Forward outlook
- Local home prices are declining (-3.0%/yr); year-one equity from $1k of loan paydown is wiped out by about $6k of value loss. Plan a longer hold.
Negotiation context
- It's been on market 56 days — a 3% lower offer ($184k) is reasonable based on typical stale-listing flexibility.
Risks & watch-outs
- Climate carrying-cost: moderate flood risk; severe wind risk, 99% chance of damaging wind over 30y; moderate wildfire risk; extreme-heat days projected 7→23/yr by 2055 (HVAC capex compounding) — expect insurance premiums to compound above CPI over the hold.
Questions for the listing agent
- It's been on market 56 days. Have you received any prior offers? Is the seller open to a 12% concession, seller financing, or rate buy-down credit?
- Is there a deadline driving the sale (1031 exchange, divorce, estate, relocation)? That informs how much negotiation room exists.
- Schools are D-rated, which usually means shorter tenancies and higher turnover. Who's the typical renter profile here, and what's been the actual vacancy rate?
- The area grade is low — what's the realistic commute time and amenity access for the typical tenant pool here? Any planned neighborhood developments (good or bad) we should know about?
- What's the average days-on-market for RENTAL listings here right now (not sales)? A rising rental-DOM trend means longer vacancies and softer asking-rent achievability than the comps imply.
- What's the recent tenant-quality profile in this submarket — average credit score on applications, eviction rate, late-payment / NSF rate, and stable-employment percentage? A property-management company in the area should have these aggregated.
- How much new for-sale + rental construction is in the pipeline within 1–3 miles? Heavy new supply typically softens prices + rents 12–24 months out; constrained supply supports both.
Investment metrics
- 1% rule
- 0.88% ✗
- Cap rate
- 6.32%
- Cash-on-cash
- 0.10%
- DSCR
- 1.00
- GRM
- 9.5
CMA / ARV
- ARV (on-the-fly)
- $172,200
- Comps found
- 9
Show comp detail 9 sales within ~0.75 mi
| Address | Dist | Beds/Ba | Sqft | Sold | Price | $/sf | Match |
|---|---|---|---|---|---|---|---|
| 1804 Seacrest Dr | 0.06mi | 3/2.0 | 1,200 (-2%) | 8mo | $264,900 | $221 | 86 |
| 3308 Neptune Dr | 0.40mi | 3/2.0 | 1,280 (+4%) | 6mo | $164,900 | $129 | 70 |
| 2405 Santa Cruz St | 0.56mi | 3/2.0 | 1,300 (+6%) | 5mo | $179,900 | $138 | 60 |
| 2212 Starfish Rd | 0.49mi | 3/2.0 | 1,350 (+10%) | 6mo | $188,900 | $140 | 56 |
| 2529 Windward Dr | 0.73mi | 3/3.0 | 1,252 (+2%) | 8mo | $209,000 | $167 | 52 |
| 2309 Tradewinds Dr | 0.50mi | 2/2.0 (-1) | 1,144 (-7%) | 11mo | $163,975 | $143 | 51 |
| 1825 Porpoise Dr | 0.37mi | 3/2.0 | 1,396 (+14%) | 15mo | $174,900 | $125 | 48 |
| 2505 Barbados Dr | 0.70mi | 3/2.0 | 1,391 (+13%) | 3mo | $219,900 | $158 | 43 |
| 2501 Bahama Dr | 0.71mi | 3/2.0 | 1,167 (-5%) | 20mo | $103,000 | $88 | 42 |
Match score weights: distance 35% · size 25% · config 20% · recency 20%. Top-matched comps best support the ARV.
Projected returns pro-forma
-3.0% appreciation · 3.0% rent growth · sell at horizon
- IRR
- -16.1%
- Equity multiple
- 0.43×
- Total profit
- $-30,480
- Equity at exit
- $28,330
- IRR
- -7.8%
- Equity multiple
- 0.51×
- Total profit
- $-26,075
- Equity at exit
- $16,428
Cash invested: $53,200 (down + closing). Projections, not guarantees.
Landlord ↔ Tenant lean methodology
- Overall (STATE)
- 90 Strongly Landlord-Friendly
- State Mississippi
- 90 Strongly Landlord-Friendly · R+11
- County
- — inherits STATE
- City
- — inherits STATE
ZIP-level market 39553
- Home prices YoY
- -17.0%
- Active inventory
- 208
- Price-to-rent
- 9.5×
Monthly cashflow live
- Estimated rent
- $1,668 medium interval (Pro) →
- Mortgage (P&I)
- −$996
- Tax est. 1.5%
- −$238 /mo · $2,850/yr
- Insurance
- −$79
- HOA
- −$0
- Vacancy / Maint / Mgmt
- −$350
- Net cashflow
- $4
Break-even live
UW: 25.0% down · 7.5% · 30yr · 1.5% tax · 5.0% vac · 8.0% maint · 8.0% mgmt
Financing live
Cash to close
- Down payment
- $47,500
- Closing costs
- $5,700
- Reserves months
- —
- Total cash needed
- —
Loan-product check · same deal, 3 products live
Conventional
25% down · 7.5% · 30yr
- Down + closing
- —
- Monthly P&I
- —
- Monthly cashflow
- —
- DSCR
- —
- Eligible?
- —
Personal DTI + credit; lowest rate.
DSCR
20% down · 8.5% · 30yr
- Down + closing
- —
- Monthly P&I
- —
- Monthly cashflow
- —
- DSCR
- —
- Eligible?
- —
No personal income docs; deal must DSCR.
Hard money
10% down · 12.0% · 12mo
- Down + closing
- —
- Monthly P&I
- —
- Monthly cashflow
- —
- DSCR
- —
- Eligible?
- —
Short-term bridge; refi at stabilization.
Rent comps 1 comps
| Address | Beds | Baths | Sqft | Rent | $/sqft | DOM | Units | Dist |
|---|---|---|---|---|---|---|---|---|
| 4304 Beach Blvd Ocean Springs, MS | 2.0 | 1.0 | 1200 | $2,200 | $1.83 | 13d | 1 | 1.28mi |
Listing history 15 events
-
2026-06-18days on market $190,000 Active 56 DOM
-
2026-06-17days on market $190,000 Active 55 DOM
-
2026-06-16days on market $190,000 Active 54 DOM
-
2026-06-15days on market $190,000 Active 53 DOM
-
2026-06-14days on market $190,000 Active 51 DOM
-
2026-06-13days on market $190,000 Active 50 DOM
-
2026-06-10days on market $190,000 Active 48 DOM
-
2026-06-09days on market $190,000 Active 47 DOM
-
2026-06-08days on market $190,000 Active 46 DOM
-
2026-06-07days on market $190,000 Active 45 DOM
-
2026-06-02days on market $190,000 Active 40 DOM
-
2026-06-01days on market $190,000 Active 39 DOM
-
2026-05-31days on market $190,000 Active 38 DOM
-
2026-05-30days on market $190,000 Active 37 DOM
-
2026-04-24$190,000 Active
ⓘ Source: listings_history table (triggers on properties + properties_extension) + one-shot
backfill from property_details.listing_events for pre-trigger history.
Climate risk First Street
- Flood 5/10 Major FEMA zone X (shaded) · 24% chance over 30 yrs
- Wildfire 5/10 Major
- Heat 10/10 Extreme 7 d/yr ≥106°F today · 23 d/yr by 30 yrs out
- Wind 10/10 Extreme 99% chance of damaging wind over 30 yrs
- Air quality 2/10 Low 1 unhealthy d/yr today · 2 by 30 yrs out
Nearby sold comps map
Loading sold comps map…
Walkable amenities ~0.75 mi
Loading nearby amenities…
Taxation est. · year 1
- Rental income
- $20,013
- − Mortgage interest
- −$10,643
- − Property taxes
- −$2,850
- − Insurance
- −$950
- − Repairs & maintenance
- −$1,601
- − Management
- −$1,601
- − Depreciation
- −$5,527
- Taxable loss
- −$3,160
- Est. tax savings @ 24.0%
- +$758
- After-tax cash flow
- $812/yr
For passive investors: Depreciation is non-cash, so a rental often shows a tax loss while cash-flowing — sheltering income. Rental losses are passive: they offset passive income freely, and up to $25,000/yr can offset ordinary (W-2) income if you actively participate and your MAGI is under $100k (phasing out to $0 by $150k); unused losses carry forward. On sale, claimed depreciation is recaptured at up to 25%, and gains may owe capital-gains tax (a 1031 exchange can defer both). Figures are a year-1 estimate at your 24.0% rate — not tax advice; consult a CPA.
Schools (NCES district)
- District
- Pascagoula-Gautier School District
- NCES district ID
- 2803480
- Math proficiency
- 40% ▼ -3.00%
- Reading proficiency
- 38% ▼ -4.00%
- Median HH income
- $41,392
- Composite
- 32.86/100
- National rank
- #5613
- State rank
- #41 of 130 in MS
Livability — Gautier
- Score
- 66/100
- State rank
- #89
- US rank
- #11250
Category grades
Schools grade is shown separately in the Schools card above.
Census & demographics
- Census place
- Gautier, MS
- County
- Jackson County · 82,196 people
- City population
- 17,225
- Metro
- Gulfport-Biloxi, MS
- Population (ZIP)
- 17,225
- Household income
- $57,460
- Rent vs Own
- Severe rent burden
- 653.0
Population outlook (Jackson County) Hauer SSP2
- Today (2025)
- 146,926 people
- By 2030
- 148,442 · +1.0%
- By 2040
- 149,631 · +1.8%
- By 2050
- 148,723 · +1.2%
- By 2075
- 147,845 · +0.6%
- By 2100
- 144,510 · -1.6%
Race, ethnicity, and origin ACS 2023
- Neighborhood character
- Diverse neighborhood (Simpson 0.60)
- Race & ethnicity
- White 55% Black 28% Hispanic / Latino 12% Two or more races 7% Asian 1%
- Hispanic origin (detail)
- Mexican 3% Puerto Rican 8%
- Common ancestry
- Slovak 4% Lithuanian 3% Serbian 2%
- Foreign-born
- 3% · Canada, China
- Languages at home
- 90% English-only · Spanish 8% Chinese 0%
Political lean MEDSL · Jackson
- 2024 margin
- Solid R (+39.9) · D 29.5% · R 69.4% · Other 1.1%
- 2008→2024 swing
- -6.4pp toward R · 2008: -33.5pp · 2024: -39.9pp
- All cycles
- 2024: R+39.9 2020: R+34.6 2016: R+39.9 2012: R+36.1 2008: R+33.5
Not yet ingested
- Civics
- —
Market trends
- HPI YoY
- ▼ -42.77%
- Current HPI
- 209.1746
- Rent YoY
- —
- Metro
- Gulfport-Biloxi, MS
- State GDP YoY
- —
- F500 in state
- 0
Price history
1 event — show timeline
- 2026-04-24 Listed $190,000 MLSU
Cash-flow waterfall
monthlySold comps — $/sqft
last 12 mo · ≤1 miLoading sold comps…