 🏗️ New Construction
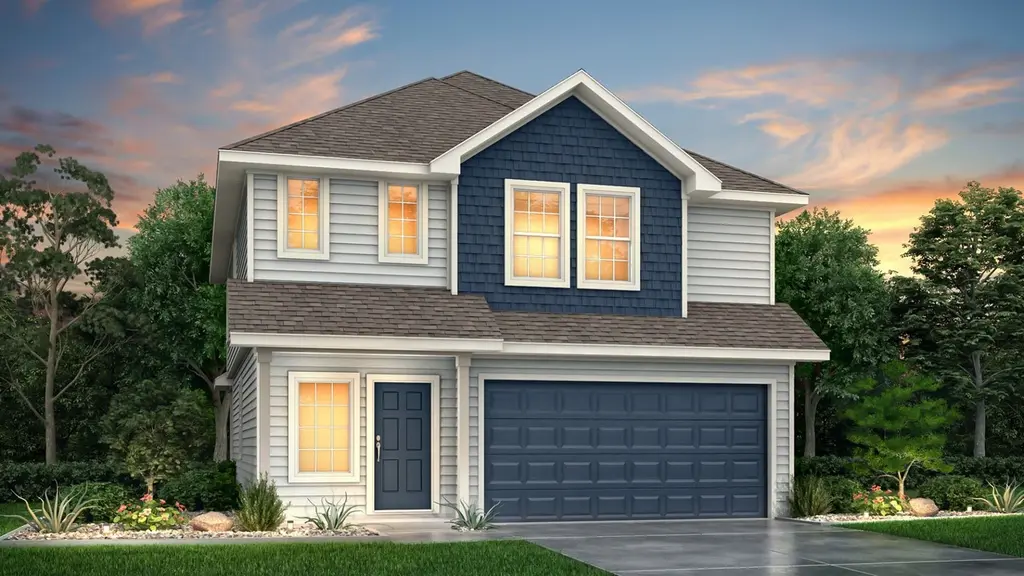
The Auburn Plan · Conroe, TX
Flood risk No data
- FEMA flood zone
- —
- Chance of flooding over 30 yrs
- —
- Est. flood insurance / yr
- —
Fire risk No data
- Est. fire insurance / yr
- —
Heat risk No data
- Hot days now (above threshold)
- —
- Hot days in 30 yrs
- —
Wind risk No data
- Chance of severe wind over 30 yrs
- —
Air-quality risk No data
- Unhealthy air days now
- —
- Unhealthy air days in 30 yrs
- —
Risk factors via First Street. Map © Google.
Why this score? — see what drove the D- grade
The composite is a weighted blend of 9 inputs, each scored 0–100. Each bar is that input's sub-score; the figure is the points it added to the 100-point composite (weight × sub-score).
- Cash flow +9.2/30.0
- ARV discount +7.5/15.0
- Schools +5.1/10.0
- Condition / age +4.0/5.0
- Livability +3.7/5.0
- 1% rule +2.8/10.0
- DSCR +2.6/10.0
- Rent growth +2.6/5.0
- Appreciation +0.0/10.0
$272,990
🖨 Deal sheet 📄 Offer letter ✓ Due diligence
Listing remarks MLS
The Auburn is a 2-story home with 3 bedrooms, 2.5 baths and a spacious 1st floor flex space that can act as a separate office space, game room, or guest suite. The primary suite and 2 additional bedrooms are located on the 2nd floor.
Key facts
- 2 garage spots
- Listed 88 days
Neighborhood map
What this means for you Summary
Snapshot
- This is a 3-bed/2.5-bath single-family listed at $273k. Condition is rated good.
Deal economics
- At list price, monthly cash flow is $-215 ($-3k/yr) — negative.
- To cash-flow at today's rent, offer at most $257k (5.9% below list).
- To meet the 1% rule (rent ≥ 1% of price), the offer needs to be $225k (17.7% below list).
- Recommended offer: $225k (17.7% below list) — sets the bar for 1% rule.
- Cap rate 5.4% vs local median 3.1% in Conroe — top-decile yield for the area; either an underpriced asset or a hidden risk that comps aren't pricing in. Stress-test before assuming the spread holds.
Location & tenants
- Location reads 74/100 on livability (#169 in TX, #4,447 nationally) — a middle-class / working-renter tenant base. Strengths: cost of living A+, housing A+, amenities B; Watch: schools D+, commute F, health & safety F.
- Conroe ISD (other): math 57% / reading 57% proficiency, ranked #69 of 826 in TX (top 8%) — acceptable for families but not a draw, mixed tenant base, ~2y average lease.
- Market conditions: Rents flat; 310 active listings in the ZIP; 5 comparable units currently listed for rent nearby; rentals leasing fast (median 7d on market — plan ~1-2 weeks tenant-placement turnaround); solid renter incomes; 13,259 units permitted in Montgomery County in 2024 (1,402 in 5+ unit buildings).
Forward outlook
- Local home prices are declining (-3.0%/yr); year-one equity from $2k of loan paydown is wiped out by about $9k of value loss. Plan a longer hold.
- Montgomery County population projected at +65% by 2050 — long-run rental-demand tailwind backs the buy-and-hold thesis.
Negotiation context
- It's been on market 88 days — a 6% lower offer ($257k) is reasonable based on typical stale-listing flexibility.
Questions for the listing agent
- What do current leases actually rent for vs. the listed asking? Can we see a recent rent roll and the last 12 months of T-12 income?
- It's been on market 88 days. Have you received any prior offers? Is the seller open to a 18% concession, seller financing, or rate buy-down credit?
- Why hasn't it sold? Are there any deal-killer items the seller is aware of (foundation, flood, title, zoning, code violations)?
- Is there a deadline driving the sale (1031 exchange, divorce, estate, relocation)? That informs how much negotiation room exists.
- Schools are D-rated, which usually means shorter tenancies and higher turnover. Who's the typical renter profile here, and what's been the actual vacancy rate?
- The area grade is low — what's the realistic commute time and amenity access for the typical tenant pool here? Any planned neighborhood developments (good or bad) we should know about?
- What's the average days-on-market for RENTAL listings here right now (not sales)? A rising rental-DOM trend means longer vacancies and softer asking-rent achievability than the comps imply.
- What's the recent tenant-quality profile in this submarket — average credit score on applications, eviction rate, late-payment / NSF rate, and stable-employment percentage? A property-management company in the area should have these aggregated.
- How much new for-sale + rental construction is in the pipeline within 1–3 miles? Heavy new supply typically softens prices + rents 12–24 months out; constrained supply supports both.
Investment metrics
- 1% rule
- 0.78% ✗
- Cap rate
- 5.40%
- Cash-on-cash
- -3.21%
- DSCR
- 0.86
- GRM
- 10.7
CMA / ARV
- ARV (median comp)
- $288,047
- List price
- $272,990
- Delta
- -5.23%
- Verdict
- FAIR
- Comps
- 20 within 1.0 mi
Show comp detail 12 sales within ~0.75 mi
| Address | Dist | Beds/Ba | Sqft | Sold | Price | $/sf | Match |
|---|---|---|---|---|---|---|---|
| 2542 Sturgeon Way | 0.04mi | 4/2.5 (+1) | 2,065 (-1%) | 1mo | $269,900 | $131 | 90 |
| 2510 Carp Dr | 0.25mi | 3/2.5 | 2,082 (-1%) | 2mo | $240,000 | $115 | 86 |
| 14008 Paddlefish Dr | 0.19mi | 4/2.5 (+1) | 2,100 (+0%) | 9mo | $259,998 | $124 | 78 |
| 2414 Coachlight Ln | 0.39mi | 3/2.5 | 2,195 (+5%) | 2mo | $445,000 | $203 | 72 |
| 2419 Carriage Ridge Ln | 0.45mi | 3/2.0 | 2,303 (+10%) | 2mo | $395,000 | $172 | 58 |
| 13356 Burbot Dr | 0.75mi | 4/2.5 (+1) | 2,111 (+1%) | 4mo | $289,990 | $137 | 56 |
| 13368 Burbot Dr | 0.73mi | 4/2.5 (+1) | 1,940 (-7%) | 4mo | $274,990 | $142 | 46 |
| 13613 Goldeye Dr | 0.69mi | 4/2.5 (+1) | 1,940 (-7%) | 7mo | $249,990 | $129 | 45 |
| 2328 Mooneye Ct | 0.64mi | 4/2.5 (+1) | 1,940 (-7%) | 10mo | $274,990 | $142 | 45 |
| 2348 Mooneye Ct | 0.65mi | 4/2.5 (+1) | 1,940 (-7%) | 10mo | $269,990 | $139 | 44 |
| 12382 New River Trl | 0.74mi | 4/2.0 (+1) | 1,895 (-10%) | 1mo | $310,000 | $164 | 42 |
| 13265 Musky Dr | 0.74mi | 4/2.5 (+1) | 1,940 (-7%) | 10mo | $266,000 | $137 | 40 |
Match score weights: distance 35% · size 25% · config 20% · recency 20%. Top-matched comps best support the ARV.
Projected returns pro-forma
-3.0% appreciation · 0.44% rent growth · sell at horizon
- IRR
- -24.5%
- Equity multiple
- 0.18×
- Total profit
- $-66,009
- Equity at exit
- $42,949
- IRR
- -29.8%
- Equity multiple
- -0.20×
- Total profit
- $-97,015
- Equity at exit
- $24,905
Cash invested: $80,653 (down + closing). Projections, not guarantees.
Landlord ↔ Tenant lean methodology
- Overall (STATE)
- 87 Strongly Landlord-Friendly
- State Texas
- 87 Strongly Landlord-Friendly · R+5
- County
- — inherits STATE
- City
- — inherits STATE
ZIP-level market 77384
- Home prices YoY
- -22.6%
- Rents YoY
- 0.4%
- Active inventory
- 310
- Price-to-rent
- 10.1×
Monthly cashflow live
- Estimated rent
- $2,247 high interval (Pro) →
- Mortgage (P&I)
- −$1,511
- Tax est. 1.5%
- −$360 /mo · $4,321/yr
- Insurance
- −$120
- HOA
- −$0
- Vacancy / Maint / Mgmt
- −$472
- Net cashflow
- $-215
Break-even live
UW: 25.0% down · 7.5% · 30yr · 1.5% tax · 5.0% vac · 8.0% maint · 8.0% mgmt
Financing live
Cash to close
- Down payment
- $72,012
- Closing costs
- $8,641
- Reserves months
- —
- Total cash needed
- —
Loan-product check · same deal, 3 products live
Conventional
25% down · 7.5% · 30yr
- Down + closing
- —
- Monthly P&I
- —
- Monthly cashflow
- —
- DSCR
- —
- Eligible?
- —
Personal DTI + credit; lowest rate.
DSCR
20% down · 8.5% · 30yr
- Down + closing
- —
- Monthly P&I
- —
- Monthly cashflow
- —
- DSCR
- —
- Eligible?
- —
No personal income docs; deal must DSCR.
Hard money
10% down · 12.0% · 12mo
- Down + closing
- —
- Monthly P&I
- —
- Monthly cashflow
- —
- DSCR
- —
- Eligible?
- —
Short-term bridge; refi at stabilization.
Rent comps 5 comps
| Address | Beds | Baths | Sqft | Rent | $/sqft | DOM | Units | Dist |
|---|---|---|---|---|---|---|---|---|
| 2547 Steelhead Dr Conroe, TX | 4.0 | 2.5 | 2628 | $2,390 | $0.91 | 5d | 1 | 0.25mi |
| 14031 Chinook Dr Conroe, TX | 4.0 | 3.5 | 2630 | $2,550 | $0.97 | 43d | 1 | 0.35mi |
| 9811 Laurel Lake Dr Conroe, TX | 3.0–4.0 | 2.0–2.5 | 1830 | $1,867 | $1.02 | 1d | 1 | 1.03mi |
| 14221 Rainier Peak Xing Conroe, TX | 4.0 | 2.5 | 2289 | $2,446 | $1.07 | 7d | 1 | 1.12mi |
| 9857 Laurel Lake Dr Shenandoah, TX | 4.0 | 2.0 | 1717 | $2,250 | $1.31 | 22d | 1 | 1.20mi |
Listing history 14 events
-
2026-06-18days on market $272,990 Active 88 DOM
-
2026-06-17days on market $272,990 Active 87 DOM
-
2026-06-16days on market $272,990 Active 86 DOM
-
2026-06-15days on market $272,990 Active 85 DOM
-
2026-06-13days on market $272,990 Active 83 DOM
-
2026-06-09days on market $272,990 Active 79 DOM
-
2026-06-08days on market $272,990 Active 78 DOM
-
2026-06-07days on market $272,990 Active 77 DOM
-
2026-06-04days on market $272,990 Active 74 DOM
-
2026-06-03days on market $272,990 Active 73 DOM
-
2026-06-02days on market $272,990 Active 72 DOM
-
2026-06-01days on market $272,990 Active 71 DOM
-
2026-05-31days on market $272,990 Active 70 DOM
-
2026-03-22$272,990 Active 233-char remark
Show marketing remark (233 chars)
The Auburn is a 2-story home with 3 bedrooms, 2.5 baths and a spacious 1st floor flex space that can act as a separate office space, game room, or guest suite. The primary suite and 2 additional bedrooms are located on the 2nd floor.
ⓘ Source: listings_history table (triggers on properties + properties_extension) + one-shot
backfill from property_details.listing_events for pre-trigger history.
Nearby sold comps map
Loading sold comps map…
Walkable amenities ~0.75 mi
Loading nearby amenities…
Taxation est. · year 1
- Rental income
- $26,964
- − Mortgage interest
- −$16,135
- − Property taxes
- −$4,321
- − Insurance
- −$1,440
- − Repairs & maintenance
- −$2,157
- − Management
- −$2,157
- − Depreciation
- −$8,380
- Taxable loss
- −$7,626
- Est. tax savings @ 24.0%
- +$1,830
- After-tax cash flow
- $-756/yr
For passive investors: Depreciation is non-cash, so a rental often shows a tax loss while cash-flowing — sheltering income. Rental losses are passive: they offset passive income freely, and up to $25,000/yr can offset ordinary (W-2) income if you actively participate and your MAGI is under $100k (phasing out to $0 by $150k); unused losses carry forward. On sale, claimed depreciation is recaptured at up to 25%, and gains may owe capital-gains tax (a 1031 exchange can defer both). Figures are a year-1 estimate at your 24.0% rate — not tax advice; consult a CPA.
Condition & rehab AI · 12 photos
This 2-story home is in good condition with modern finishes and a well-maintained exterior. It has potential for further value increases with minor updates.
Value-add opportunities
- Resale Paint exterior siding — Fresh paint enhances curb appeal and property value
- Both Replace carpet with hardwood flooring — Hardwood flooring is more durable and adds value to the home
- Both Install smart home technology — Smart home features can increase both resale and rental value
Renovation cost estimate screening
Value-add ROI direction
- Resale Paint exterior siding — Fresh paint enhances curb appeal and property value ↑
- Both Replace carpet with hardwood flooring — Hardwood flooring is more durable and adds value to the home ↑
- Both Install smart home technology — Smart home features can increase both resale and rental value ↑
ⓘ Cost ranges are severity-bucket heuristics (US national rule-of-thumb). Get contractor quotes + a written scope before underwriting a rehab budget.
Schools (NCES district)
- District
- Conroe ISD
- NCES district ID
- 4815000
- Math proficiency
- 57% ▼ -6.00%
- Reading proficiency
- 57% ▼ -1.00%
- Median HH income
- $71,541
- Composite
- 50.65/100
- National rank
- #1833
- State rank
- #69 of 826 in TX
Livability — Conroe
- Score
- 74/100
- State rank
- #169
- US rank
- #4447
Category grades
Schools grade is shown separately in the Schools card above.
Census & demographics
- County
- Montgomery County · 663,713 people
- City population
- 205,417
- Metro
- Houston-The Woodlands-Sugar Land, TX
- Population (ZIP)
- 26,781
- Household income
- $91,667
- Rent vs Own
- Severe rent burden
- 1399.0
Population outlook (Montgomery County) Hauer SSP2
- Today (2025)
- 713,896 people
- By 2030
- 805,263 · +12.8%
- By 2040
- 992,708 · +39.1%
- By 2050
- 1,179,590 · +65.2%
- By 2075
- 1,628,084 · +128.1%
- By 2100
- 1,937,880 · +171.5%
Race, ethnicity, and origin ACS 2023
- Neighborhood character
- Predominantly White (66%)
- Race & ethnicity
- White 66% Hispanic / Latino 20% Two or more races 14% Asian 6% Black 5%
- Hispanic origin (detail)
- Mexican 12%
- Common ancestry
- Lithuanian 2% Romanian 2% Italian 2%
- Foreign-born
- 17% · Canada, Jamaica, China
- Languages at home
- 79% English-only · Spanish 13% Other Indo-European 3% Other Asian/Pacific 1%
Political lean MEDSL · Montgomery
- 2024 margin
- Solid R (+45.5) · D 26.8% · R 72.3%
- 2008→2024 swing
- +7.2pp toward D · 2008: -52.7pp · 2024: -45.5pp
- All cycles
- 2024: R+45.5 2020: R+43.8 2016: R+51.4 2012: R+60.7 2008: R+52.7
Not yet ingested
- Civics
- —
Market trends
- HPI YoY
- ▼ -64.42%
- Current HPI
- 220.403
- Rent YoY
- ▲ 0.44%
- Metro
- Houston-The Woodlands-Sugar Land, TX
- State GDP YoY
- ▲ 3.95%
- F500 in state
- 110
Industry mix (Fortune 500 HQ in TX)
| Industry | F500 HQs | Revenue |
|---|---|---|
| Energy | 16 | $1,198B |
|
||
| Technology | 5 | $198B |
|
||
| Engineering / Construction | 4 | $72B |
|
||
| Energy Services | 3 | $60B |
|
||
| Utilities | 3 | $41B |
|
||
| Healthcare | 2 | $330B |
|
||
Price history
1 event — show timeline
- 2026-03-22 Listed $272,990 Zillow
Cash-flow waterfall
monthlySold comps — $/sqft
last 12 mo · ≤1 miLoading sold comps…