 61-Plex
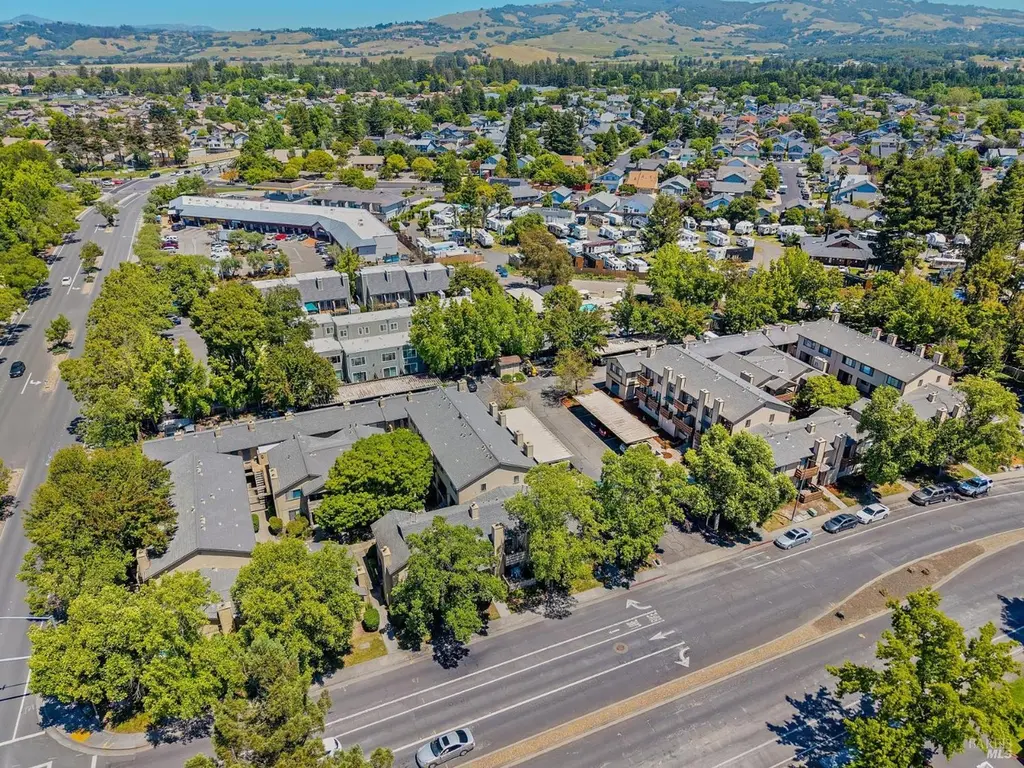
None · Rohnert Park, CA
Flood risk 1/10 · Minimal
- FEMA flood zone
- X (unshaded)
- Chance of flooding over 30 yrs
- 0.0%
- Est. flood insurance / yr
- $507 – $1,088
Fire risk 5/10 · Moderate
- Est. fire insurance / yr
- $659 – $1,223
Heat risk 4/10 · Minor
- Hot days now (above 91°F)
- 7 days/yr
- Hot days in 30 yrs
- 16 days/yr
Wind risk 1/10 · Minimal
- Chance of severe wind over 30 yrs
- —
Air-quality risk 8/10 · Major
- Unhealthy air days now
- 14 days/yr
- Unhealthy air days in 30 yrs
- 15 days/yr
Risk factors via First Street. Map © Google.
Why this score? — see what drove the D+ grade
The composite is a weighted blend of 9 inputs, each scored 0–100. Each bar is that input's sub-score; the figure is the points it added to the 100-point composite (weight × sub-score).
- Cash flow +18.4/30.0
- ARV discount +7.5/15.0
- DSCR +5.8/10.0
- Livability +3.8/5.0
- 1% rule +3.7/10.0
- Schools +3.7/10.0
- Rent growth +3.2/5.0
- Condition / age +2.5/5.0
- Appreciation +0.0/10.0
$15,100,000
🖨 Deal sheet (PDF) 📄 Offer letter ✓ Due diligence
Multi-family units
County records classify this as Multi-Family (5+ Unit). Listing-text estimate: 61 units. confirmed
5+ unit building — per-unit beds/baths from public records are typically unavailable; the breakdown below (if shown) is an estimate from the listing text.
Listing remarks
7425 Camino Colegio is a beautifully maintained 61 unit multi family property in Rohnert Park California. This multifamily asset represents a mid-scale investment opportunity perfectly positioned for long-term growth near Sonoma State University. The property features a diverse and highly marketable unit mix consisting of 2 three bedroom/one and a half bath apartments, 15 two bedroom/one and a half bath apartments, 32 two bedroom/one bath apartments, and 12 one bedroom/one bath apartments. The units have been updated to varying degrees. Most units are equipped with dishwashers, formica or quartz countertops, and private outdoor spaces including decks, balconies, or patios. Investor value i
Key facts
- Diverse unit mix
- Updated units
- Brand-new siding
Tags
Property features AI
Finance
- Financial info: 61 total units
- HOA & community: No association fee
Exterior
- Parking: Combination of uncovered, off-street, and covered parking; 122 total parking spaces; Open parking available
- Utilities: Gas on separate meters; Electric on separate meters; Public sewer; Public water
- Home design: Residential income property; Multi-family (5+ units); Two levels; Built in 1985
- Construction: Year built 1985
- Exterior features: Sidewalks; Irregular-shaped lot; Landscaped front; Court; Corner lot; Eight separate buildings; Total lot area about 2.14 acres
Interior
- Bedrooms: Total of 112 bedrooms
- Heating & cooling: Separate heating; No cooling
- Interior features: Common area laundry; Separate heating system; No central cooling; Washer/dryer units leased
- Laundry & utility: Common area laundry; Washer/dryer units leased
Neighborhood map
What this means for you Summary
Snapshot
- This is a 2×3bd/1.5ba + 15×2bd/1.5ba + 32×2bd/1ba units multifamily listed at $15.10M.
Deal economics
- At list price, monthly cash flow is $14k ($170k/yr) — positive. Per door: $233/mo.
- The deal already cash-flows at list — no discount required.
- To meet the 1% rule (rent ≥ 1% of price), the offer needs to be $13.21M (12.5% below list).
- Recommended offer: $13.21M (12.5% below list) — sets the bar for 1% rule.
- Cap rate 7.4% vs local median 2.9% in Rohnert Park — top-decile yield for the area; either an underpriced asset or a hidden risk that comps aren't pricing in. Stress-test before assuming the spread holds.
Location & tenants
- Location reads 75/100 on livability (#116 in CA, #4,166 nationally) — a middle-class / working-renter tenant base. Strengths: commute A+, employment A+, health & safety A+; Watch: cost of living F.
- Cotati-Rohnert Park Unified (suburban): math 24% / reading 61% proficiency, ranked #205 of 517 in CA (top 40%) — families likely to look elsewhere, expect single-tenant / working-renter base with shorter leases.
- Market conditions: Rents rising (+2.7%/yr); 101 active listings in the ZIP; solid renter incomes; 1,039 units permitted in Sonoma County in 2024 (185 in 5+ unit buildings).
- At $132,057/mo this rent would consume 1596% of the median local household income ($99k/yr) (locally 2507% of renters already pay >50% of income on rent) — very limited rent-growth headroom before tenants either downsize or default.
Forward outlook
- Local home prices are declining (-3.0%/yr); year-one equity from $104k of loan paydown is wiped out by about $453k of value loss. Plan a longer hold.
- Sonoma County population projected at +8% by 2050 — modest demand growth; plan on rents tracking national, not racing it.
Negotiation context
- Only 13 days on market — expect competitive offers; lowballing is unlikely to land.
Risks & watch-outs
- Climate carrying-cost: moderate wildfire risk — expect insurance premiums to compound above CPI over the hold.
Questions for the listing agent
- Can we see the unit-by-unit rent roll, current vacancy, and any below-market leases? What's the average tenancy length?
- What capital expenditures (roof, boiler, parking lot, exteriors) have been made in the last 5 years, and what's planned in the next 2?
- Is there a deadline driving the sale (1031 exchange, divorce, estate, relocation)? That informs how much negotiation room exists.
- Schools are B-rated — typically a magnet for longer-tenancy family renters. What's the average tenant stay here, and is there a school-zone premium baked into asking?
- The area grade is low — what's the realistic commute time and amenity access for the typical tenant pool here? Any planned neighborhood developments (good or bad) we should know about?
- What's the average days-on-market for RENTAL listings here right now (not sales)? A rising rental-DOM trend means longer vacancies and softer asking-rent achievability than the comps imply.
- What's the recent tenant-quality profile in this submarket — average credit score on applications, eviction rate, late-payment / NSF rate, and stable-employment percentage? A property-management company in the area should have these aggregated.
- How much new apartment / multifamily construction is in the pipeline within 1–3 miles? Heavy new supply (>2% of stock underway) typically softens rents 12–24 months out; light construction supports rent growth.
Investment metrics
- 1% rule
- 0.87% ✗
- Cap rate
- 7.42%
- Cash-on-cash
- 4.03%
- DSCR
- 1.18
- GRM
- 9.5
CMA / ARV
No comps found within radius.
Projected returns pro-forma
-3.0% appreciation · 2.69% rent growth · sell at horizon
- IRR
- -10.4%
- Equity multiple
- 0.62×
- Total profit
- $-1,590,454
- Equity at exit
- $2,251,459
- IRR
- -1.5%
- Equity multiple
- 0.90×
- Total profit
- $-415,497
- Equity at exit
- $1,305,572
Cash invested: $4,228,000 (down + closing). Projections, not guarantees.
Landlord ↔ Tenant lean methodology
- Overall (STATE)
- 18 Strongly Tenant-Friendly
- State California
- 18 Strongly Tenant-Friendly · D+13
- County
- — inherits STATE
- City
- — inherits STATE
ZIP-level market 94928
- Rents YoY
- 2.7%
- Active inventory
- 101
- Price-to-rent
- 489.8×
Monthly cashflow live
- Estimated rent
- $132,057 high interval (Pro) →
- Mortgage (P&I)
- −$79,186
- Tax from tax record
- −$4,650 /mo · $55,805/yr
- Insurance
- −$6,292
- HOA
- −$0
- Vacancy / Maint / Mgmt
- −$27,732
- Net cashflow
- $14,197
Break-even live
Sensitivity live
| Price | -10% $22,745 | -5% $18,471 | +0% $14,197 | +5% $9,923 | +10% $5,649 |
|---|---|---|---|---|---|
| Rent | -10% $3,764 | -5% $8,981 | +0% $14,197 | +5% $19,413 | +10% $24,629 |
| Rate | -1.0pp $21,801 | -0.5pp $18,037 | base $14,197 | +0.5pp $10,284 | +1.0pp $6,303 |
61-unit breakdown (identical units grouped — click to expand)
| Units | Beds | Baths | Est. rent |
|---|---|---|---|
| 2× units | 3 | 1.5 | $5,138 |
| #1 | 3 | 1.5 | $2,569 |
| #2 | 3 | 1.5 | $2,569 |
| 15× units | 2 | 1.5 | $32,970 |
| #3 | 2 | 1.5 | $2,198 |
| #4 | 2 | 1.5 | $2,198 |
| #5 | 2 | 1.5 | $2,198 |
| #6 | 2 | 1.5 | $2,198 |
| #7 | 2 | 1.5 | $2,198 |
| #8 | 2 | 1.5 | $2,198 |
| #9 | 2 | 1.5 | $2,198 |
| #10 | 2 | 1.5 | $2,198 |
| #11 | 2 | 1.5 | $2,198 |
| #12 | 2 | 1.5 | $2,198 |
| #13 | 2 | 1.5 | $2,198 |
| #14 | 2 | 1.5 | $2,198 |
| #15 | 2 | 1.5 | $2,198 |
| #16 | 2 | 1.5 | $2,198 |
| #17 | 2 | 1.5 | $2,198 |
| 32× units | 2 | 1 | $70,336 |
| #18 | 2 | 1 | $2,198 |
| #19 | 2 | 1 | $2,198 |
| #20 | 2 | 1 | $2,198 |
| #21 | 2 | 1 | $2,198 |
| #22 | 2 | 1 | $2,198 |
| #23 | 2 | 1 | $2,198 |
| #24 | 2 | 1 | $2,198 |
| #25 | 2 | 1 | $2,198 |
| #26 | 2 | 1 | $2,198 |
| #27 | 2 | 1 | $2,198 |
| #28 | 2 | 1 | $2,198 |
| #29 | 2 | 1 | $2,198 |
| #30 | 2 | 1 | $2,198 |
| #31 | 2 | 1 | $2,198 |
| #32 | 2 | 1 | $2,198 |
| #33 | 2 | 1 | $2,198 |
| #34 | 2 | 1 | $2,198 |
| #35 | 2 | 1 | $2,198 |
| #36 | 2 | 1 | $2,198 |
| #37 | 2 | 1 | $2,198 |
| #38 | 2 | 1 | $2,198 |
| #39 | 2 | 1 | $2,198 |
| #40 | 2 | 1 | $2,198 |
| #41 | 2 | 1 | $2,198 |
| #42 | 2 | 1 | $2,198 |
| #43 | 2 | 1 | $2,198 |
| #44 | 2 | 1 | $2,198 |
| #45 | 2 | 1 | $2,198 |
| #46 | 2 | 1 | $2,198 |
| #47 | 2 | 1 | $2,198 |
| #48 | 2 | 1 | $2,198 |
| #49 | 2 | 1 | $2,198 |
| 12× units | 1 | 1 | $23,592 |
| #50 | 1 | 1 | $1,966 |
| #51 | 1 | 1 | $1,966 |
| #52 | 1 | 1 | $1,966 |
| #53 | 1 | 1 | $1,966 |
| #54 | 1 | 1 | $1,966 |
| #55 | 1 | 1 | $1,966 |
| #56 | 1 | 1 | $1,966 |
| #57 | 1 | 1 | $1,966 |
| #58 | 1 | 1 | $1,966 |
| #59 | 1 | 1 | $1,966 |
| #60 | 1 | 1 | $1,966 |
| #61 | 1 | 1 | $1,966 |
| Total (61 units) | $132,057 | ||
UW: 25.0% down · 7.5% · 30yr · 1.5% tax · 5.0% vac · 8.0% maint · 8.0% mgmt
Financing live
Cash to close
- Down payment
- $3,775,000
- Closing costs
- $453,000
- Reserves months
- —
- Total cash needed
- —
Loan-product check · same deal, 3 products live
Conventional
25% down · 7.5% · 30yr
- Down + closing
- —
- Monthly P&I
- —
- Monthly cashflow
- —
- DSCR
- —
- Eligible?
- —
Personal DTI + credit; lowest rate.
DSCR
20% down · 8.5% · 30yr
- Down + closing
- —
- Monthly P&I
- —
- Monthly cashflow
- —
- DSCR
- —
- Eligible?
- —
No personal income docs; deal must DSCR.
Hard money
10% down · 12.0% · 12mo
- Down + closing
- —
- Monthly P&I
- —
- Monthly cashflow
- —
- DSCR
- —
- Eligible?
- —
Short-term bridge; refi at stabilization.
Listing history 10 events
-
2026-06-21days on market $15,100,000 Active 13 DOM
-
2026-06-18days on market $15,100,000 Active 10 DOM
-
2026-06-17days on market $15,100,000 Active 9 DOM
-
2026-06-16days on market $15,100,000 Active 8 DOM
-
2026-06-15days on market $15,100,000 Active 7 DOM
-
2026-06-14days on market $15,100,000 Active 5 DOM
-
2026-06-13days on market $15,100,000 Active 4 DOM
-
2026-06-10days on market $15,100,000 Active 2 DOM
-
2026-06-09remarks 699-char remark
-
2026-06-09$15,100,000 Active 1 DOM
ⓘ Source: listings_history table (triggers on properties + properties_extension) + one-shot
backfill from property_details.listing_events for pre-trigger history.
Tax reassessment forecast CA · Resets to sale price
- Current annual tax
- $55,805 · $4,650/mo
- Projected year-2 tax
- $114,760 · $9,563/mo
- Expected delta
- +$58,955/yr (+$4,913/mo · 105.6%)
ⓘ Screening estimate from a state-policy table — verify with the county assessor before closing.
Climate risk First Street
- Flood 1/10 Low FEMA zone X (unshaded) · 0% chance over 30 yrs
- Wildfire 5/10 Major
- Heat 4/10 Moderate 7 d/yr ≥91°F today · 16 d/yr by 30 yrs out
- Wind 1/10 Low
- Air quality 8/10 Severe 14 unhealthy d/yr today · 15 by 30 yrs out
Nearby sold comps map
Loading sold comps map…
Walkable amenities ~0.75 mi
Loading nearby amenities…
Taxation est. · year 1
- Rental income
- $1,584,684
- − Mortgage interest
- −$845,835
- − Property taxes
- −$55,805
- − Insurance
- −$75,500
- − Repairs & maintenance
- −$126,775
- − Management
- −$126,775
- − Depreciation
- −$439,273
- Taxable loss
- −$85,278
- Est. tax savings @ 24.0%
- +$20,467
- After-tax cash flow
- $190,830/yr
For passive investors: Depreciation is non-cash, so a rental often shows a tax loss while cash-flowing — sheltering income. Rental losses are passive: they offset passive income freely, and up to $25,000/yr can offset ordinary (W-2) income if you actively participate and your MAGI is under $100k (phasing out to $0 by $150k); unused losses carry forward. On sale, claimed depreciation is recaptured at up to 25%, and gains may owe capital-gains tax (a 1031 exchange can defer both). Figures are a year-1 estimate at your 24.0% rate — not tax advice; consult a CPA.
Schools (NCES district)
- District
- Cotati-Rohnert Park Unified
- NCES district ID
- 0609940
- Math proficiency
- 24% ▼ -6.00%
- Reading proficiency
- 61% ▲ 15.00%
- Median HH income
- $60,499
- Composite
- 37.42/100
- National rank
- #4420
- State rank
- #205 of 517 in CA
Livability — Rohnert Park
- Score
- 75/100
- State rank
- #116
- US rank
- #4166
Category grades
Schools grade is shown separately in the Schools card above.
Census & demographics
- Census place
- Rohnert Park, CA
- County
- Sonoma County · 449,805 people
- City population
- 46,829
- Metro
- Santa Rosa-Petaluma, CA
- Population (ZIP)
- 46,829
- Household income
- $99,280
- Rent vs Own
- Severe rent burden
- 2507.0
Population outlook (Sonoma County) Hauer SSP2
- Today (2025)
- 539,935 people
- By 2030
- 554,870 · +2.8%
- By 2040
- 573,262 · +6.2%
- By 2050
- 580,715 · +7.6%
- By 2075
- 579,229 · +7.3%
- By 2100
- 547,835 · +1.5%
Race, ethnicity, and origin ACS 2023
- Neighborhood character
- Diverse neighborhood (Simpson 0.62)
- Race & ethnicity
- White 52% Hispanic / Latino 33% Two or more races 19% Asian 6% Black 3% Native American 1%
- Hispanic origin (detail)
- Mexican 25%
- Common ancestry
- Italian 5% Slovak 3% Romanian 2%
- Foreign-born
- 15% · Canada, China, Vietnam
- Languages at home
- 72% English-only · Spanish 20% Other Asian/Pacific 2% Russian/Polish/Slavic 1%
Political lean MEDSL · Sonoma
- 2024 margin
- Solid D (+46.2) · D 71.4% · R 25.2% · Other 3.3%
- 2008→2024 swing
- -3.4pp toward R · 2008: 49.6pp · 2024: 46.2pp
- All cycles
- 2024: D+46.2 2020: D+51.5 2016: D+47.9 2012: D+44.9 2008: D+49.6
Not yet ingested
- Civics
- —
Market trends
- HPI YoY
- ▼ -628.14%
- Current HPI
- 259.9121
- Rent YoY
- ▲ 2.69%
- Metro
- Santa Rosa-Petaluma, CA
- State GDP YoY
- ▲ 3.21%
- F500 in state
- 116
Industry mix (Fortune 500 HQ in CA)
| Industry | F500 HQs | Revenue |
|---|---|---|
| Technology | 27 | $1,492B |
|
||
| Financial Services | 3 | $174B |
|
||
| Retail | 3 | $44B |
|
||
| Insurance | 3 | $26B |
|
||
| Media / Entertainment | 2 | $115B |
|
||
| Pharmaceuticals / Biotech | 2 | $62B |
|
||
Price history
1 event — show timeline
- 2026-06-08 Listed $15,100,000 San Francisco MLS
Property tax history
+1.6%/yrLatest (2025): $55,805 · +4.0% YoY. Source: county tax records.
Cash-flow waterfall
monthlySold comps — $/sqft
last 12 mo · ≤1 miLoading sold comps…